Anomaly Aggregation method

a technology of anomaly detection and aggregation method, which is applied in the direction of instruments, testing/monitoring control systems, process and machine control, etc., can solve the problems of difficult to diagnose anomalies in data, difficult to simultaneously monitor many tags, and large amount of noise in sensor data

Inactive Publication Date: 2009-01-29
GENERAL ELECTRIC CO
View PDF6 Cites 36 Cited by
  • Summary
  • Abstract
  • Description
  • Claims
  • Application Information

AI Technical Summary

Problems solved by technology

For example, increasing values (over time) of rotor vibration in a compressor, may be an indication of a serious problem.
However, there is a considerable amount of noise in sensor data.
Even then, it is still very hard to simultaneously monitor many tags (there can be several hundred to thousands of tags) and diagnose the anomalies in the data.
However, this approach necessitates a subjective assessment as to whether a given tag is anomalously high or low.
While a z-score can be effective in evaluating the degree to which a single observation is anomalous in a well populated group, z-scores have been shown to lose their effectiveness as an indication of anomalousness when used on sets of data that contain only a small number of values.
For instance, when comparing a machine (e.g., a turbine) to a set of peer machines (e.g., similar turbines), it is often the case that it is difficult to identify more than a handful of machines that can legitimately be considered peers of the target machine.
As a result, it is often not desirable or accurate to use standard z-scores as a measurement for anomaly scores since standard z-scores are not robust with small datasets.

Method used


Image

  • Anomaly Aggregation method
  • Anomaly Aggregation method
  • Anomaly Aggregation method

Examples


Embodiment Construction

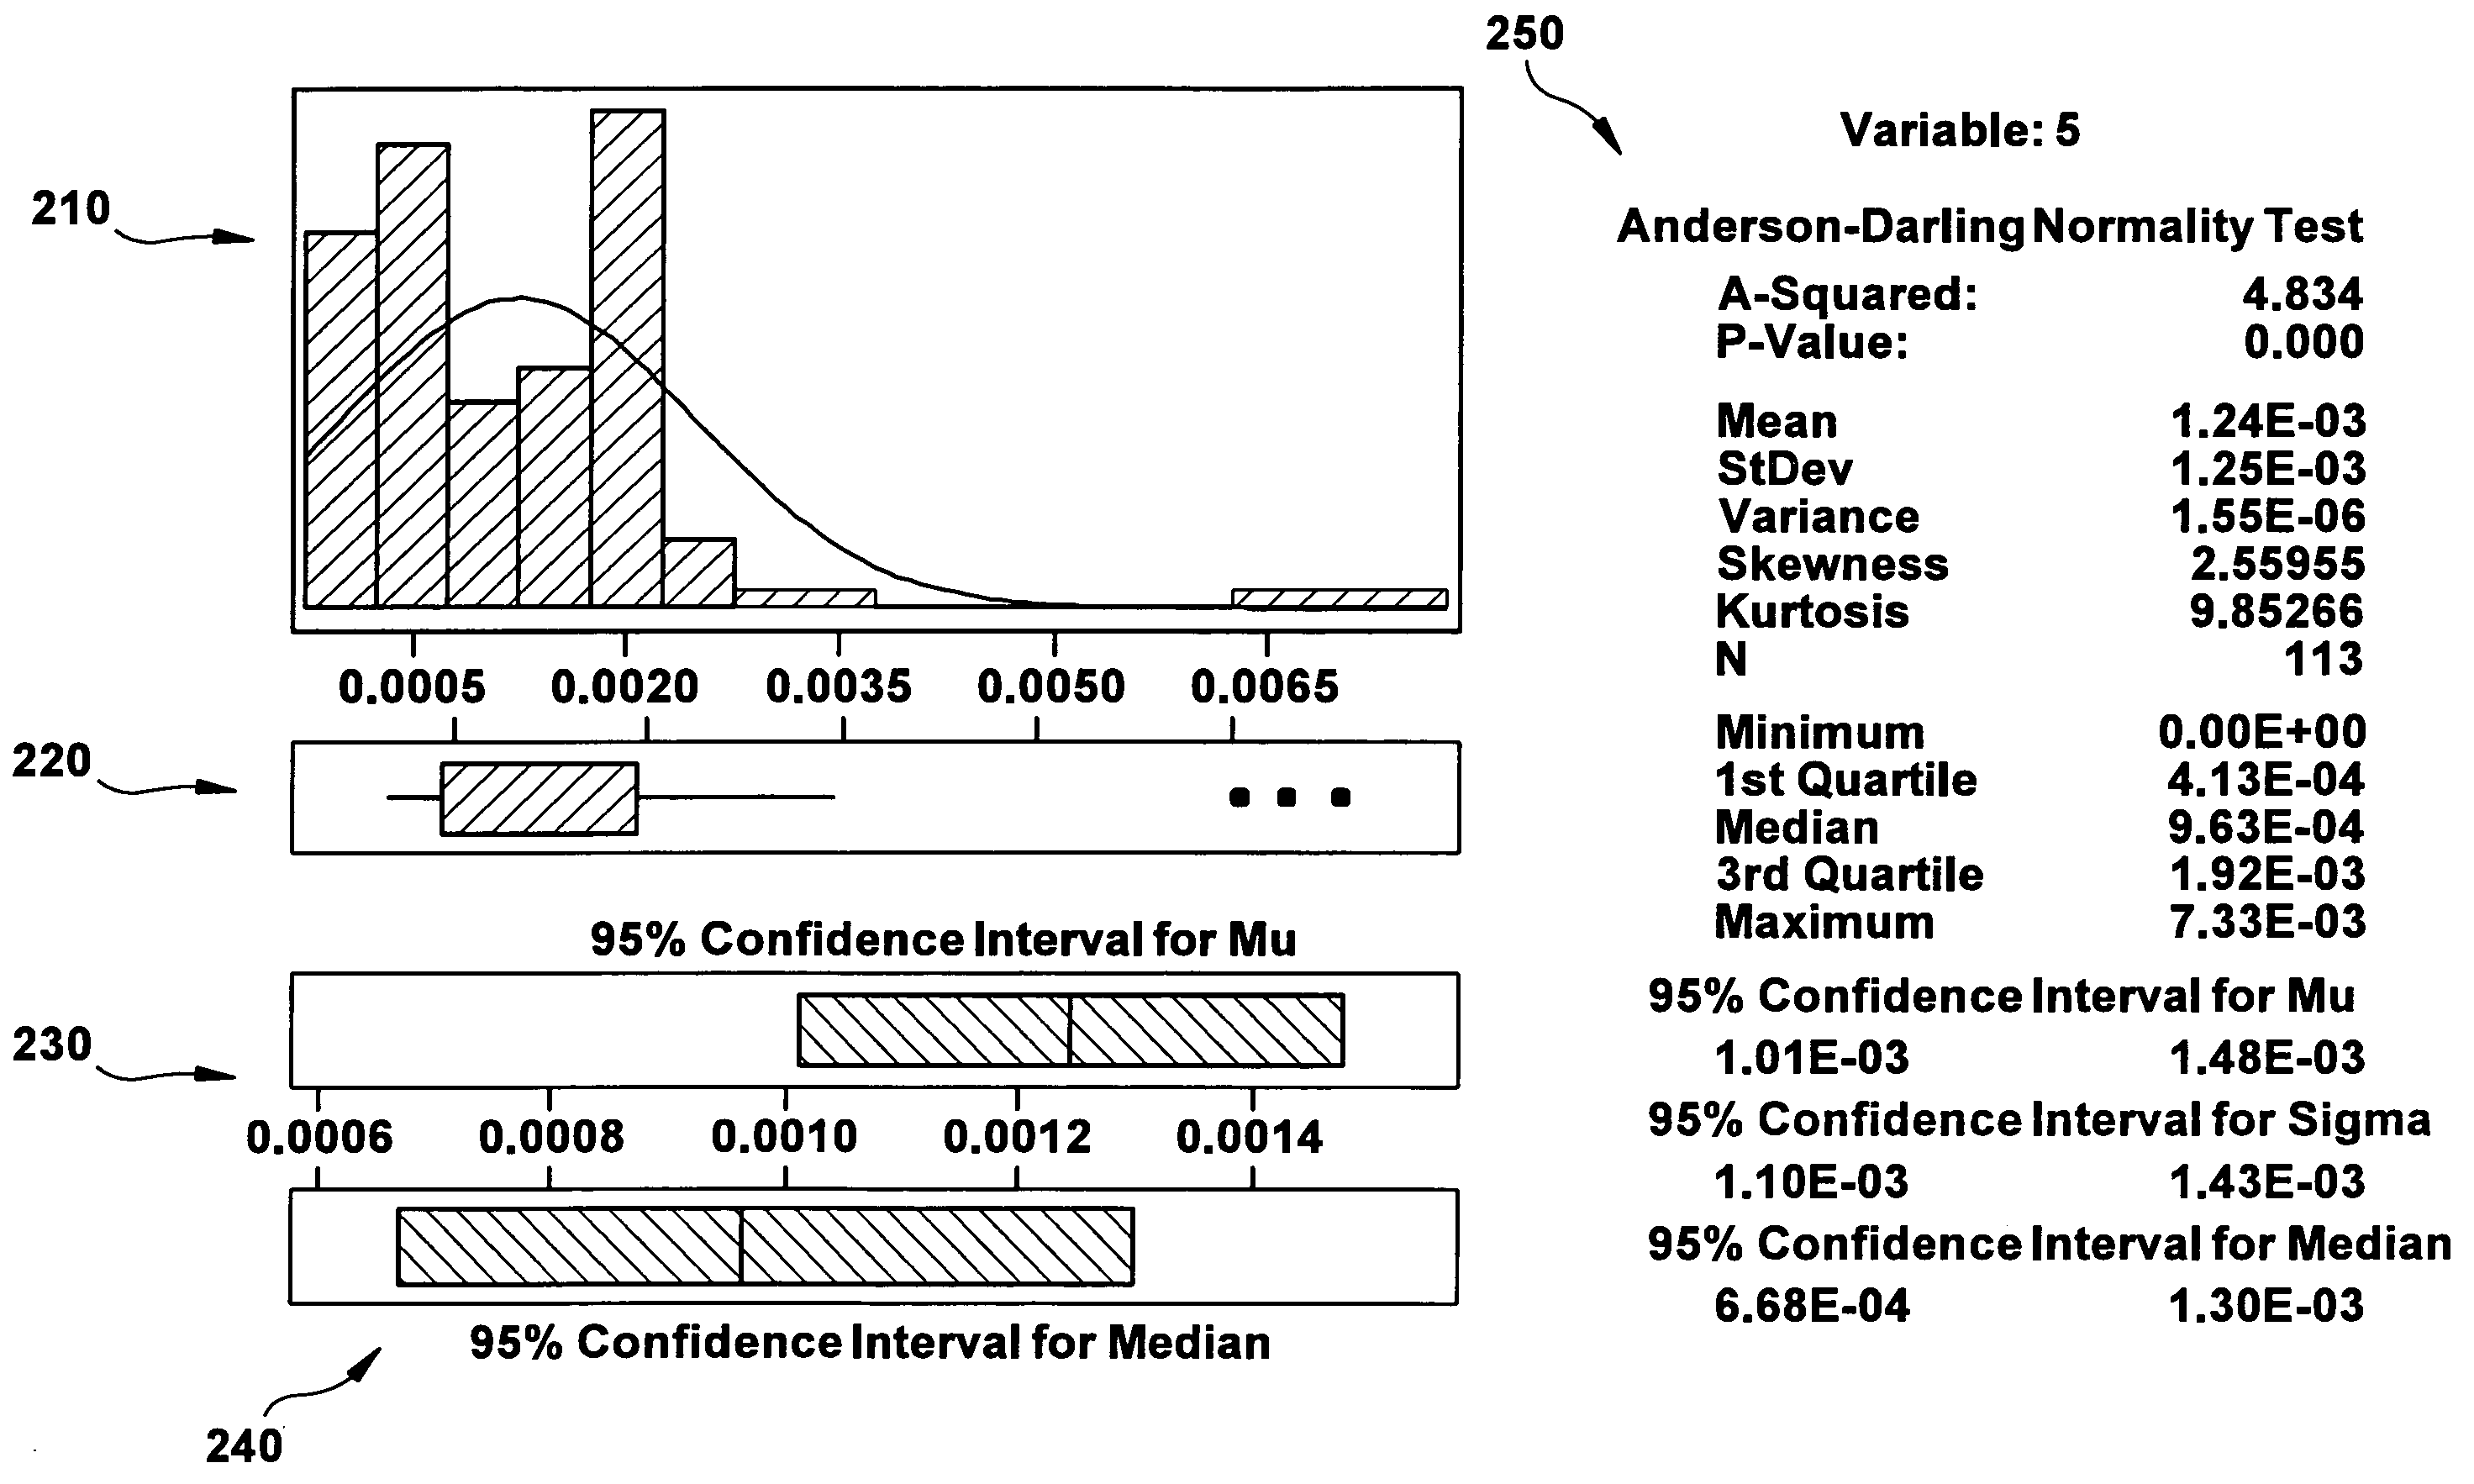
[0024]In monitoring and diagnostics (M&D), eliminating noise from data is a key concept. It becomes non-trivial when there are a lot of variables that need to be monitored simultaneously per second and even more so when condition adjustment (e.g., temperature, operating mode, pressure, etc.) is required. An anomaly detection and aggregation process and heatmap tool is herein described that is highly useful and revolutionary for monitoring and diagnostics. The process, method and tool, as embodied by the present invention, is particularly useful when applied to power generation equipment, such as, compressors, generators and turbines. However, the process, method and tool can be applied to any machine or system that needs to be monitored. For example, other machines that can be used with the present invention are gas turbines, hydroelectric turbines, steam turbines, bio-fueled turbines, wind turbines, engines, gensets, and locomotives. The process, method and tool comprises five main...


PUM


Abstract

A method for aggregating anomalous values is provided. The method comprises obtaining operational data from at least one machine and calculating at least one exceptional anomaly score from the operational data. The exceptional anomaly scores can then be aggregated to identify acute or chronic anomalous values.

Description

BACKGROUND OF THE INVENTION[0001]The present invention is related to the following application Ser. No. ______, titled “Fleet Anomaly Detection Method” and filed on ______.[0002]The systems and methods described herein relate generally to aggregating anomalous values. More specifically, the systems and methods relate to statistical techniques to aggregate outlying (i.e., anomalous) engineering or operational data when compared to small sets of related engineering or operational data.[0003]In the operation and maintenance of power generation equipment (e.g., turbines, compressors, generators, etc.), sensor readings corresponding to various attributes of the machine are received and stored. These sensor readings are often called “tags”, and there are many types of tags (e.g., vibration tags, efficiency tags, temperature tags, pressure tags, etc.).[0004]Close monitoring of these tags across time has many benefits in understanding machine deterioration characteristics (e.g., internal da...

Claims


Application Information

Patent Timeline
Patent Type & Authority Applications(United States)
IPC IPC(8): G06F9/44G01M99/00
CPCG05B23/0221G07C3/00G06Q10/0639G06K9/00536G06F2218/12
Inventor SENTURK-DOGANAKSOY, DENIZLACOMB, CHRISTINA A.RUCIGAY, RICHARD J.SKOWRONEK, PETER T.TRAVALY, ANDREW J.
Owner GENERAL ELECTRIC CO
Why Eureka
Try Eureka