Displaying Bar Charts With A Fish-Eye Distortion Effect

Active Publication Date: 2010-08-26
SAP AG
View PDF6 Cites 32 Cited by
  • Summary
  • Abstract
  • Description
  • Claims
  • Application Information

AI Technical Summary

Benefits of technology

[0005]The present invention enables the display of chart type data on a device having a display area that is small compared to the amount of data being shown in the chart. Examples of suitable devices include tablet computers, smart phone devices, and mobile phones. A fish-eye magnification area (also referred to as fish-eye or fish-eye distortion region or distortion region) allows a portion of a chart or graph data to be displayed at a larger size and to include additional information compared to the graphic data displayed outside the distortion region. The distortion region displays data points with varying levels of magnification. The level of magnification of a data point determines the size of the graph

Problems solved by technology

There are several challenges in trying to show graphs and charts on such devices.
In addition,

Method used


Image

  • Displaying Bar Charts With A Fish-Eye Distortion Effect
  • Displaying Bar Charts With A Fish-Eye Distortion Effect
  • Displaying Bar Charts With A Fish-Eye Distortion Effect

Examples


Example

[0018]Reference will now be made in detail to several embodiments, examples of which are illustrated in the accompanying figures. It is noted that wherever practicable similar or like reference numbers may be used in the figures and may indicate similar or like functionality. The figures depict embodiments of the disclosed system (or method) for purposes of illustration only. One skilled in the art will readily recognize from the following description that alternative embodiments of the structures and methods illustrated herein may be employed without departing from the principles described herein.

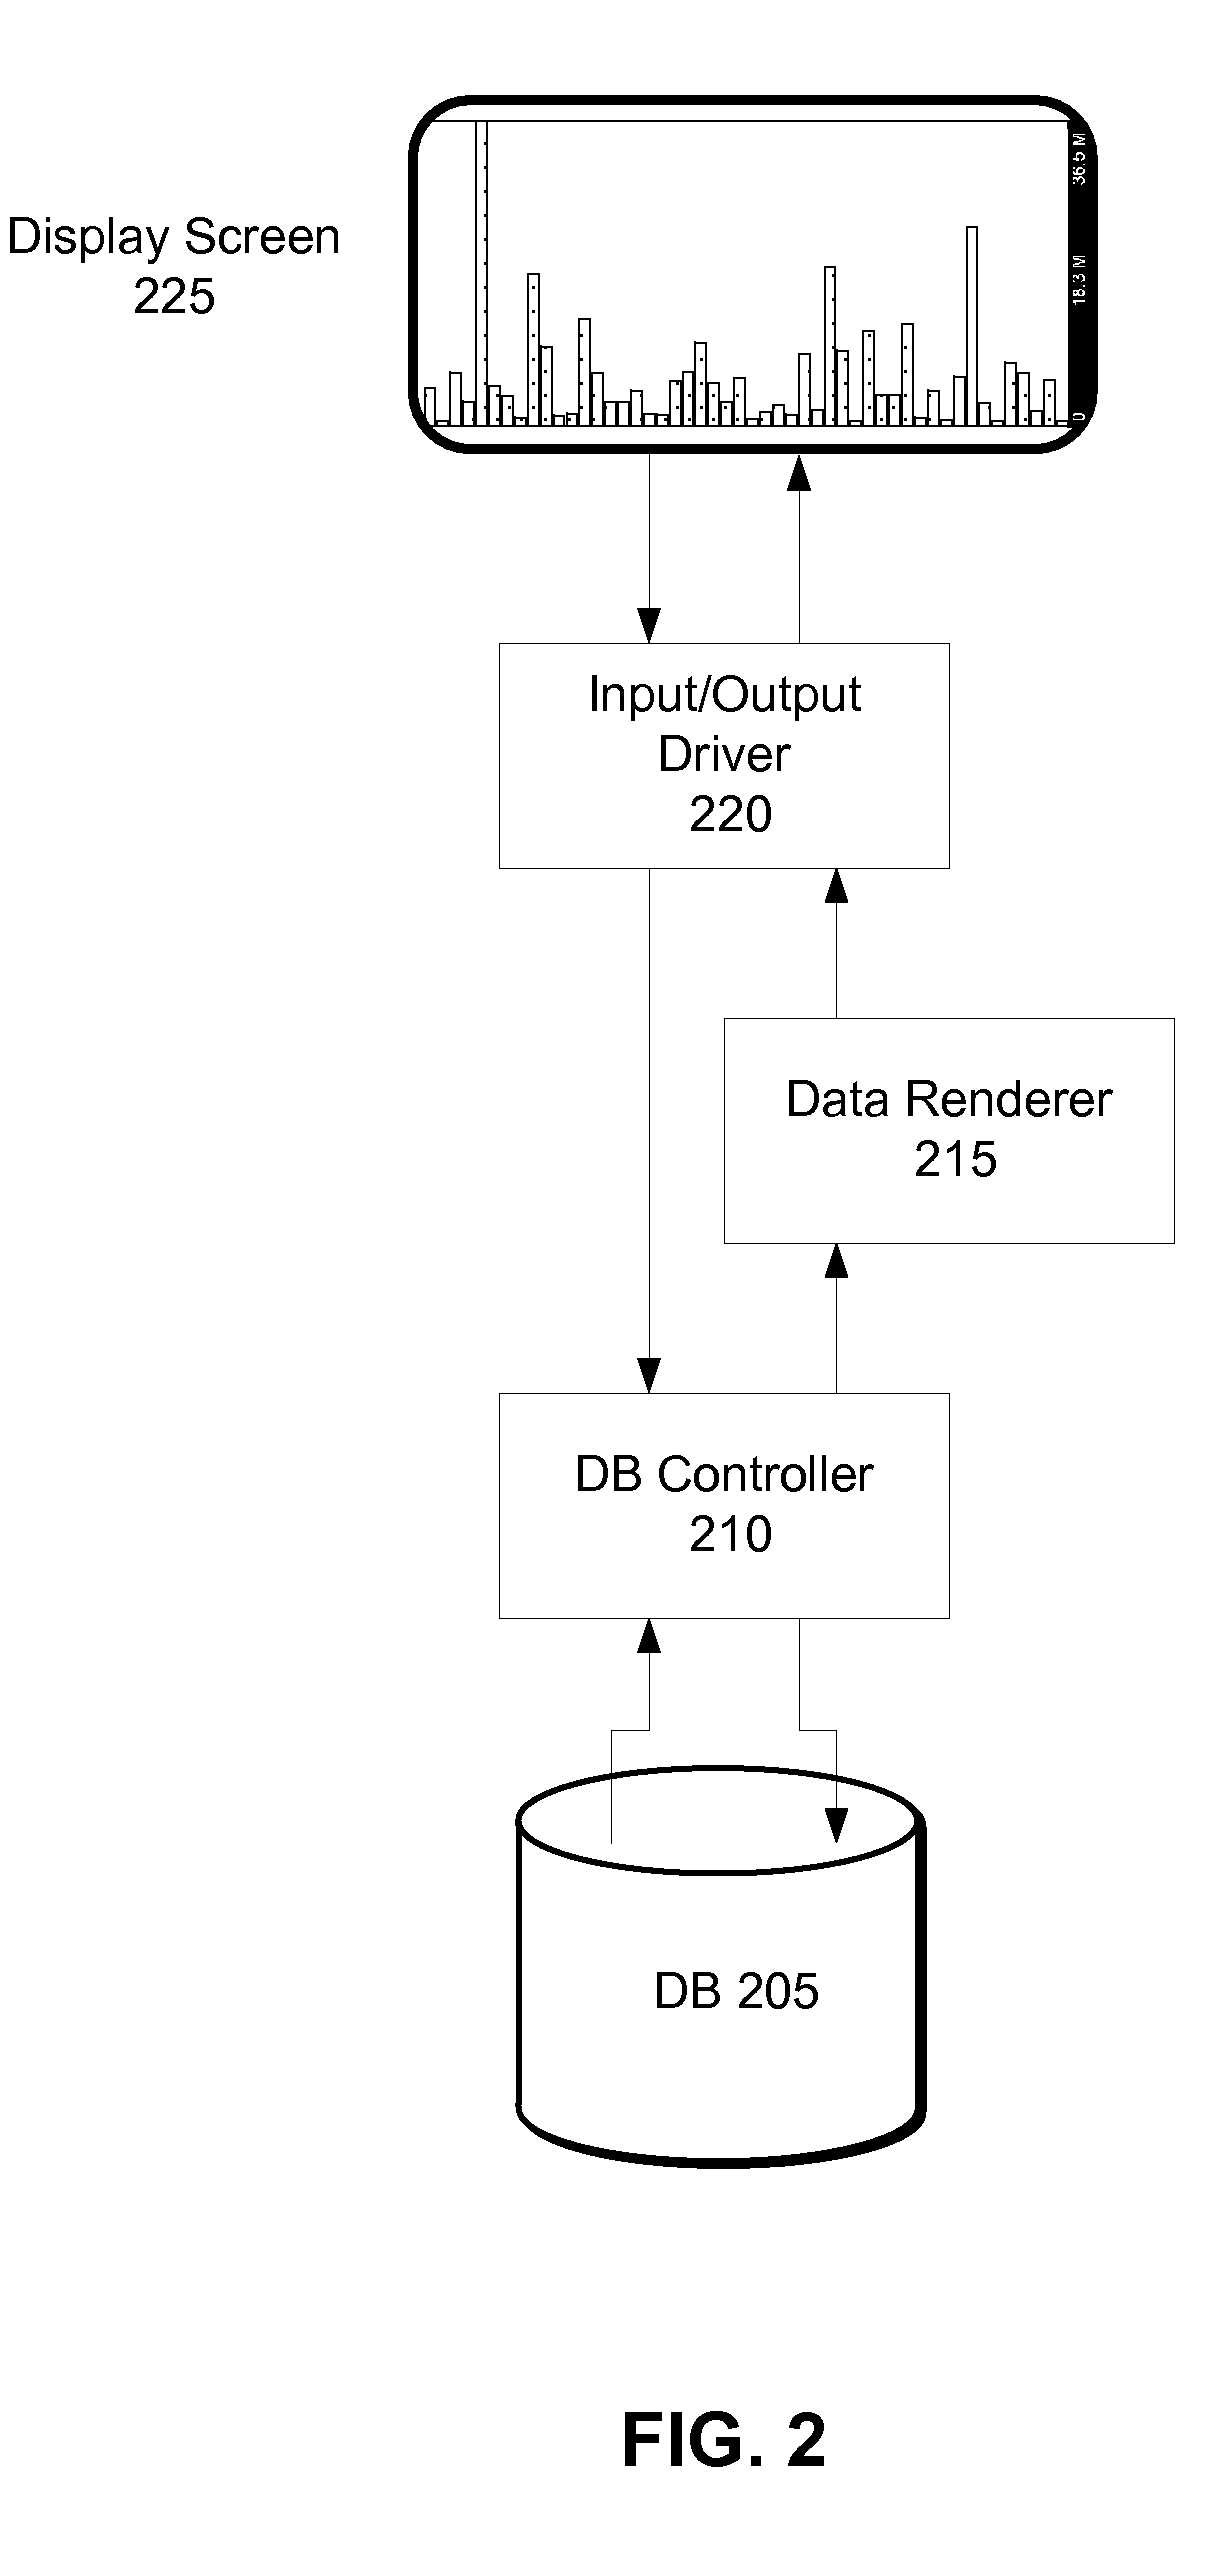
[0019]FIG. 2 is a block diagram of a system architecture in accordance with one embodiment. The components shown in FIG. 2 include a database (DB) 205, a DB controller module 210, a data renderer module 215, an input / output driver module 220, and a display screen 225. Components such as the display screen 225 are hardware components whereas the DB controller 210 and the chart renderer 215 ...


PUM


Abstract

A system and a method are disclosed for visually displaying data points using charts on a display screen with limited display area. A fish-eye distortion region allows presentation of detailed information for some data points compared to other data points that are displayed. The chart can be moved relative to the distortion region thereby changing the data points displayed within the fish-eye that present additional information. The relative movement between the chart and the distortion region is triggered by different kinds of inputs from the user including, tilting of the device, swiping with a pointing device and selecting a particular data point.

Description

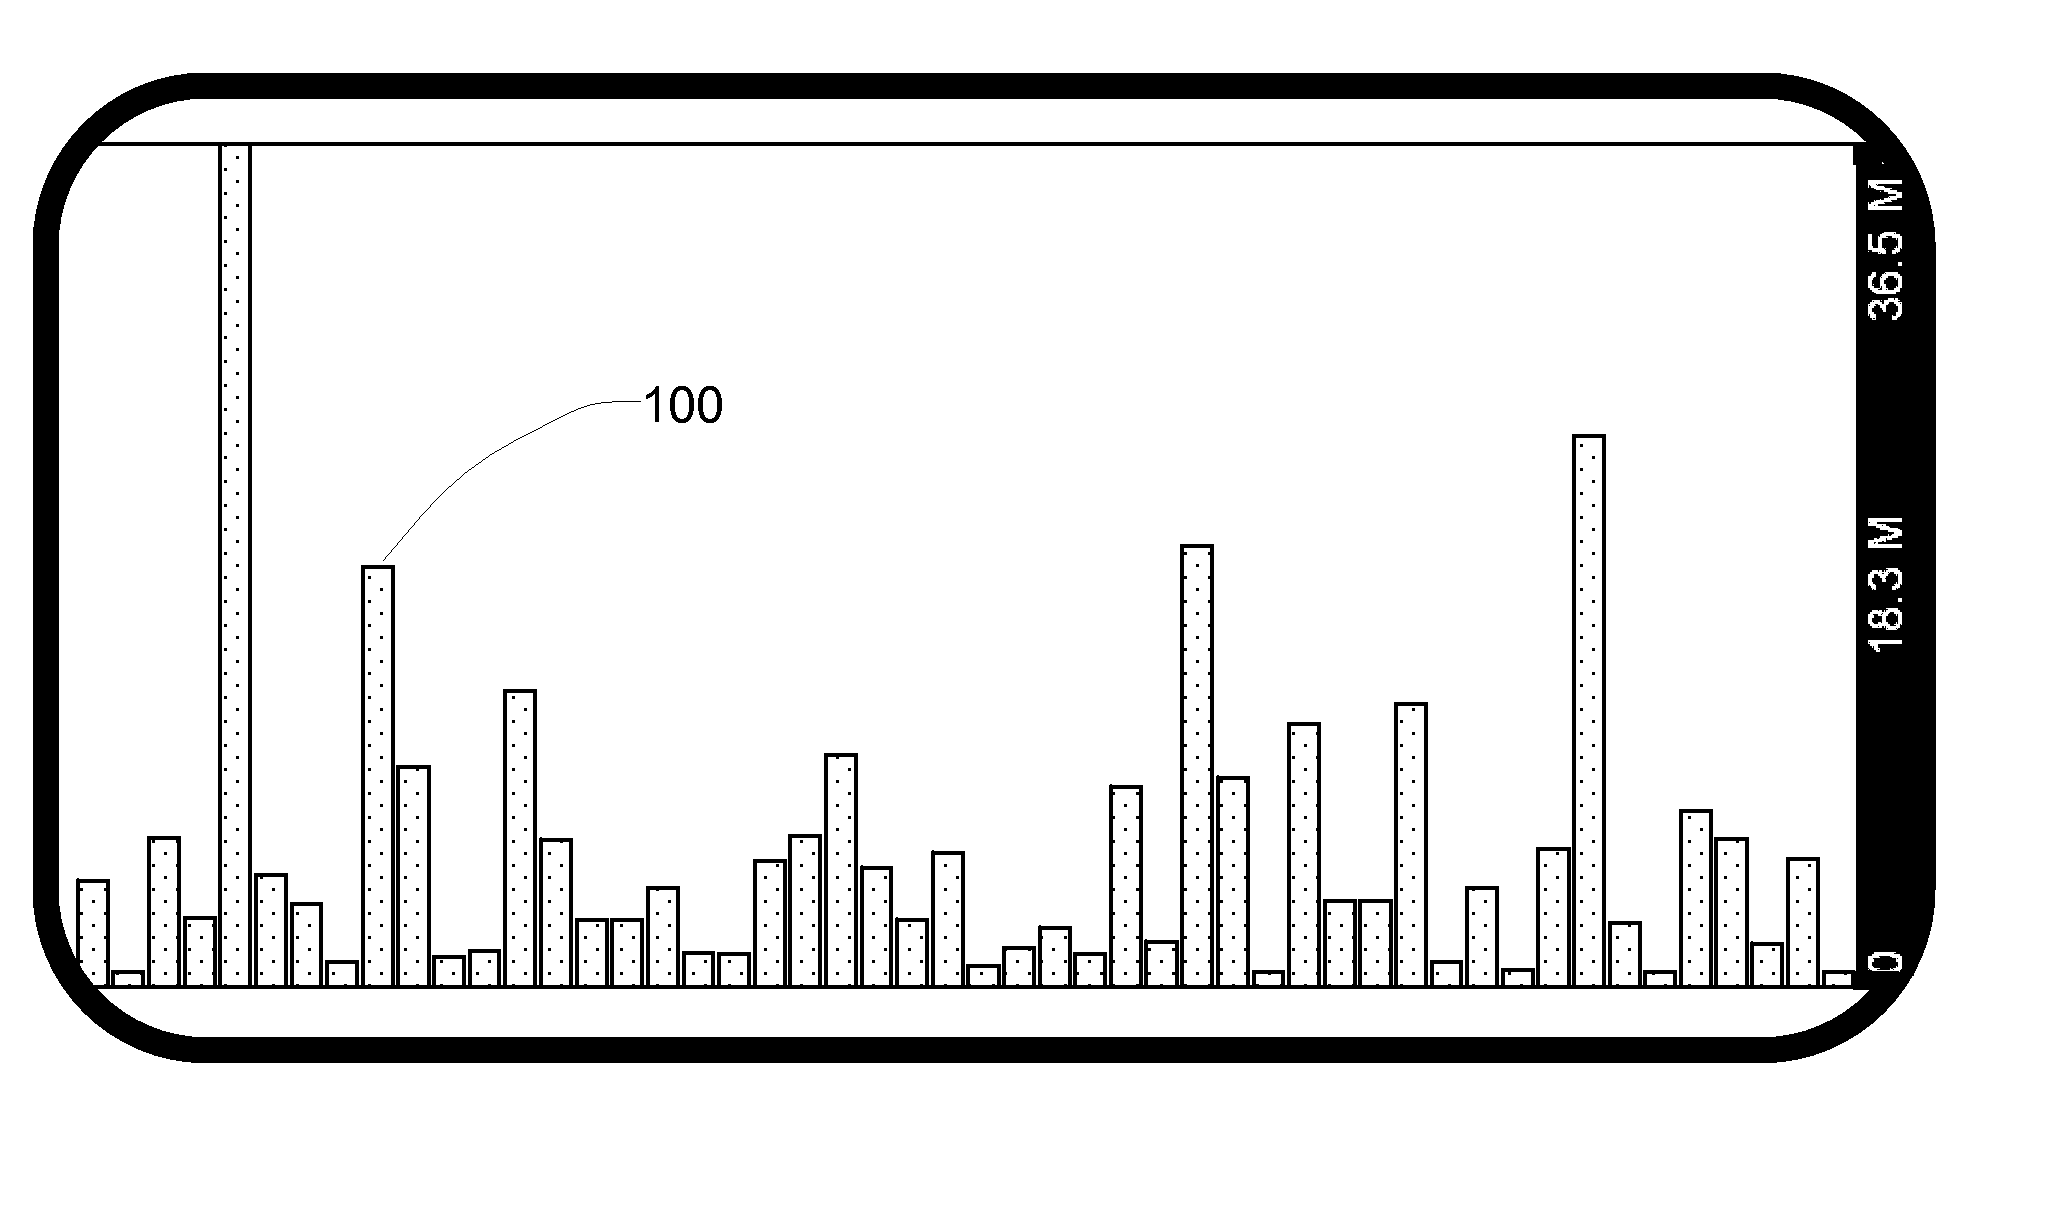
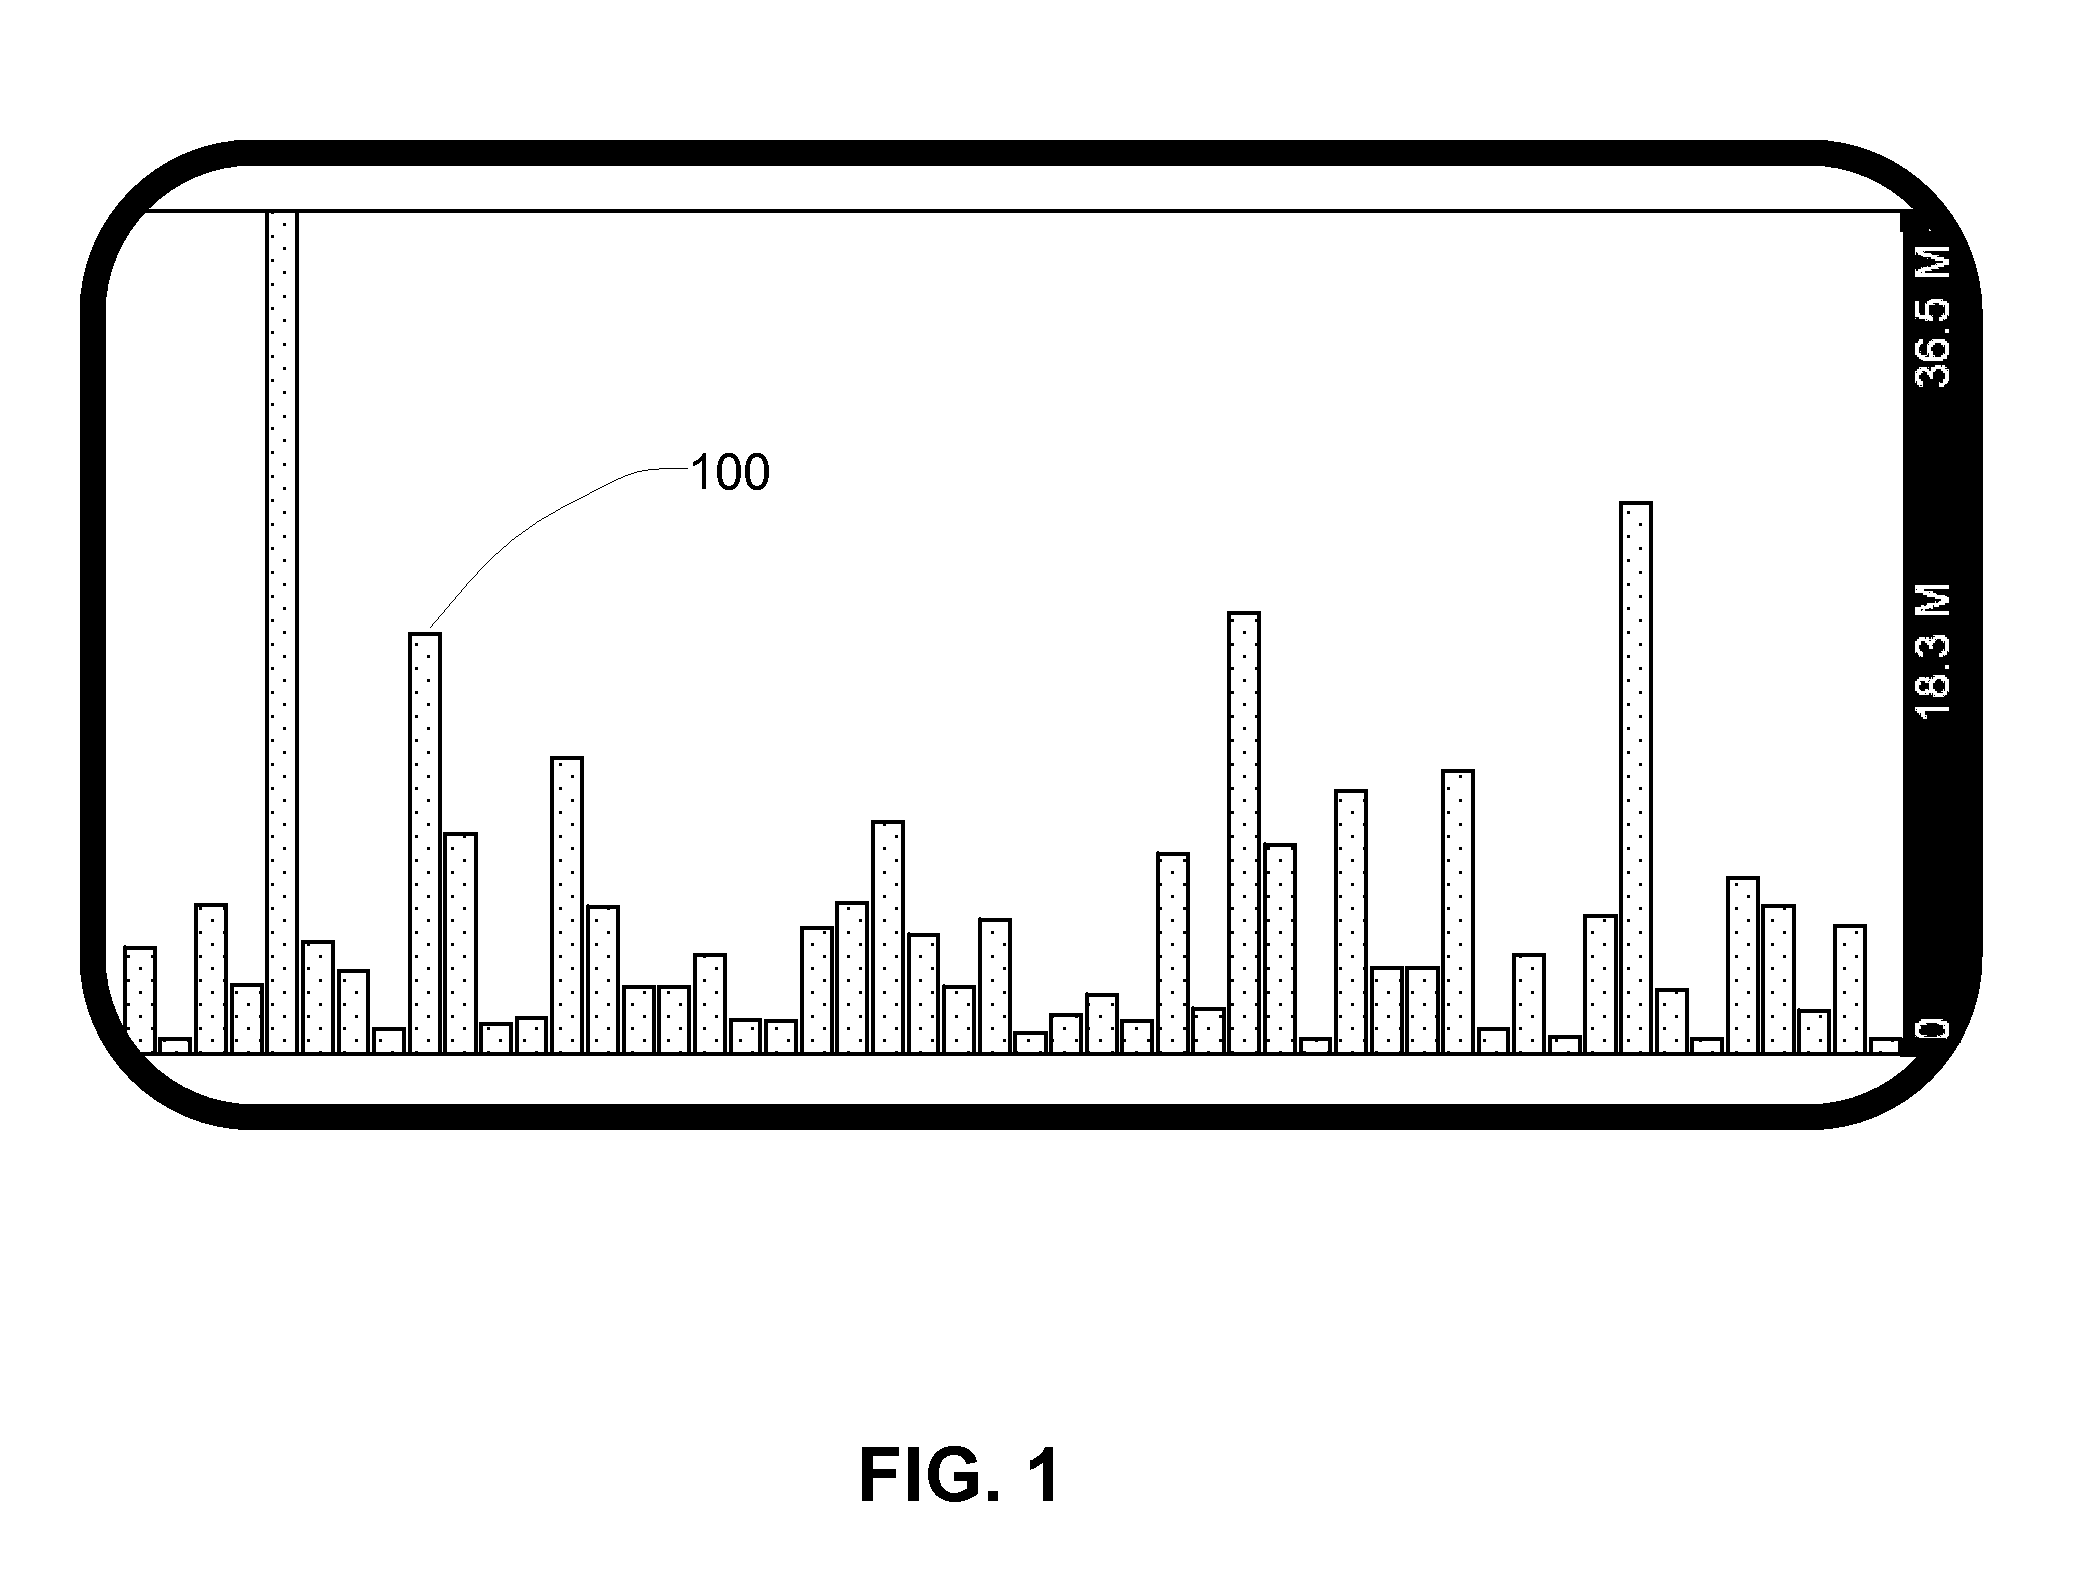
BACKGROUND[0001]1. Field of Art[0002]The disclosure generally relates to displaying reports on a device having a display area that is small relative to the amount of data that is being displayed.[0003]2. Description of the Related Art[0004]There are several ways of using charts or graphs to visually present statistical data available in reports including, for example, bar charts, pie charts, line graphs, and scatter graphs. On a mobile device such as a handheld device, handheld computer, cell phone, tablet computer, or personal digital assistant (PDA), graphs and charts have to be displayed on small display screens with display areas that are limited in size compared to the data being shown. There are several challenges in trying to show graphs and charts on such devices. For example, FIG. 1 illustrates some of the obstacles encountered in displaying a bar chart on a small screen. The height of each bar 100 in the bar chart is proportional to the y-coordinate value represented by th...

Claims


Application Information

Patent Timeline
IPC IPC(8): G06T11/20
CPCG06T11/206
Inventor ALSBURY, QUINTONBECERRA, DAVID
Owner SAP AG
Why Eureka
Try Eureka