
Method for estimation of order-based statistics on slowly changing distributions

Inactive Publication Date: 2011-04-21
TERADATA US
View PDF1 Cites 8 Cited by
  • Summary
  • Abstract
  • Description
  • Claims
  • Application Information

AI Technical Summary

Benefits of technology

[0100]For applications requiring percentile (or quantile) based statistics, the conversion of the data to a histogram provides an alternative method for rapid calculations without requiring re-

Problems solved by technology

For large data sets, this can require considerable time when only a small amount of new data is added or removed.

Method used


Image

  • Method for estimation of order-based statistics on slowly changing distributions
  • Method for estimation of order-based statistics on slowly changing distributions
  • Method for estimation of order-based statistics on slowly changing distributions

Examples


examples

[0048]The following examples illustrate one embodiment of the present invention.

[0049]Statistics of Slowly Changing Large Data Sets

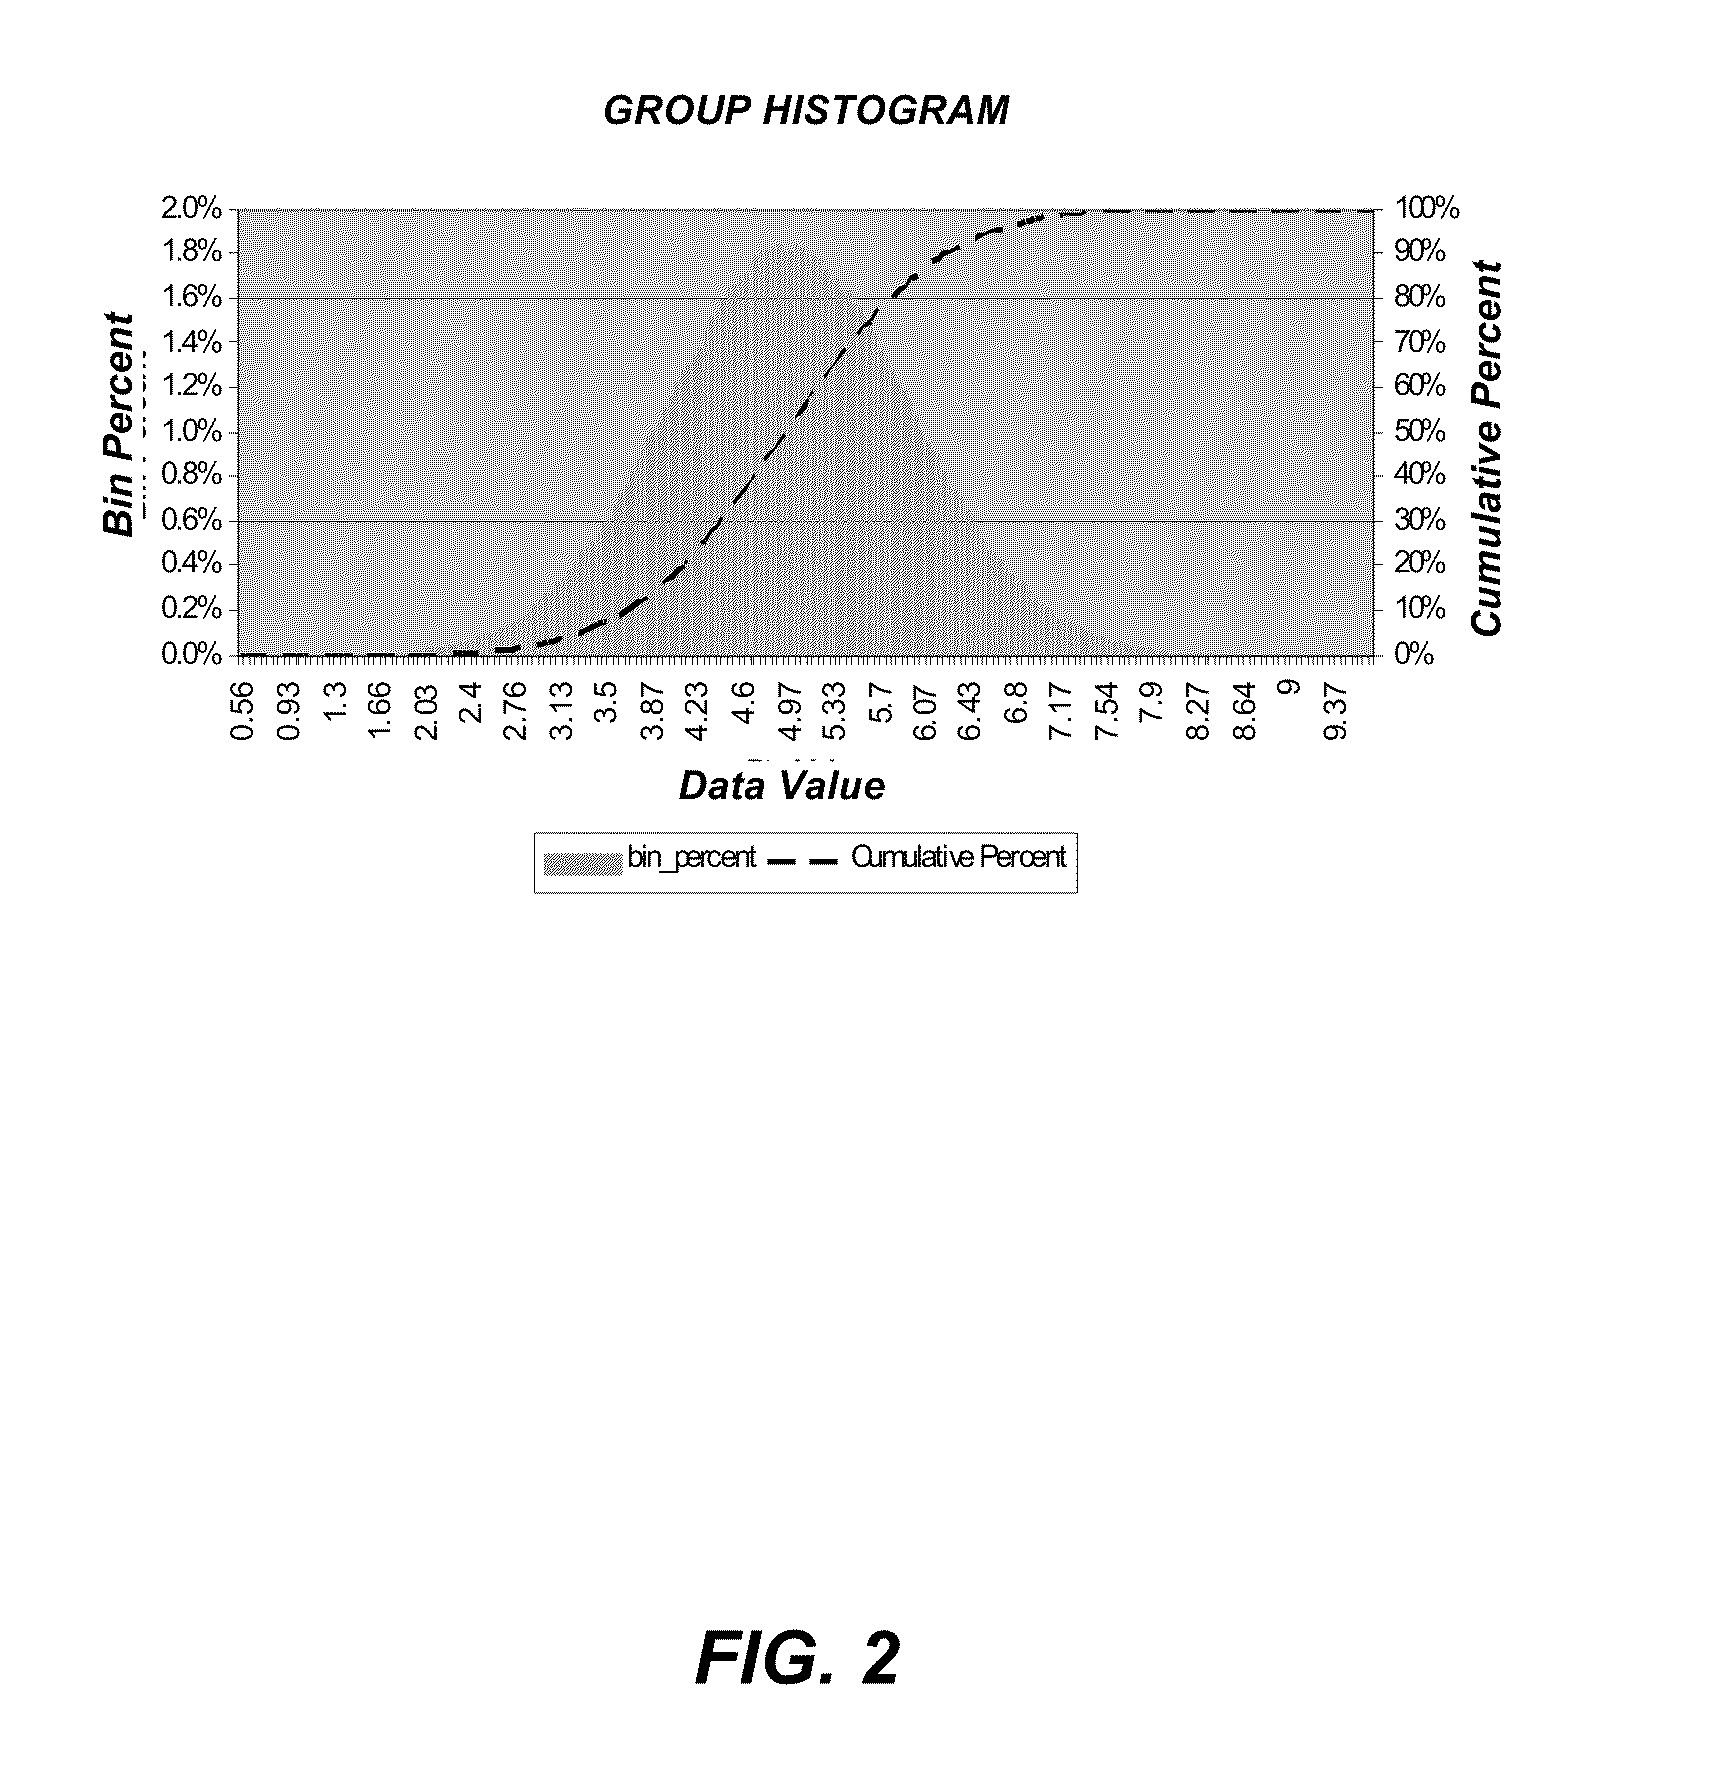
[0050]A data set of 1,000,000 values were generated in three groups as follows:[0051]Group 1: 500,000 rows random normal distribution with mean 5 and standard deviation (stdev) 1.[0052]Group 2: 300,000 rows random normal distribution with mean 7 and stdev 0.8.[0053]Group 3: 200,000 rows random normal distribution with mean 9 and stdev 1.5.

[0054]Assume that all three groups of data belong to the same data set (i.e., have the same key fields), but are acquired at different times in the order given above (group 1, then combine group 2 data to group 1, and finally, combine group 3 data to the combined group 1 and 2). Further, assume that it is desired to analyze all available data as soon as it is acquired. In other words, the analysis consists of order based statistics on 500,000 rows, followed by analysis of 800,000 rows, followed by analysis of 1,000,000 ...


PUM


Abstract

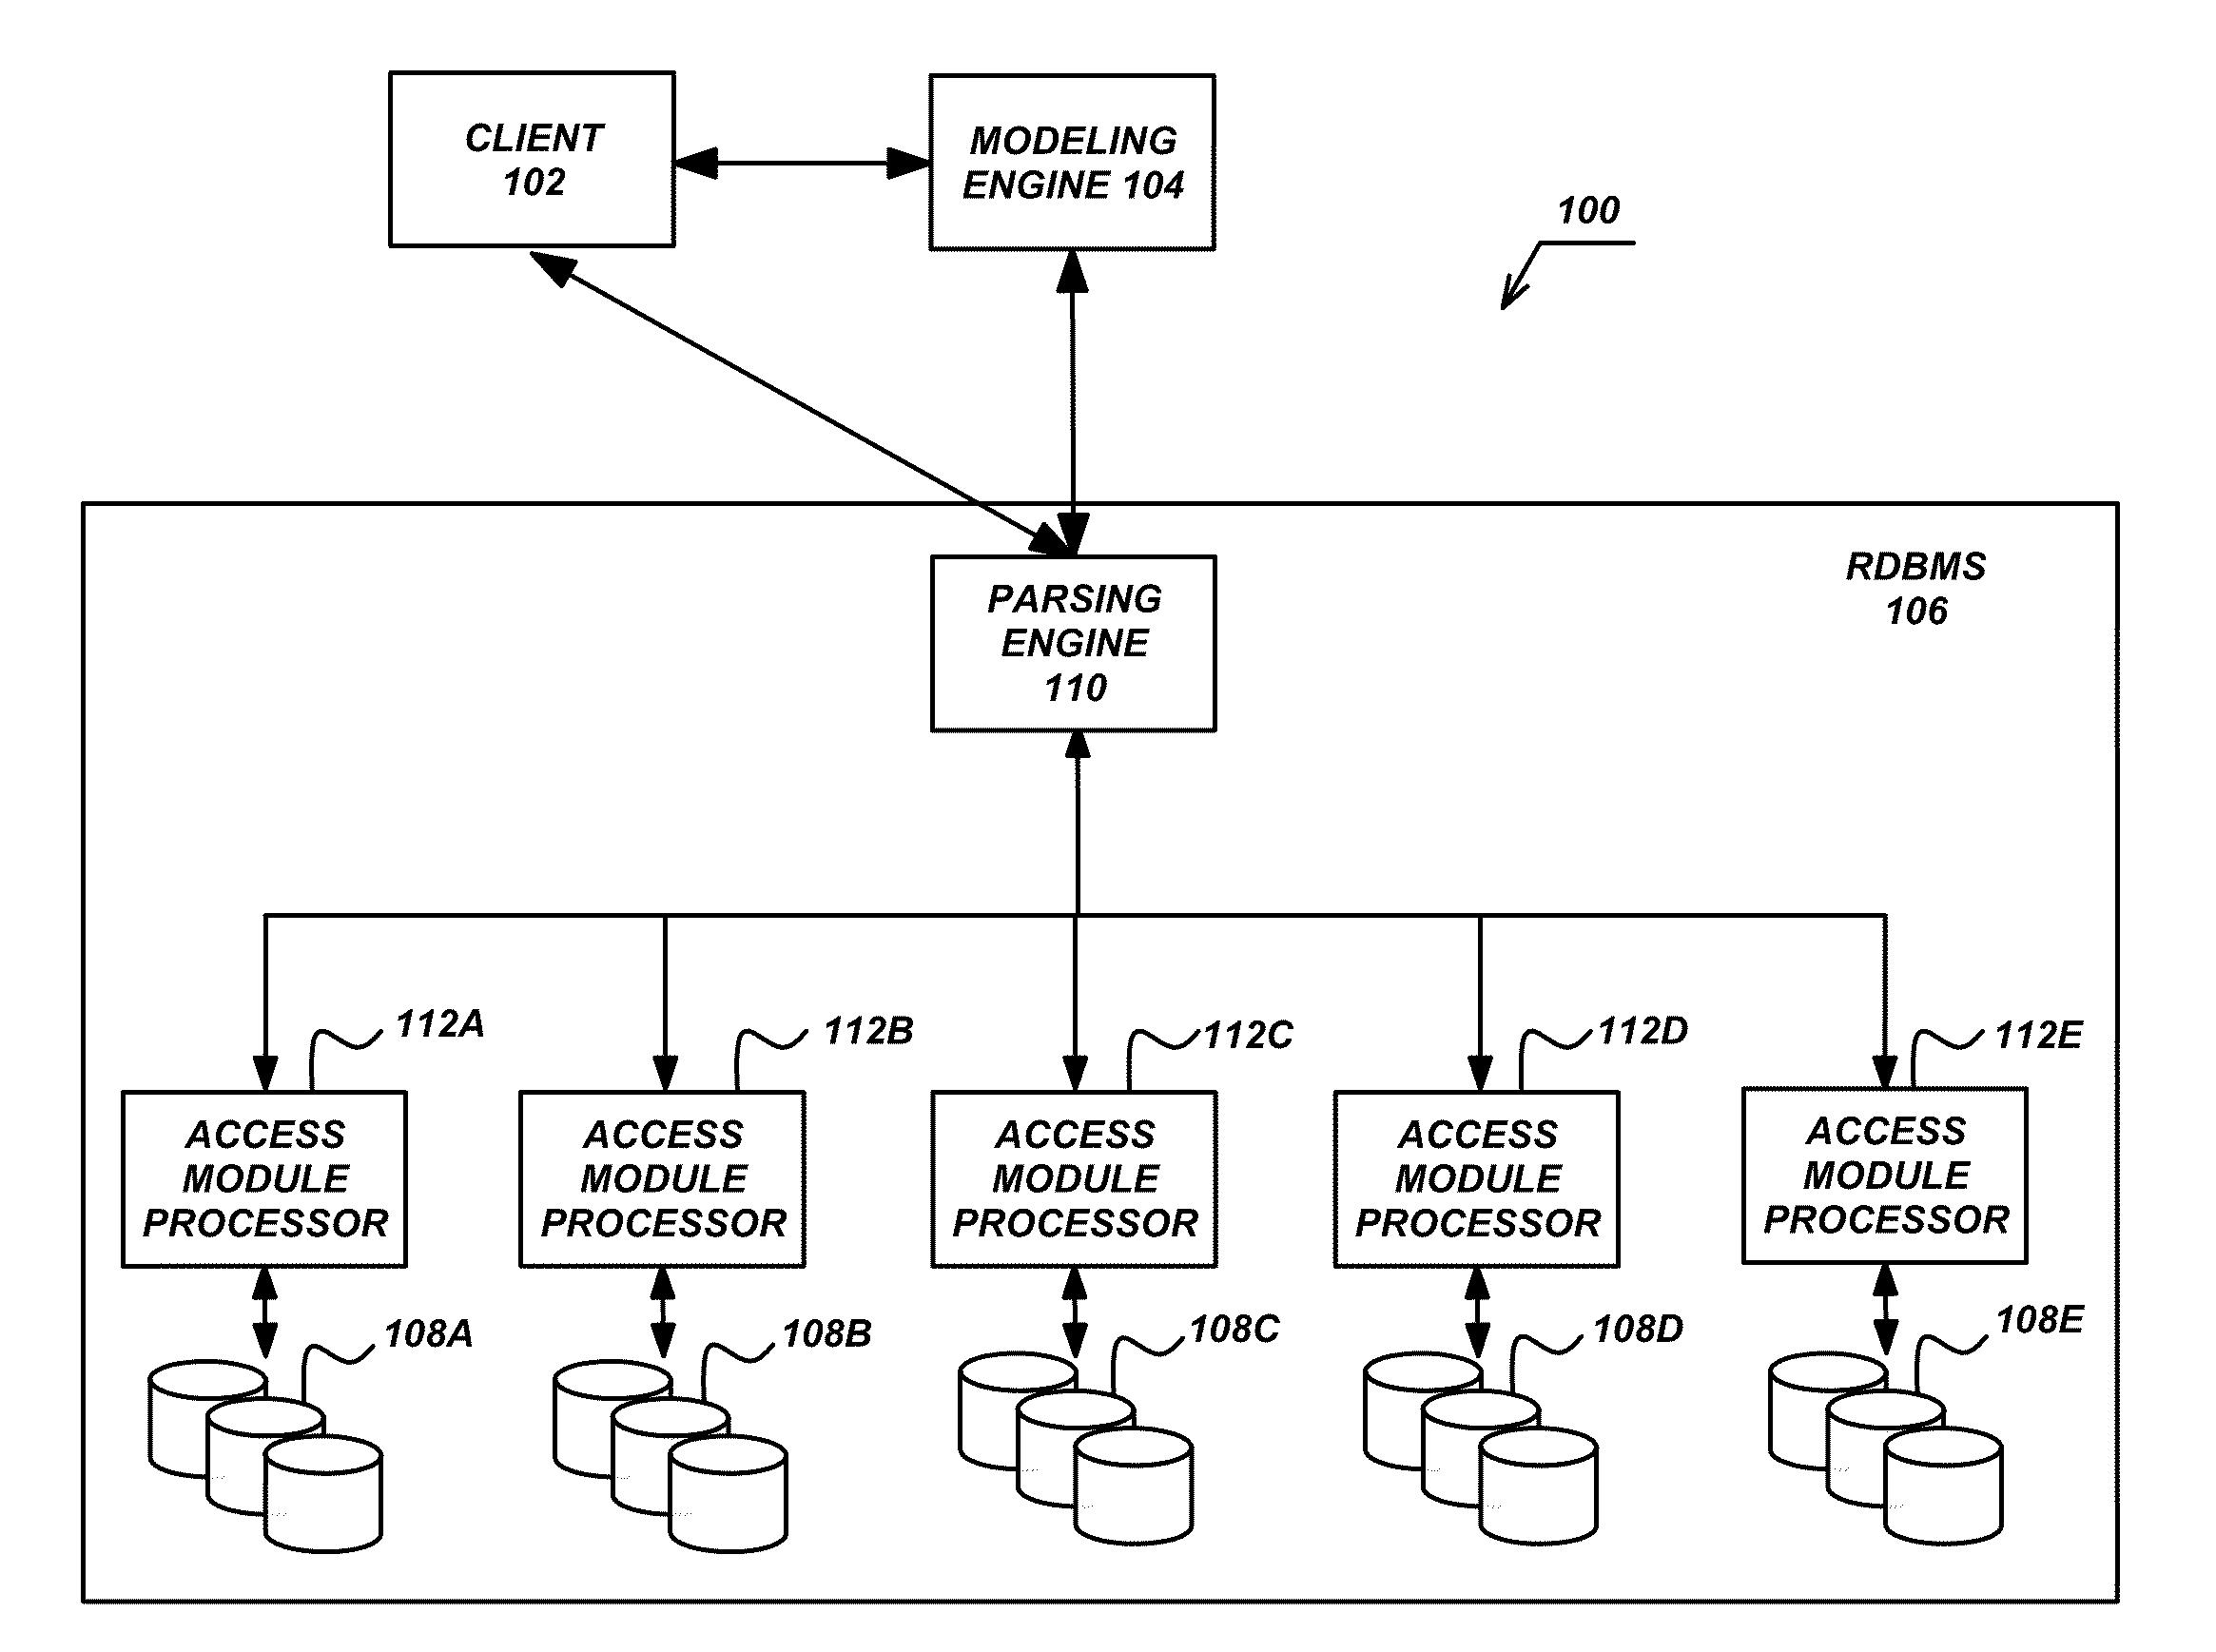
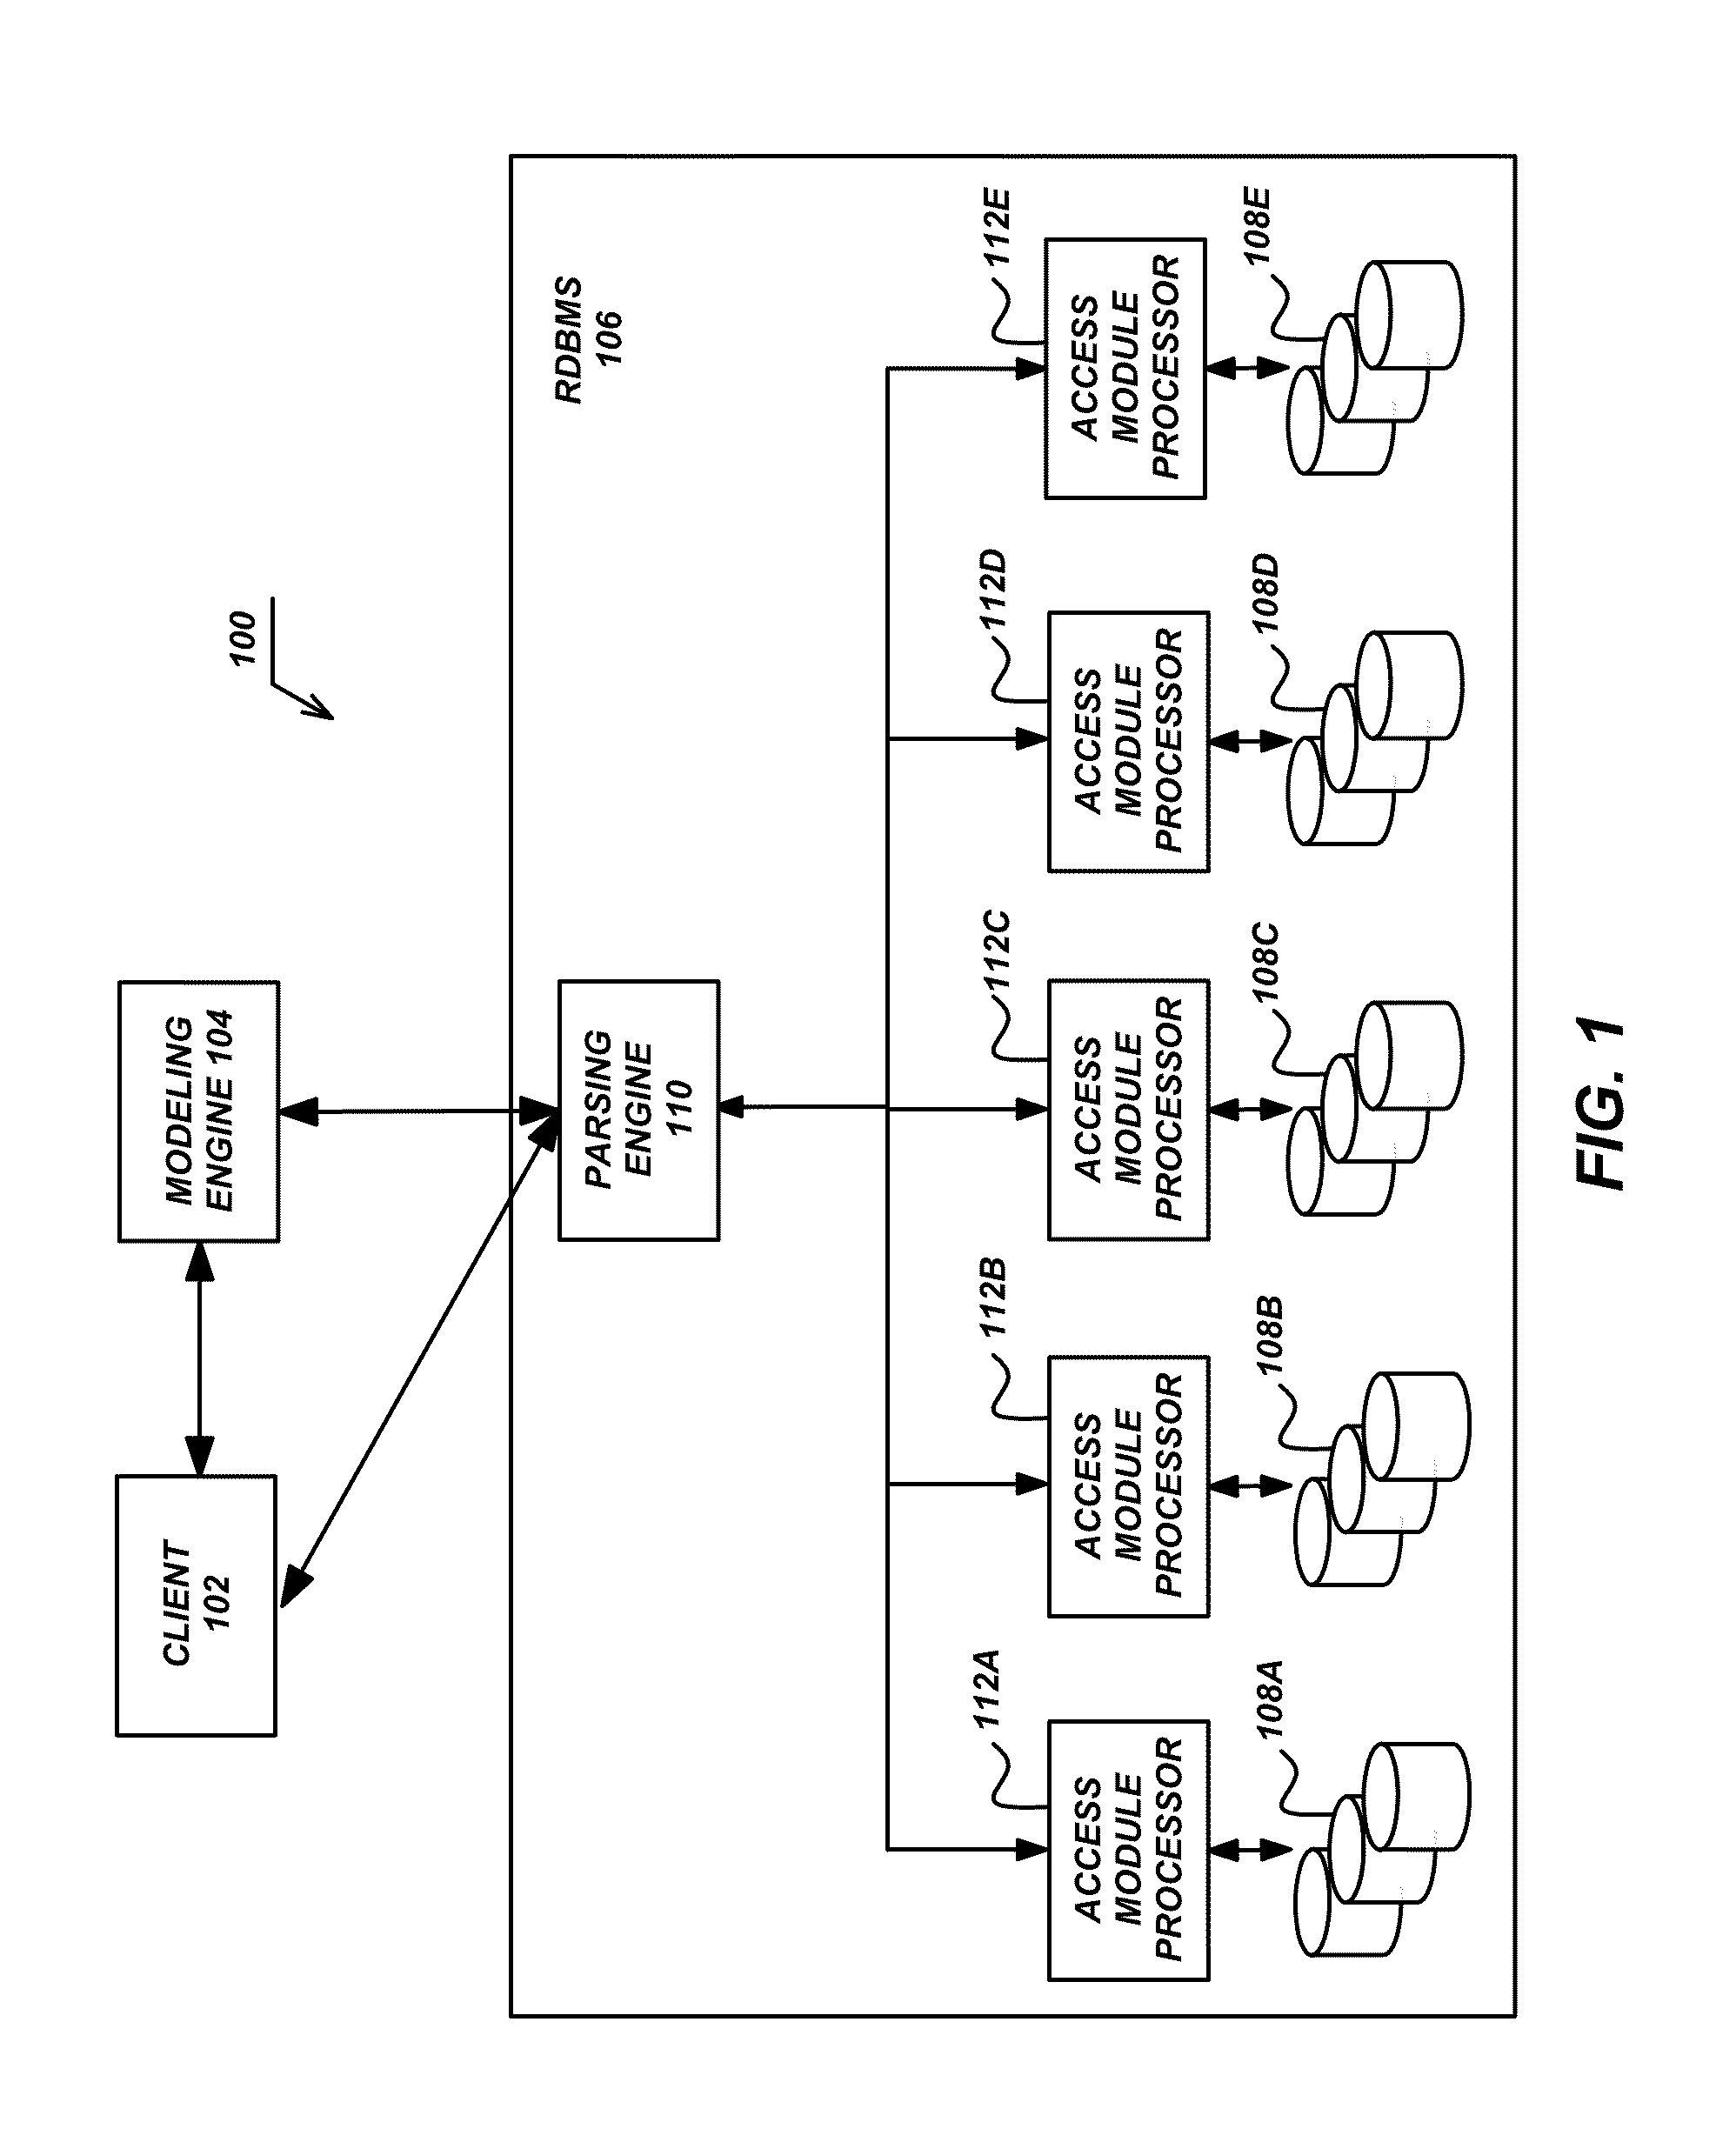
A computer-implemented method for estimation of order-based statistics on slowly changing distributions of data stored on a computer. An initial set of data is converted to an initial histogram based representation of the data set's distribution. New or removed data is converted into a new histogram separate from the initial histogram. The new histogram is combined with the initial histogram to build a combined histogram. Percentiles and order-based statistics are estimated from the combined histogram to provide analysis of a combination of the initial set of data combined with the new or removed data.

Description

CROSS REFERENCE TO RELATED APPLICATIONS[0001]This application claims the benefit under 35 U.S.C. Section 119(e) of co-pending and commonly-assigned U.S. Provisional Patent Application Ser. No. 61 / 253,391, filed on Oct. 20, 2009, by Bruce E. Aldridge, entitled “Method for Estimation of Order-Based Statistics on Slowly Changing Distributions,” attorneys' docket number 20153 (30145.470-US-P1), which application is incorporated by reference herein.[0002]This application is related to the following co-pending and commonly assigned patent applications:[0003]U.S. Utility patent application Ser. No. 10 / 742,966, filed on Aug. 9, 2004, by Bruce E. Aldridge and Rangarajan S. Thirumpoondi, entitled “System and Method for Tuning a Segmented Model Representing Product Flow Through a Supply Chain or Manufacturing Process,” attorneys' docket number 11408;[0004]U.S. Utility patent application Ser. No. 10 / 254,234, filed on Sep. 25, 2002, by Bruce E. Aldridge and Rangarajan S. Thirumpoondi; entitled “...

Claims


Application Information

Patent Timeline
IPC IPC(8): G06F17/30G06F7/22
CPCG06F17/18
Inventor ALDRIDGE, BRUCE E.
Owner TERADATA US
Learn More