Generating dependency maps from dependency data

a dependency map and dependency data technology, applied in the field of monitoring software, can solve the problems of difficult for users to determine exactly where the problem is, information might not provide for quick visualization of the problem, etc., and achieve the effect of reducing the complexity of the directed graph

Active Publication Date: 2012-03-22
CA TECH INC
View PDF5 Cites 44 Cited by
  • Summary
  • Abstract
  • Description
  • Claims
  • Application Information

AI Technical Summary

Benefits of technology

[0043]In step 606, a dependency map 200 is displayed based on the directed graph. Several examples are shown in FIGS. 2-4. Note that the dependency map 200 may reduce some of the complexity of the directed graph. For example, not all of the vertices in the directed graph need to be

Problems solved by technology

If the information is too detailed, it can be difficult for the user to determine exactly where the probl

Method used


Image

  • Generating dependency maps from dependency data
  • Generating dependency maps from dependency data
  • Generating dependency maps from dependency data

Examples


Embodiment Construction

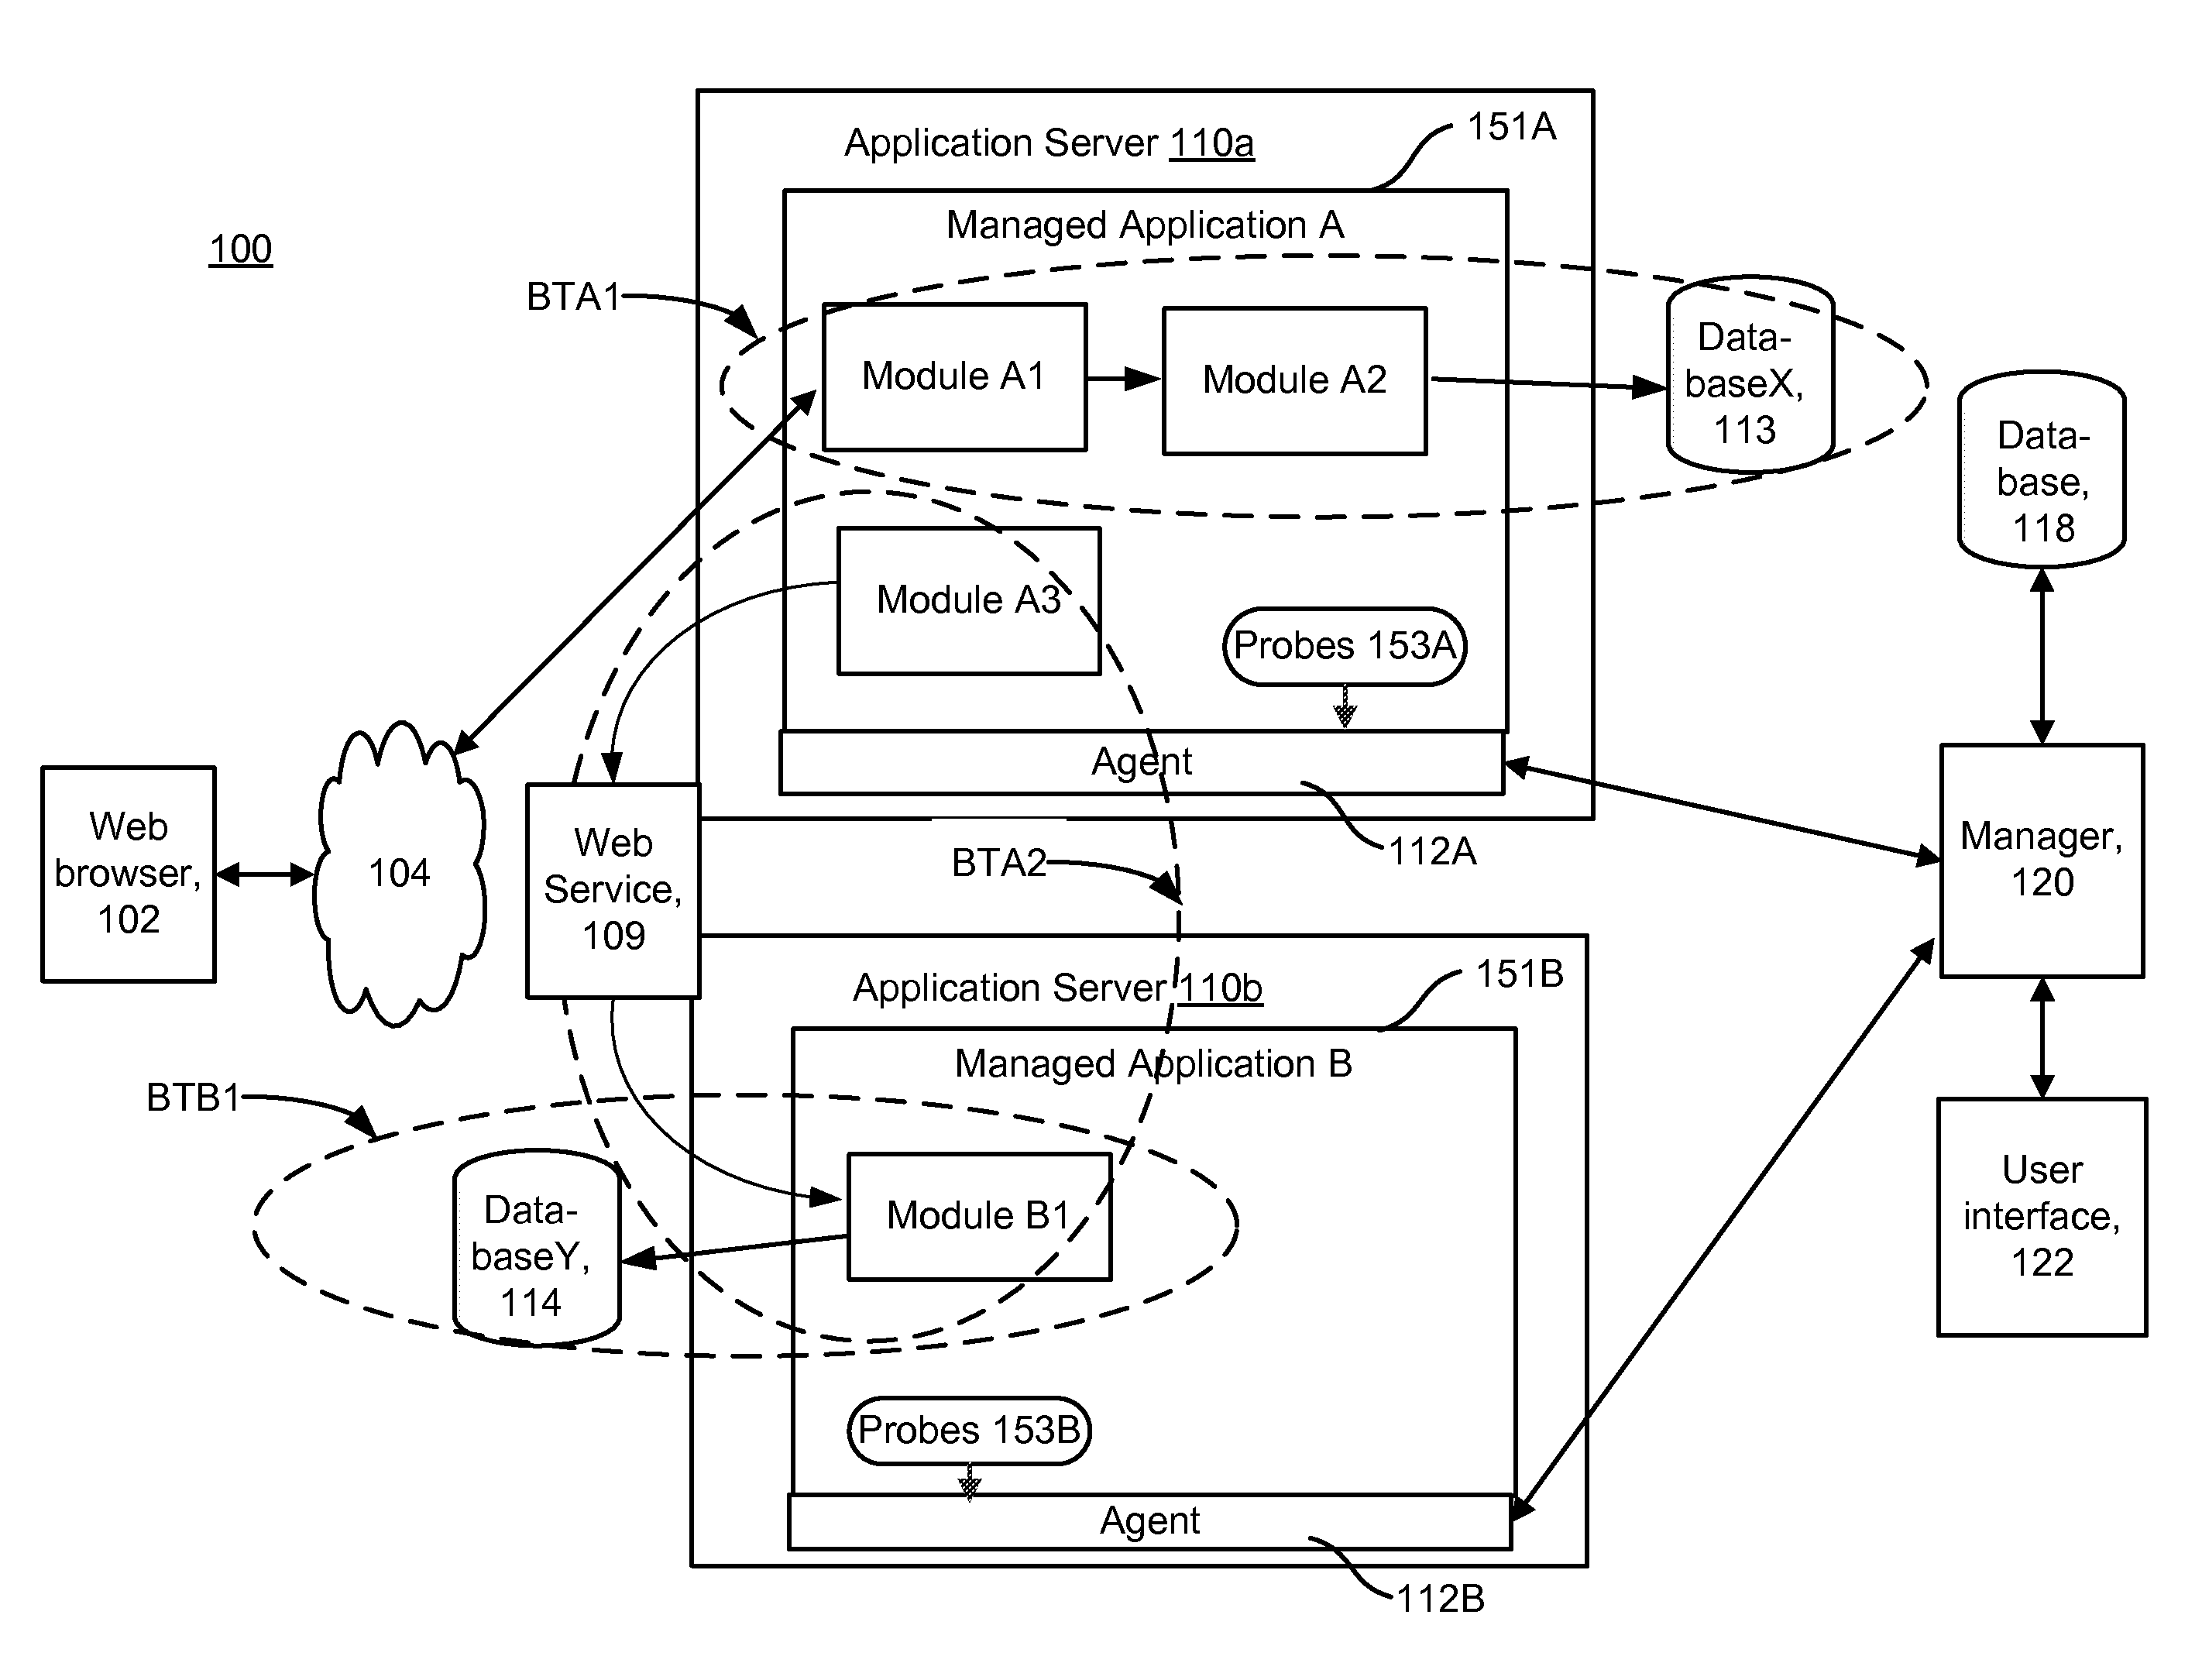
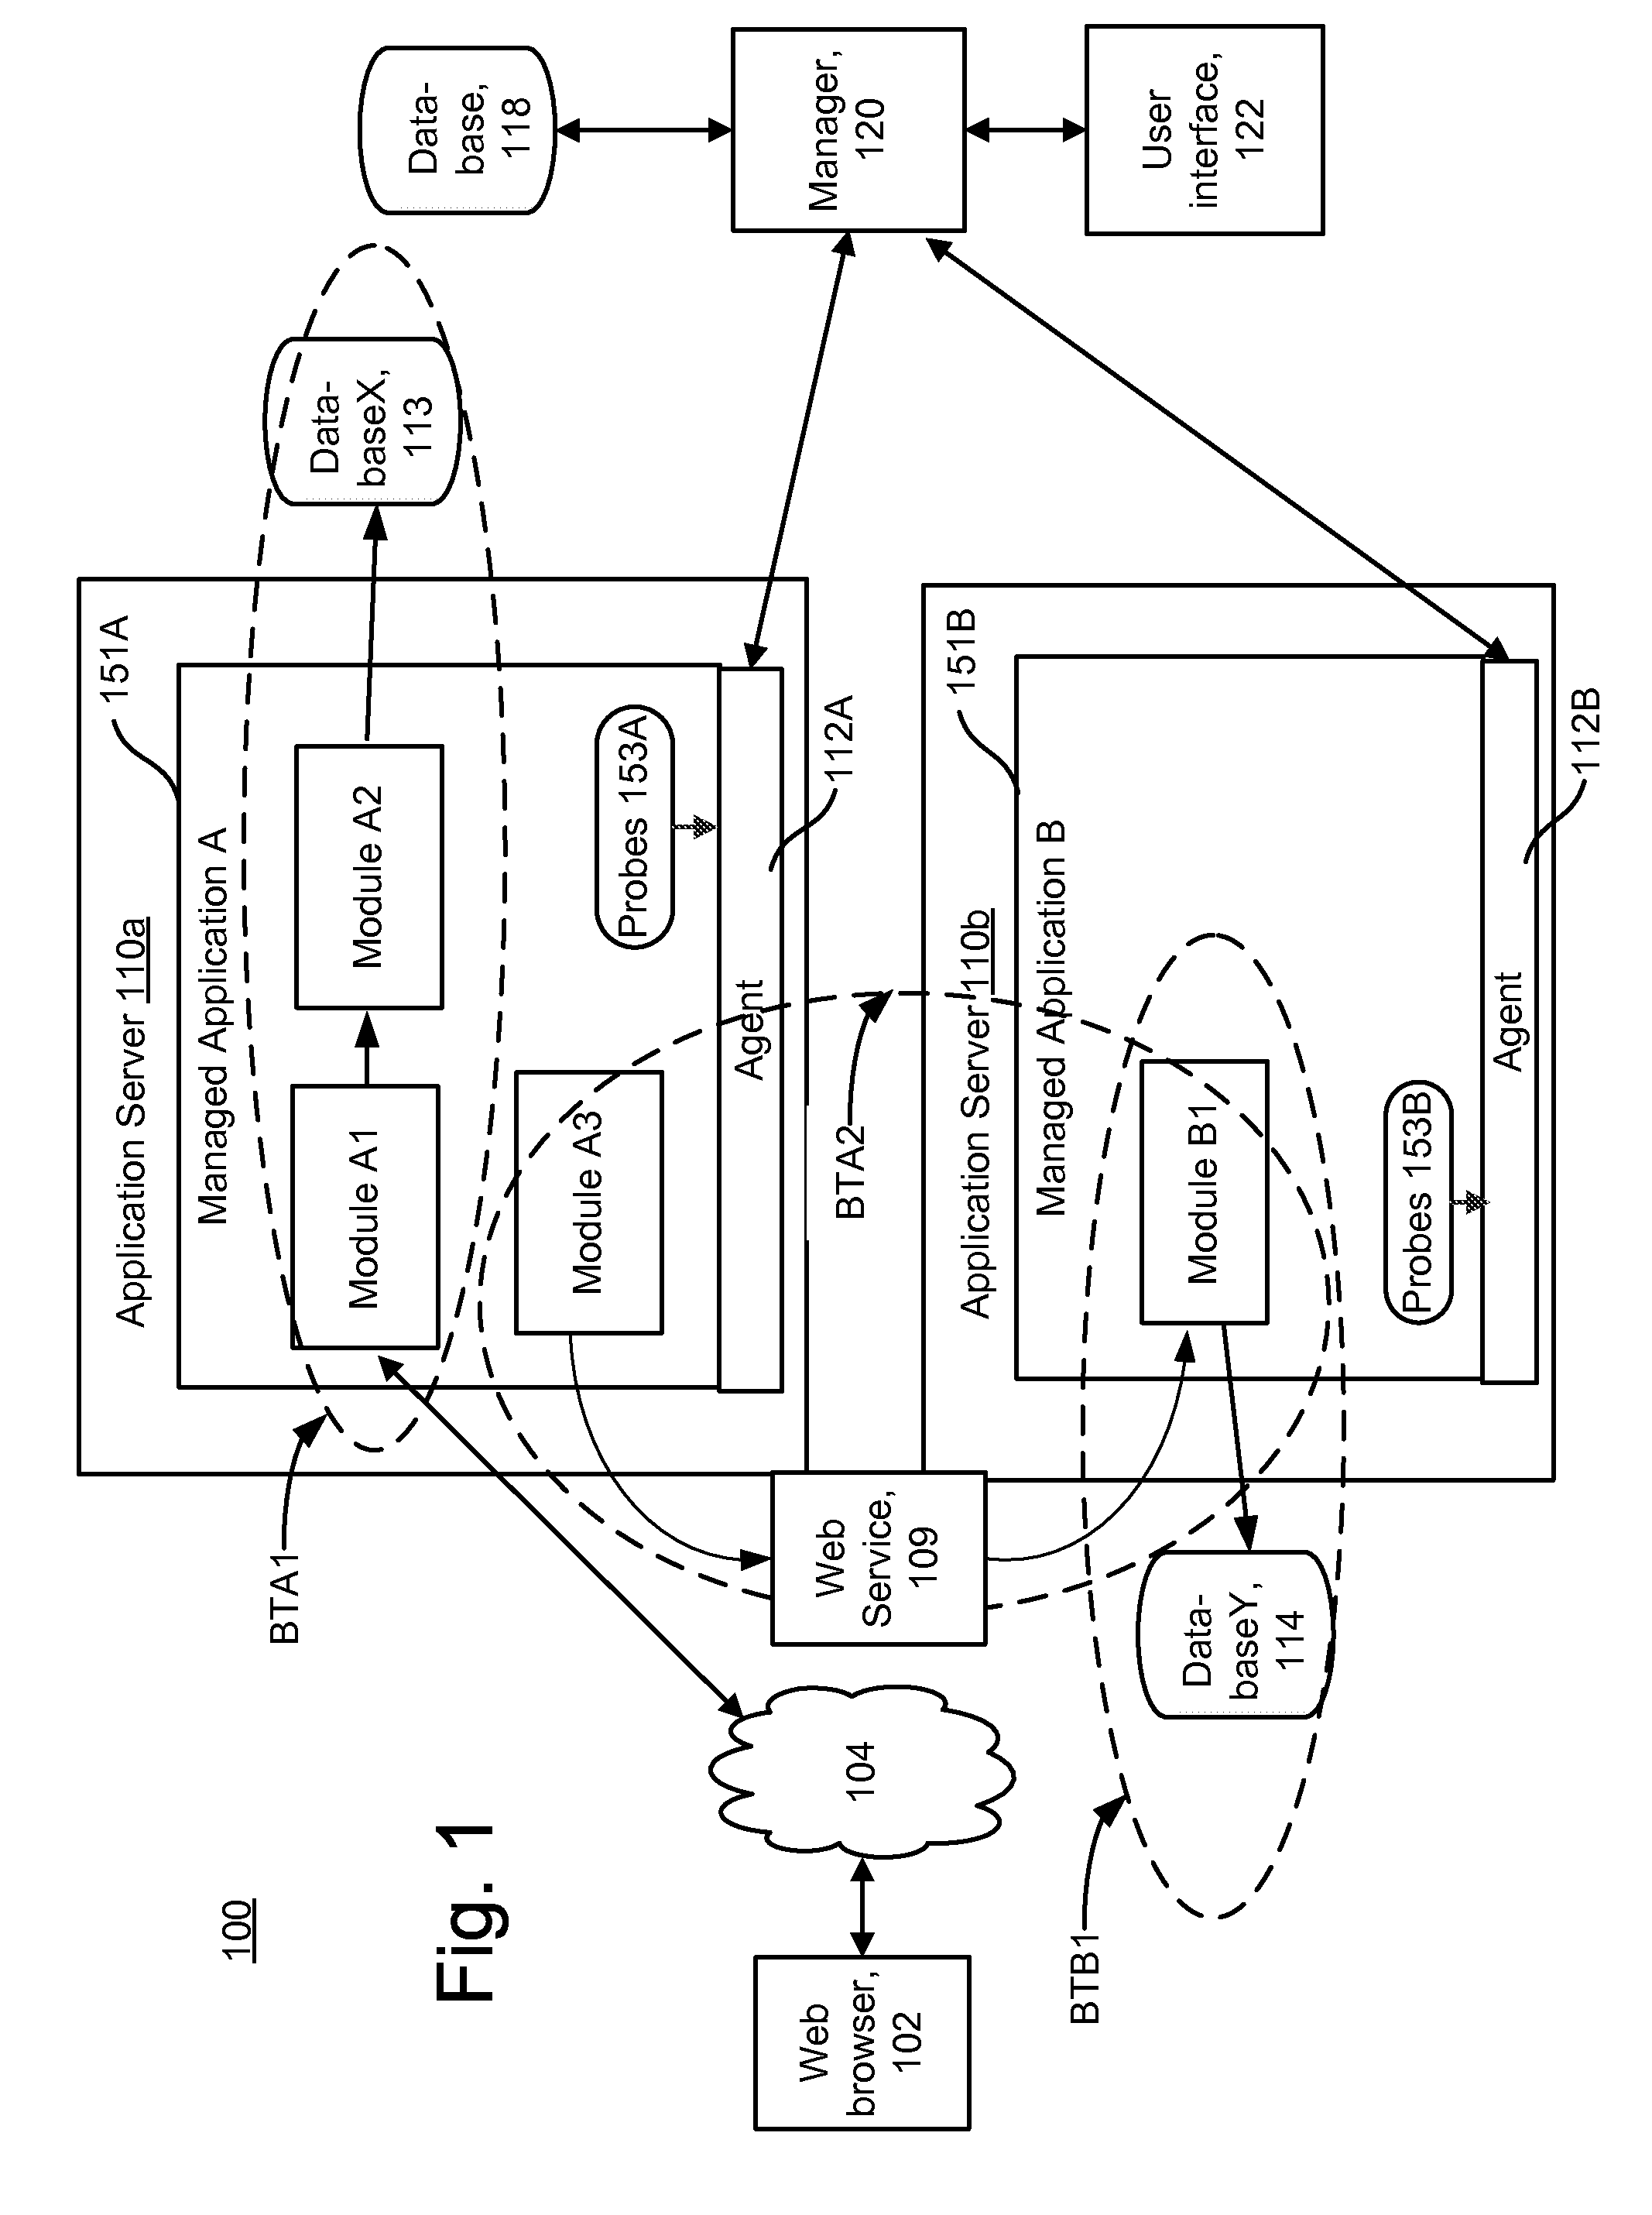
[0017]Disclosed herein are techniques for generating data that describes dependencies between software components as transactions are processed, as well as displaying dependency maps based on the data. The data may be collected by agents that monitor or trace transactions being processed by the software components. The collected data may be aggregated to form a directed graph that describes the dependencies between the software components. A dependency map may be displayed based on the directed graph. The dependency map could show dependencies between software components as the transactions are processed. The dependency map may could also show dependencies between applications that include the software components. The dependency map(s) may allow a user to easily and quickly ascertain where a problem is occurring. For example, the user might be able to quickly determine that a problem is at a backend database, as opposed to an application server at a frontend.

[0018]FIG. 1 depicts a n...


PUM


Abstract

Disclosed herein are techniques for generating data that describes dependencies between software components as transactions are processed, as well as displaying dependency maps based on the data. The data may be collected by agents that monitor or trace transactions being processed by the software components. The collected data may be aggregated to form a directed graph that describes the dependencies between the software components. A dependency map may be displayed based on the directed graph. The dependency map may show dependencies between software components as the transactions are processed. The dependency map may also show dependencies between applications that include the software components. The dependency map(s) may allow a user to easily and quickly ascertain where a problem is occurring. For example, the user might be able to quickly determine that a problem is at a backend database, as opposed to an application server at a frontend.

Description

BACKGROUND OF THE INVENTION[0001]1. Field[0002]The present disclosure is directed to technology for monitoring software in a computing environment.[0003]2. Background[0004]The growing presence of the Internet as well as other computer networks such as intranets and extranets has brought many new applications in e-commerce, education and other areas. Organizations increasingly rely on such applications to carry out their business or other objectives, and devote considerable resources to ensuring that they perform as expected. To this end, various application management techniques have been developed.[0005]One approach involves monitoring the infrastructure of the application by collecting application runtime data regarding the individual software components that are invoked in the application. This approach can use agents that essentially live in the system being monitored. For example, using instrumentation of the software, a thread or process can be traced to identify each componen...

Claims


Application Information

Patent Timeline
IPC IPC(8): G06F9/44
CPCG06F11/323G06F2201/87G06F11/3612G06F11/3476G06F3/14G06F11/30G06F11/34G06F17/40
Inventor BASAK, INDRANIL
Owner CA TECH INC
Why Eureka
Try Eureka