System and method for forecasting realized volatility via wavelets and non-linear dynamics

a wavelet and wavelet technology, applied in the field of system and method for forecasting realized volatility via wavelet and nonlinear dynamics, can solve the problems of volatility, while capturing many important stylized facts, prevailing volatility models, and unable to provide the requisite predictability and stability, and the relationship between vix and individual equity options tends to be overstated, so as to achieve the effect of improving the maximum absolute error

Active Publication Date: 2012-03-29
THOMSON REUTERS GLOBAL RESOURCES UNLIMITED CO
View PDF9 Cites 15 Cited by
  • Summary
  • Abstract
  • Description
  • Claims
  • Application Information

AI Technical Summary

Benefits of technology

[0008]According to one aspect of the invention, the system and method described herein may be used to forecast realized volatility via wavelets and non-linear dynamics. In particular, a volatility time series may be decomposed into individual wavelets via multi-resolution analysis and dynamical properties associated with the individual wavelets may then be examined to determine which wavelets are deterministic, wherein a fit may be computed on various data points associated with the deterministic wavelets. The resulting dynamics (on a per-wavelet basis) may then be used to forecast the remaining data points associated with each wavelet and summed to forecast volatility. Empirical results comparing this approach to volatility forecasting with variance swaps and other volatility forecasting techniques has shown a substantial improvement in the maximum absolute error associated with the system and method described herein versus variance swaps and other volatility forecasting techniques.

Problems solved by technology

However, these claims rest on misleading assumptions common to the multi-fractal interpretation and many standard economic and finance models.
Accordingly, the prevailing volatility models, while capturing many important stylized facts associated with volatility, tend to fall short in providing the requisite predictability and stability because certain factors may be marginalized or unconsidered.
However, the relationship between the VIX and individual equity options tends to be overstated, in that the dynamics that drive the volatility associated with index options are different from the dynamics that drive the volatility associated with equity options, and the volatility associated with the two may not correlate in many cases.
Consequently, the VIX does not necessarily provide a suitable measure relating to the market sentiment associated with individual equity options because the VIX measures volatility over a thirty-day period, while the most liquidity associated with non-index equity options tends to be found in the two to six-month maturities.
Accordingly, using one number (e.g., the VIX) to represent the volatility associated with all equity options tends to be overly simplistic, and moreover, carries uncertainty and unpredictability because the VIX and other variance swaps are coincident volatility indicators rather than forward volatility indicators.

Method used


Image

  • System and method for forecasting realized volatility via wavelets and non-linear dynamics
  • System and method for forecasting realized volatility via wavelets and non-linear dynamics
  • System and method for forecasting realized volatility via wavelets and non-linear dynamics

Examples


Embodiment Construction

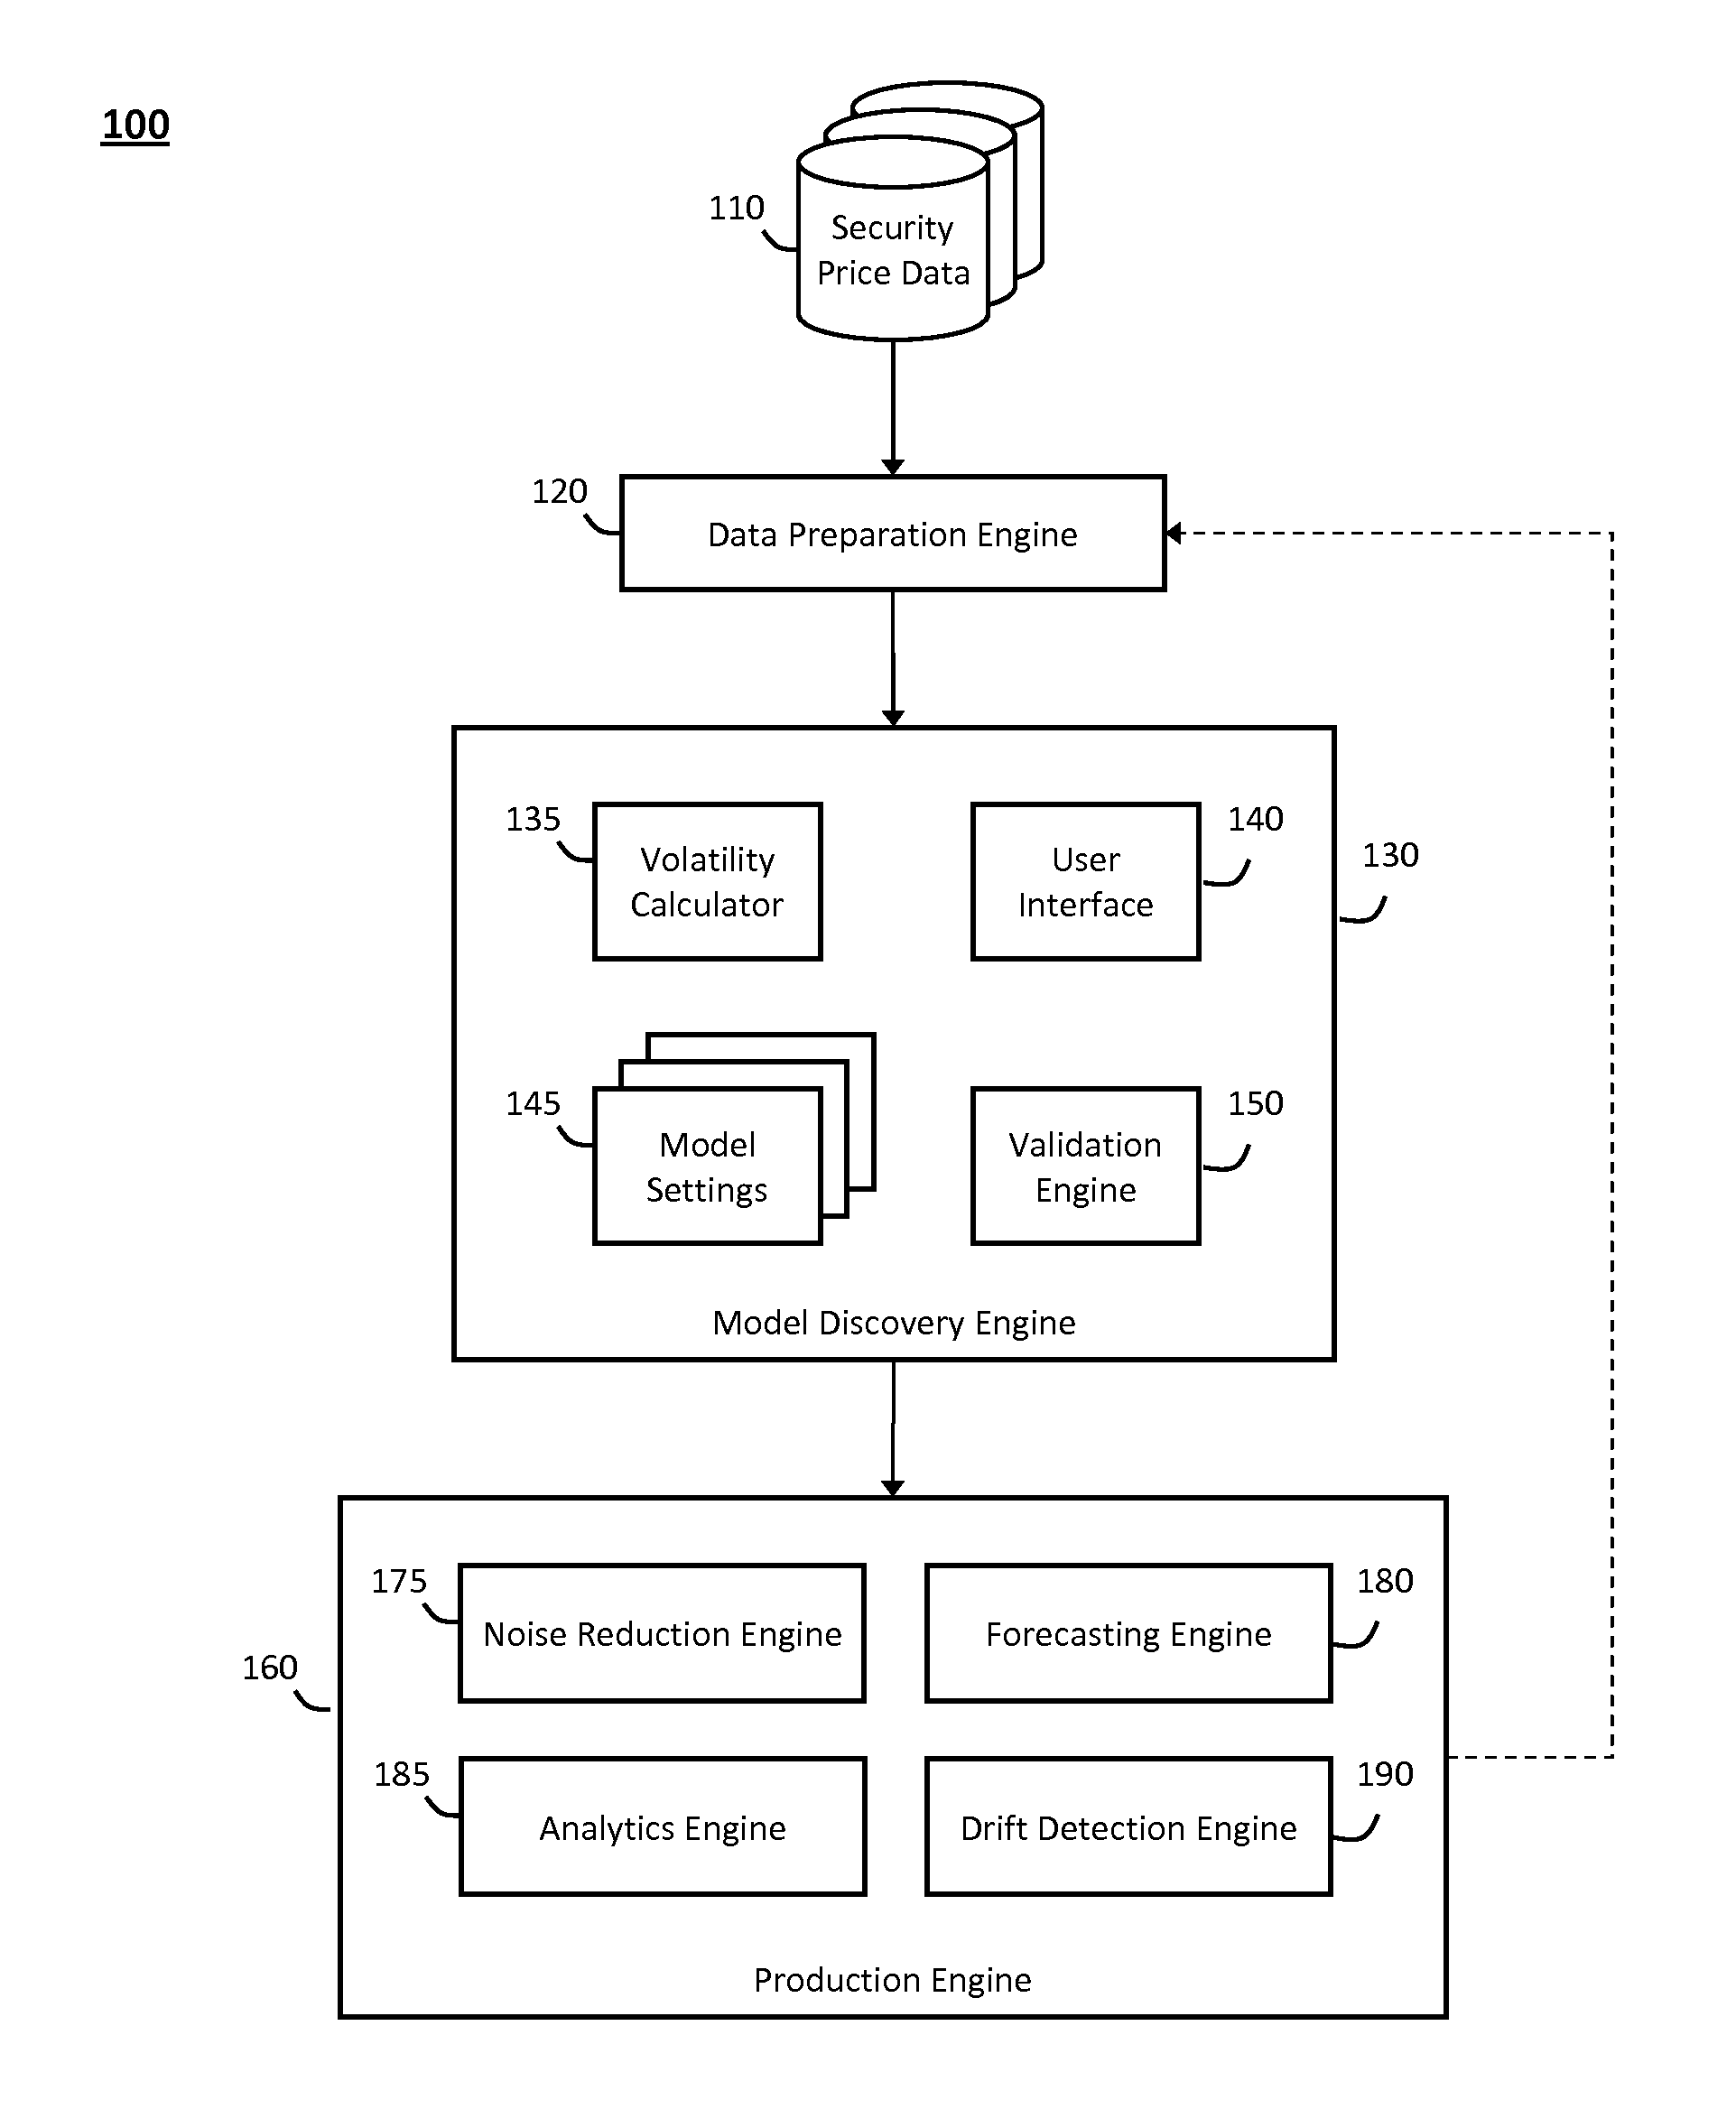
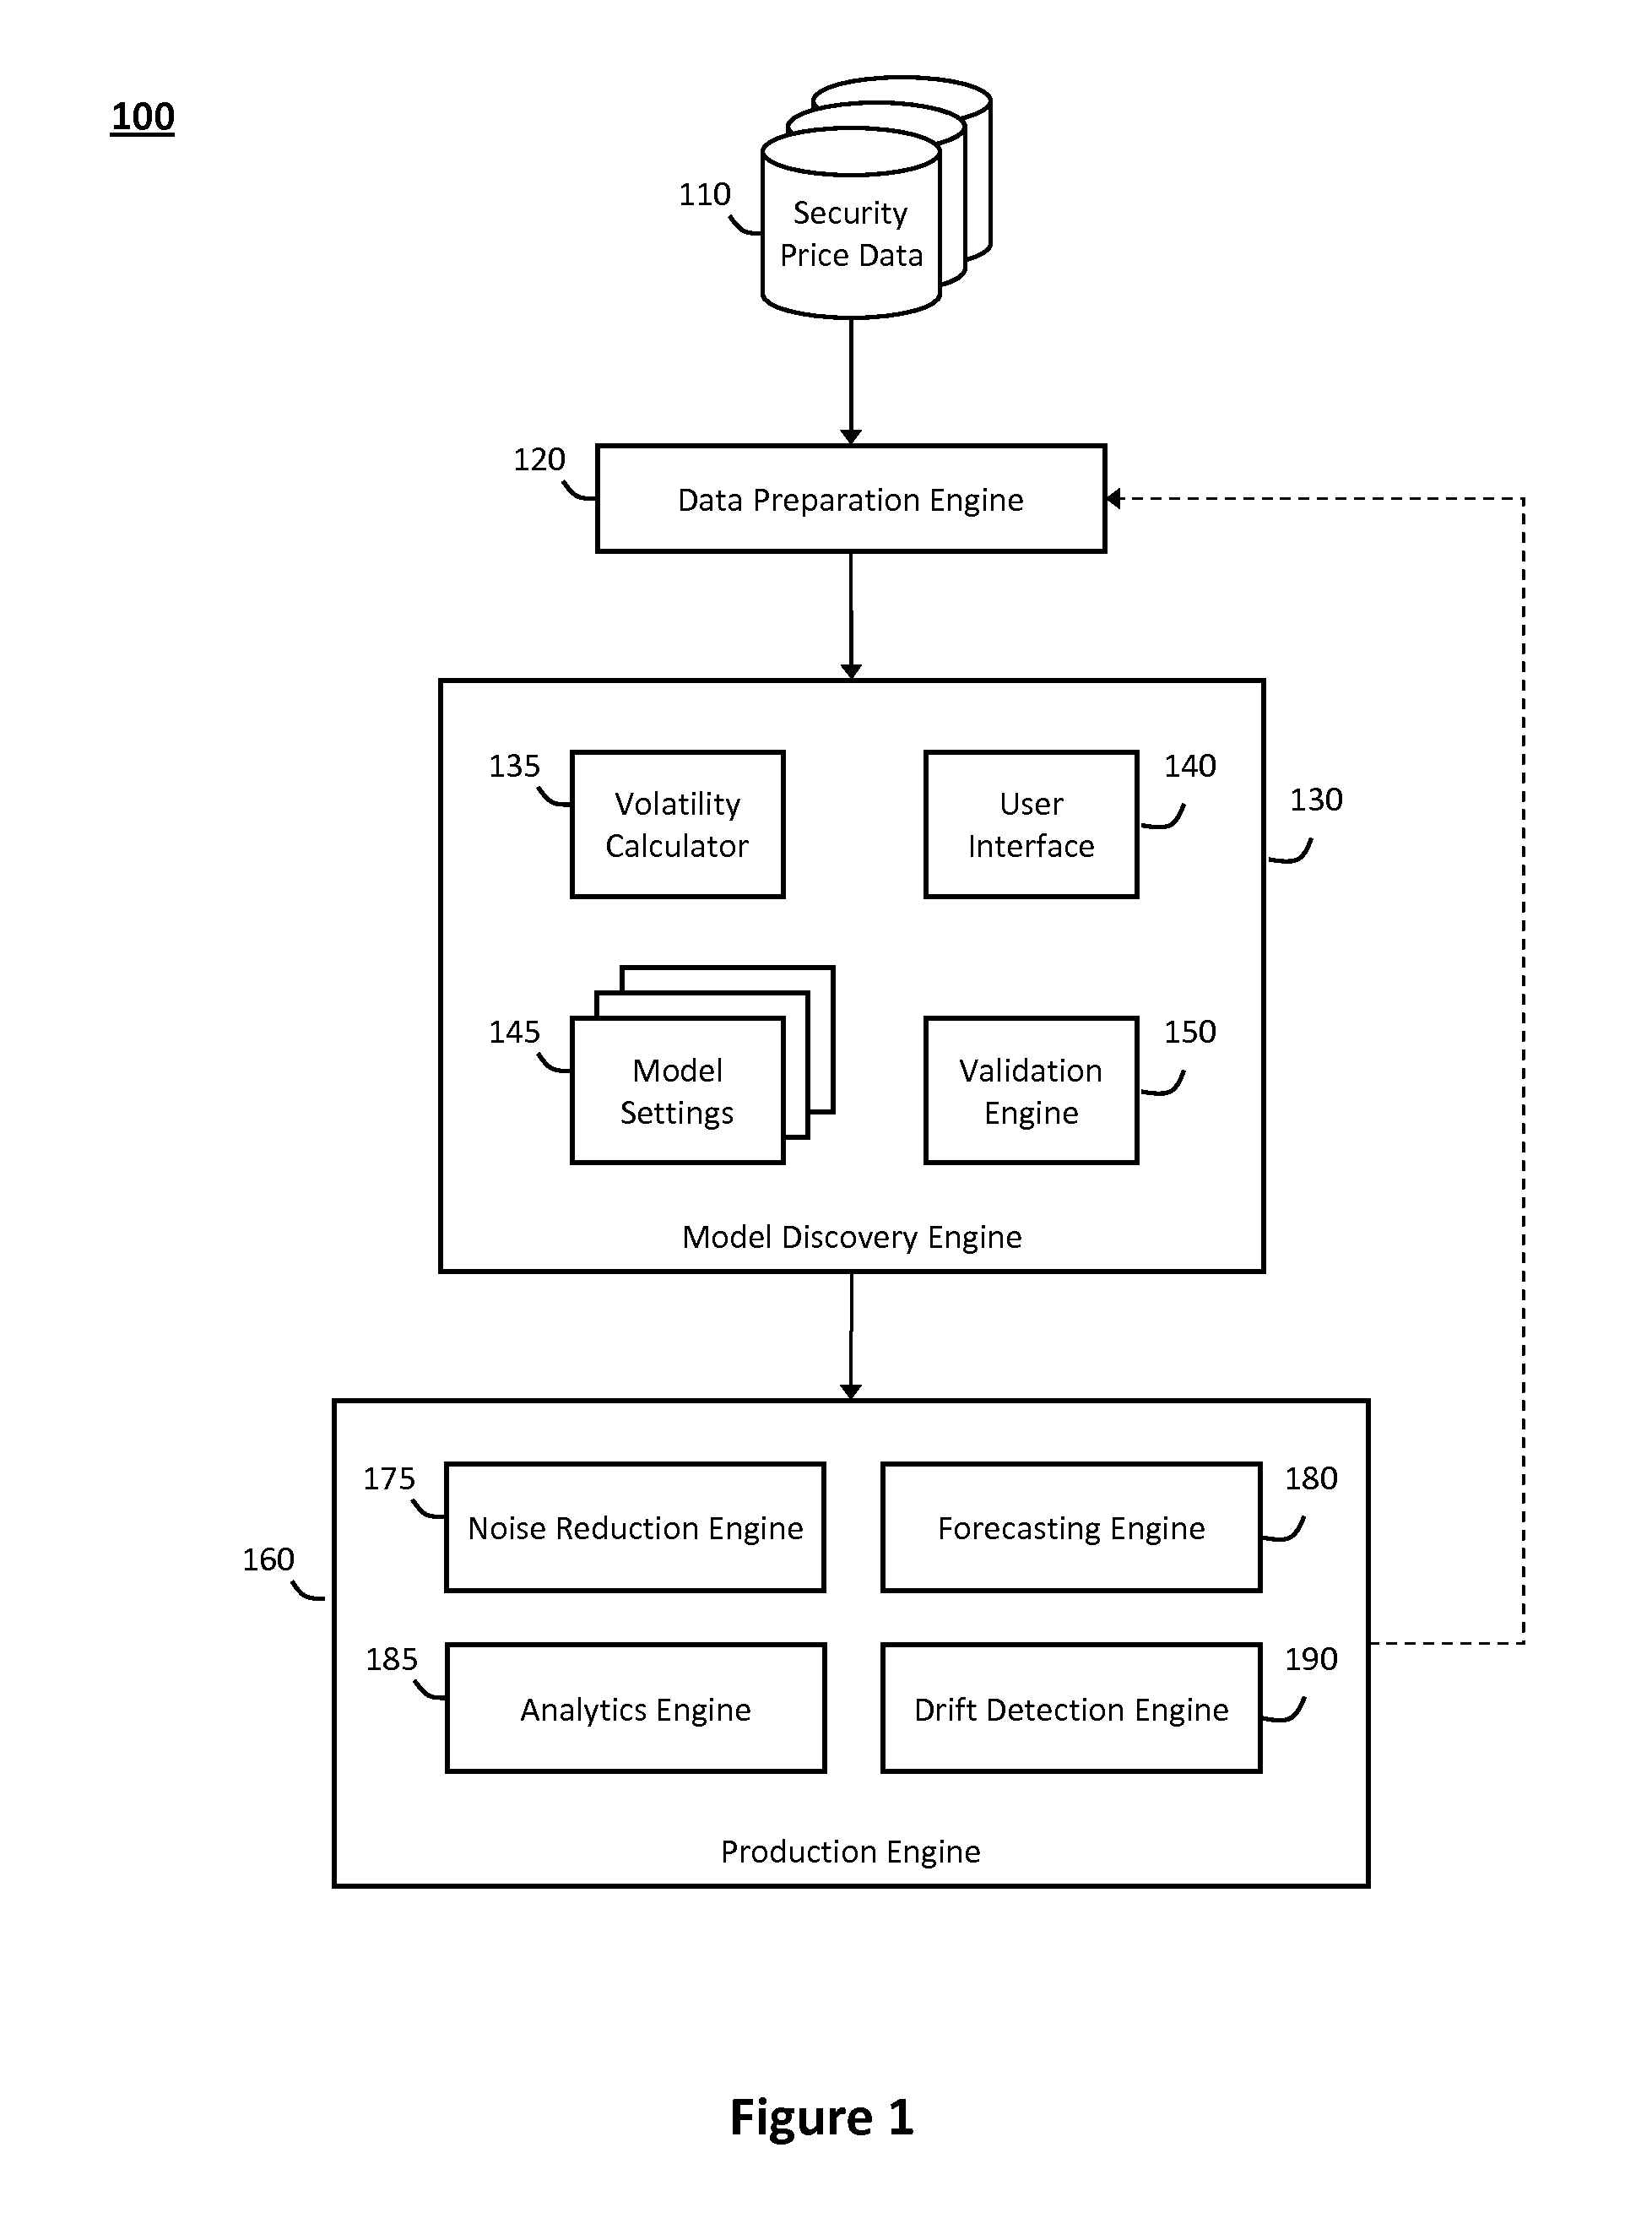
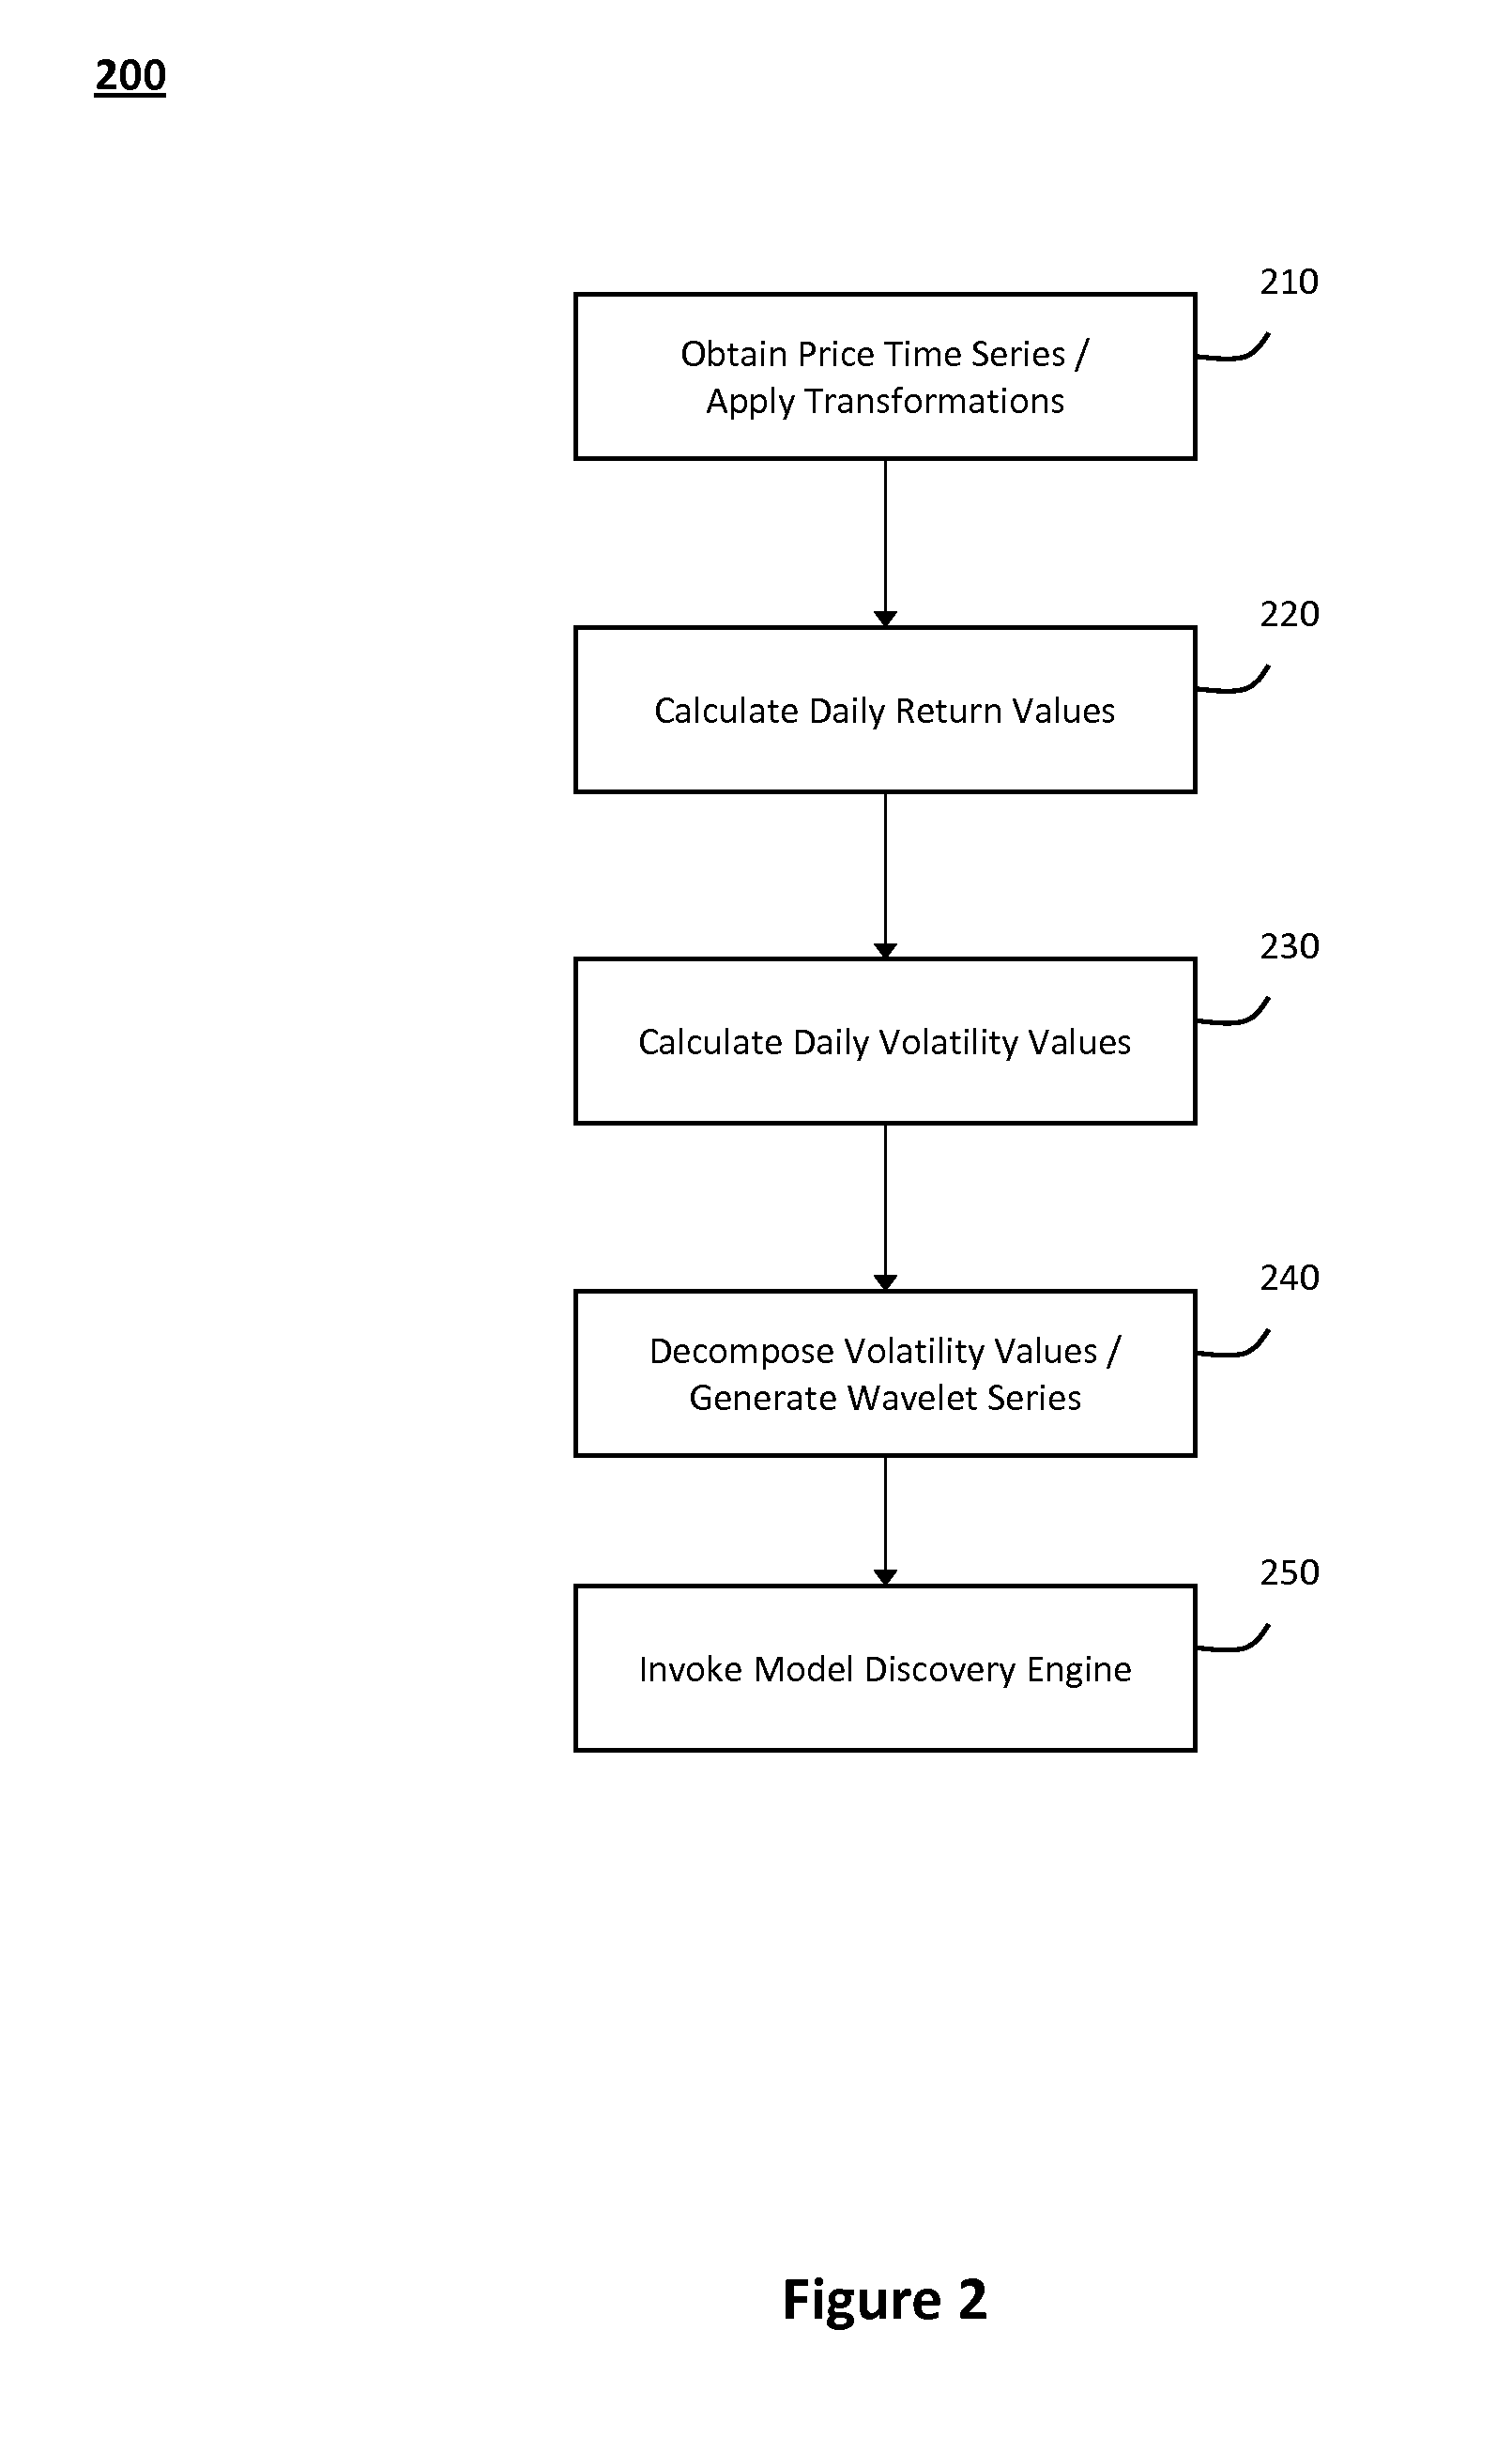
[0022]According to one aspect of the invention, the system and method described herein may be used to forecast realized volatility via wavelets and non-linear dynamics. In particular, to forecast realized volatility, the system and method described herein may decompose a volatility time series may into individual wavelets via multi-resolution analysis and then examine dynamical properties associated with the individual wavelets, which may generally include mutual information, Theiler window, embedding dimension, and Lyapunov and Kolmogorov-Sinai exponents. The dynamical properties associated with the wavelets may then be analyzed to determine which wavelets are deterministic, and a fit may be computed on the first seventy percent of the data points associated with the deterministic wavelets. In one implementation, the resulting dynamics per-wavelet may be used to forecast the remaining thirty percent of the data points associated with each wavelet and summed to forecast volatility. ...


PUM


Abstract

The system and method described herein may be used to forecast realized volatility via wavelets and non-linear dynamics. In particular, a volatility time series that includes daily volatility values associated with a security may be decomposed into wavelets via multi-resolution analysis and dynamical properties associated with the individual wavelets may be analyzed to identify deterministic and non-deterministic wavelets and produce a volatility forecast derived from a fit computed on the deterministic wavelets. For example, the wavelets may be analyzed to discover time delay, Theiler, and embedding dimension values associated therewith, which may be used to project volatility values associated with each wavelet. The projected volatility values associated with each wavelet may then be summed to produce a volatility forecast associated with the security.

Description

CROSS-REFERENCE TO RELATED APPLICATIONS[0001]This application claims the benefit of U.S. Provisional Patent Application Ser. No. 61 / 385,736, entitled “System and Method for Forecasting Realized Volatility via Wavelets and Non-Linear Time Series Analysis,” filed Sep. 23, 2010, the contents of which are hereby incorporated by reference in their entirety.FIELD OF THE INVENTION[0002]The invention generally relates to a system and method for forecasting realized volatility via wavelets and non-linear dynamics, and in particular, to decomposing a volatility time series into wavelets via multi-resolution analysis and analyzing dynamical properties associated with the individual wavelets to identify deterministic and non-deterministic wavelets and produce a volatility forecast from a fit computed on the deterministic wavelets.BACKGROUND OF THE INVENTION[0003]Much time and effort has been expended in recent decades to develop better volatility models that can improve volatility forecasts, wh...

Claims


Application Information

Patent Timeline
Patent Type & Authority Applications(United States)
IPC IPC(8): G06Q40/06
CPCG06Q40/06G06Q40/04
Inventor CLARK, ANDREWKENYON, JEFF
Owner THOMSON REUTERS GLOBAL RESOURCES UNLIMITED CO
Why Eureka
Try Eureka