Visualization of data dependency in graphical models

a technology of data dependency and graphical models, applied in the direction of instrumentation, design optimisation/simulation, requirement analysis, etc., can solve the problems of development and testing of these systems, which have also become more complicated

Active Publication Date: 2013-05-09
THE MATHWORKS INC
View PDF4 Cites 49 Cited by
  • Summary
  • Abstract
  • Description
  • Claims
  • Application Information

AI Technical Summary

Problems solved by technology

As systems have become more complicated, the development and testing of these systems have also become more complicated.

Method used


Image

  • Visualization of data dependency in graphical models
  • Visualization of data dependency in graphical models
  • Visualization of data dependency in graphical models

Examples


example processing

Technique for Visualizing Data Dependencies

[0113]Determined data dependencies may be indicated to users in a number of ways.

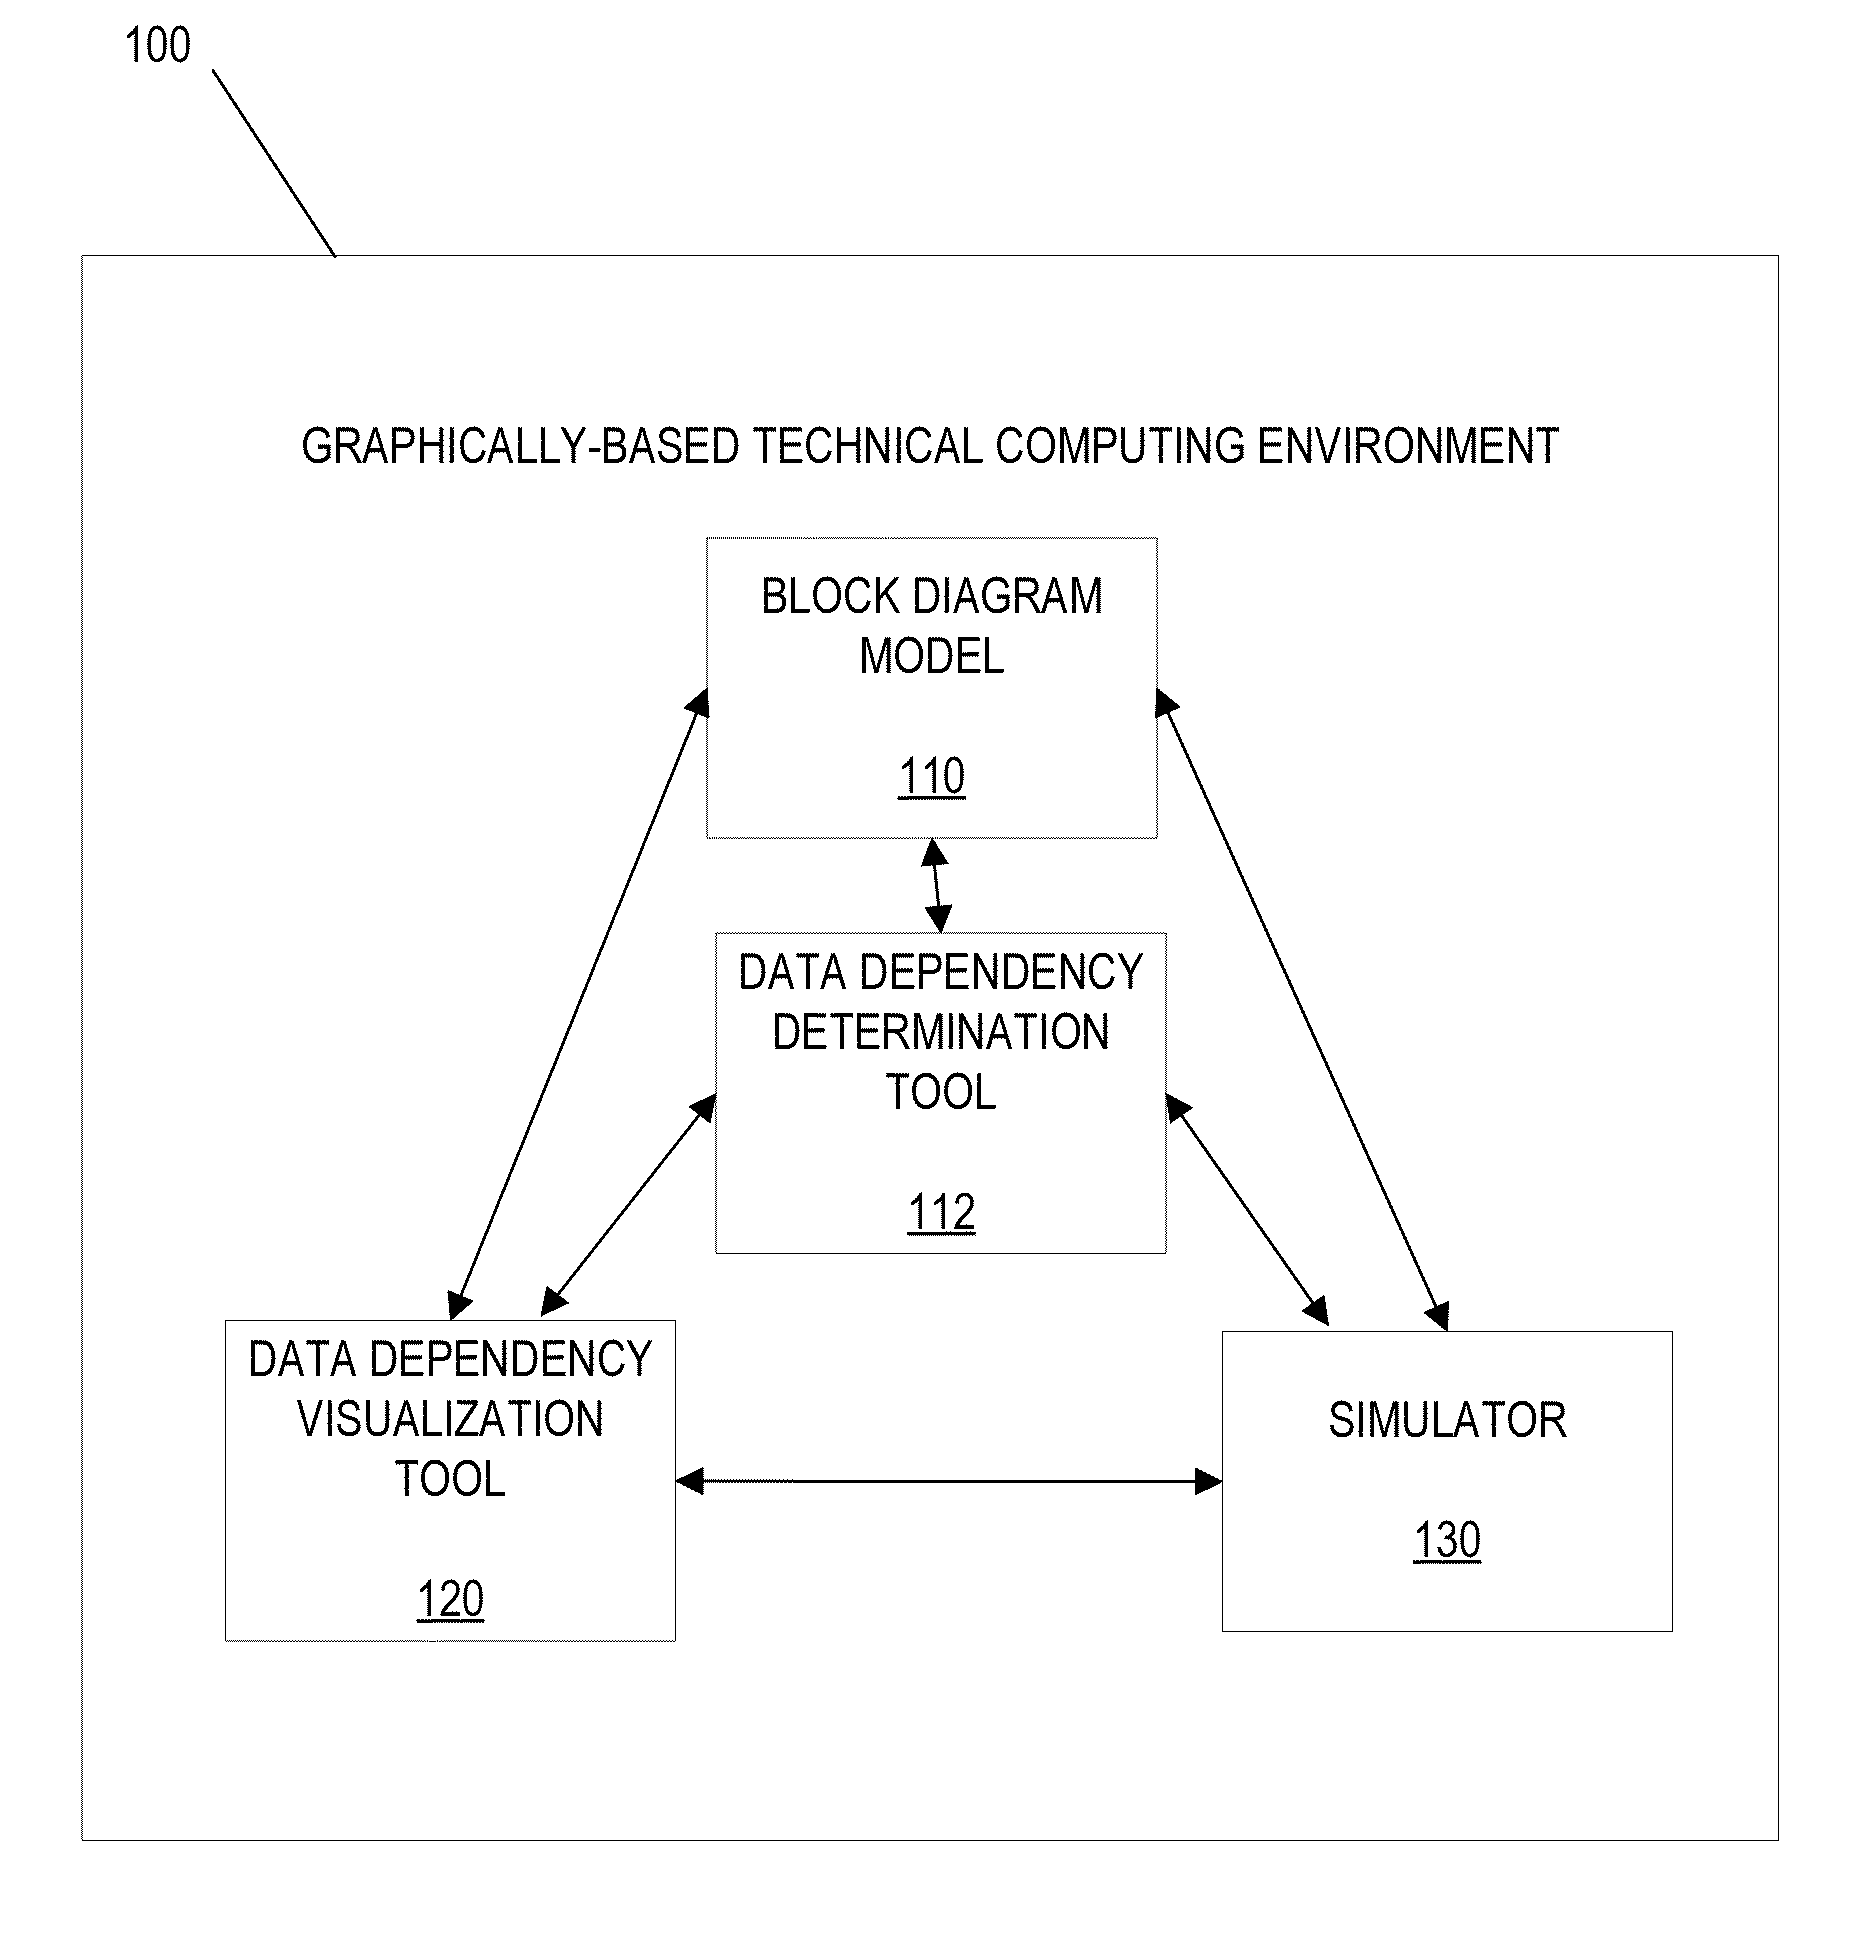
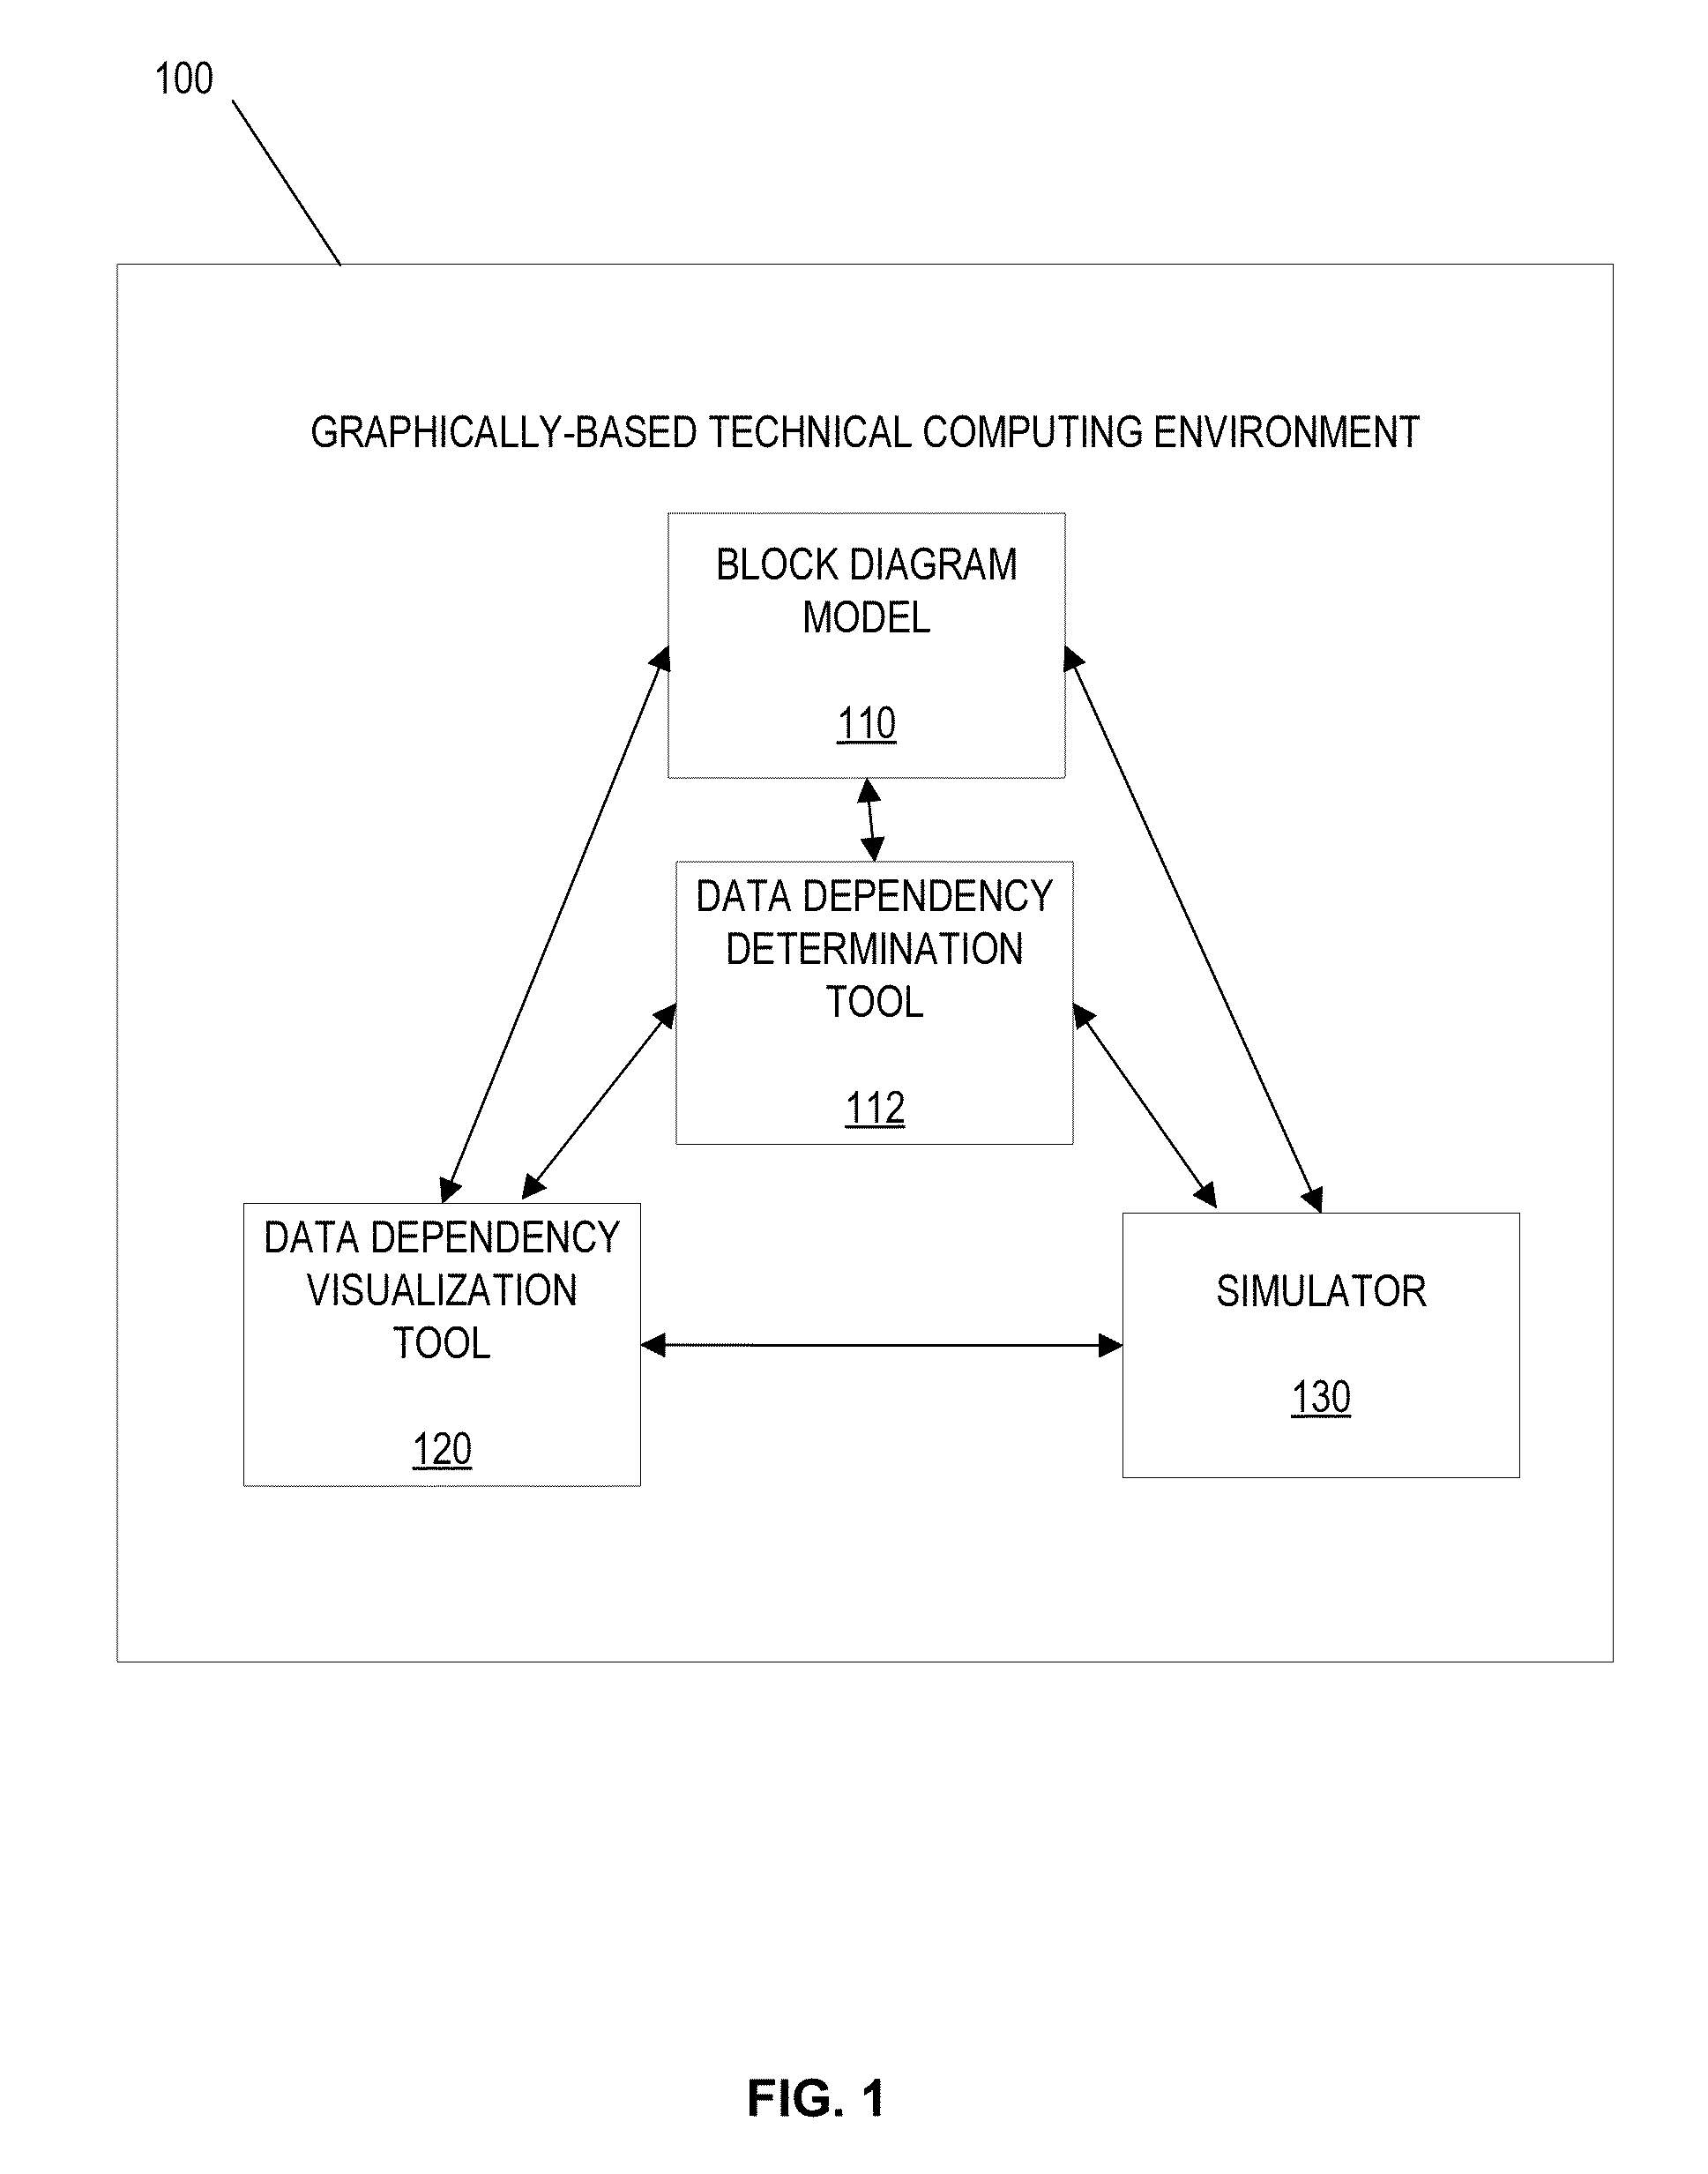
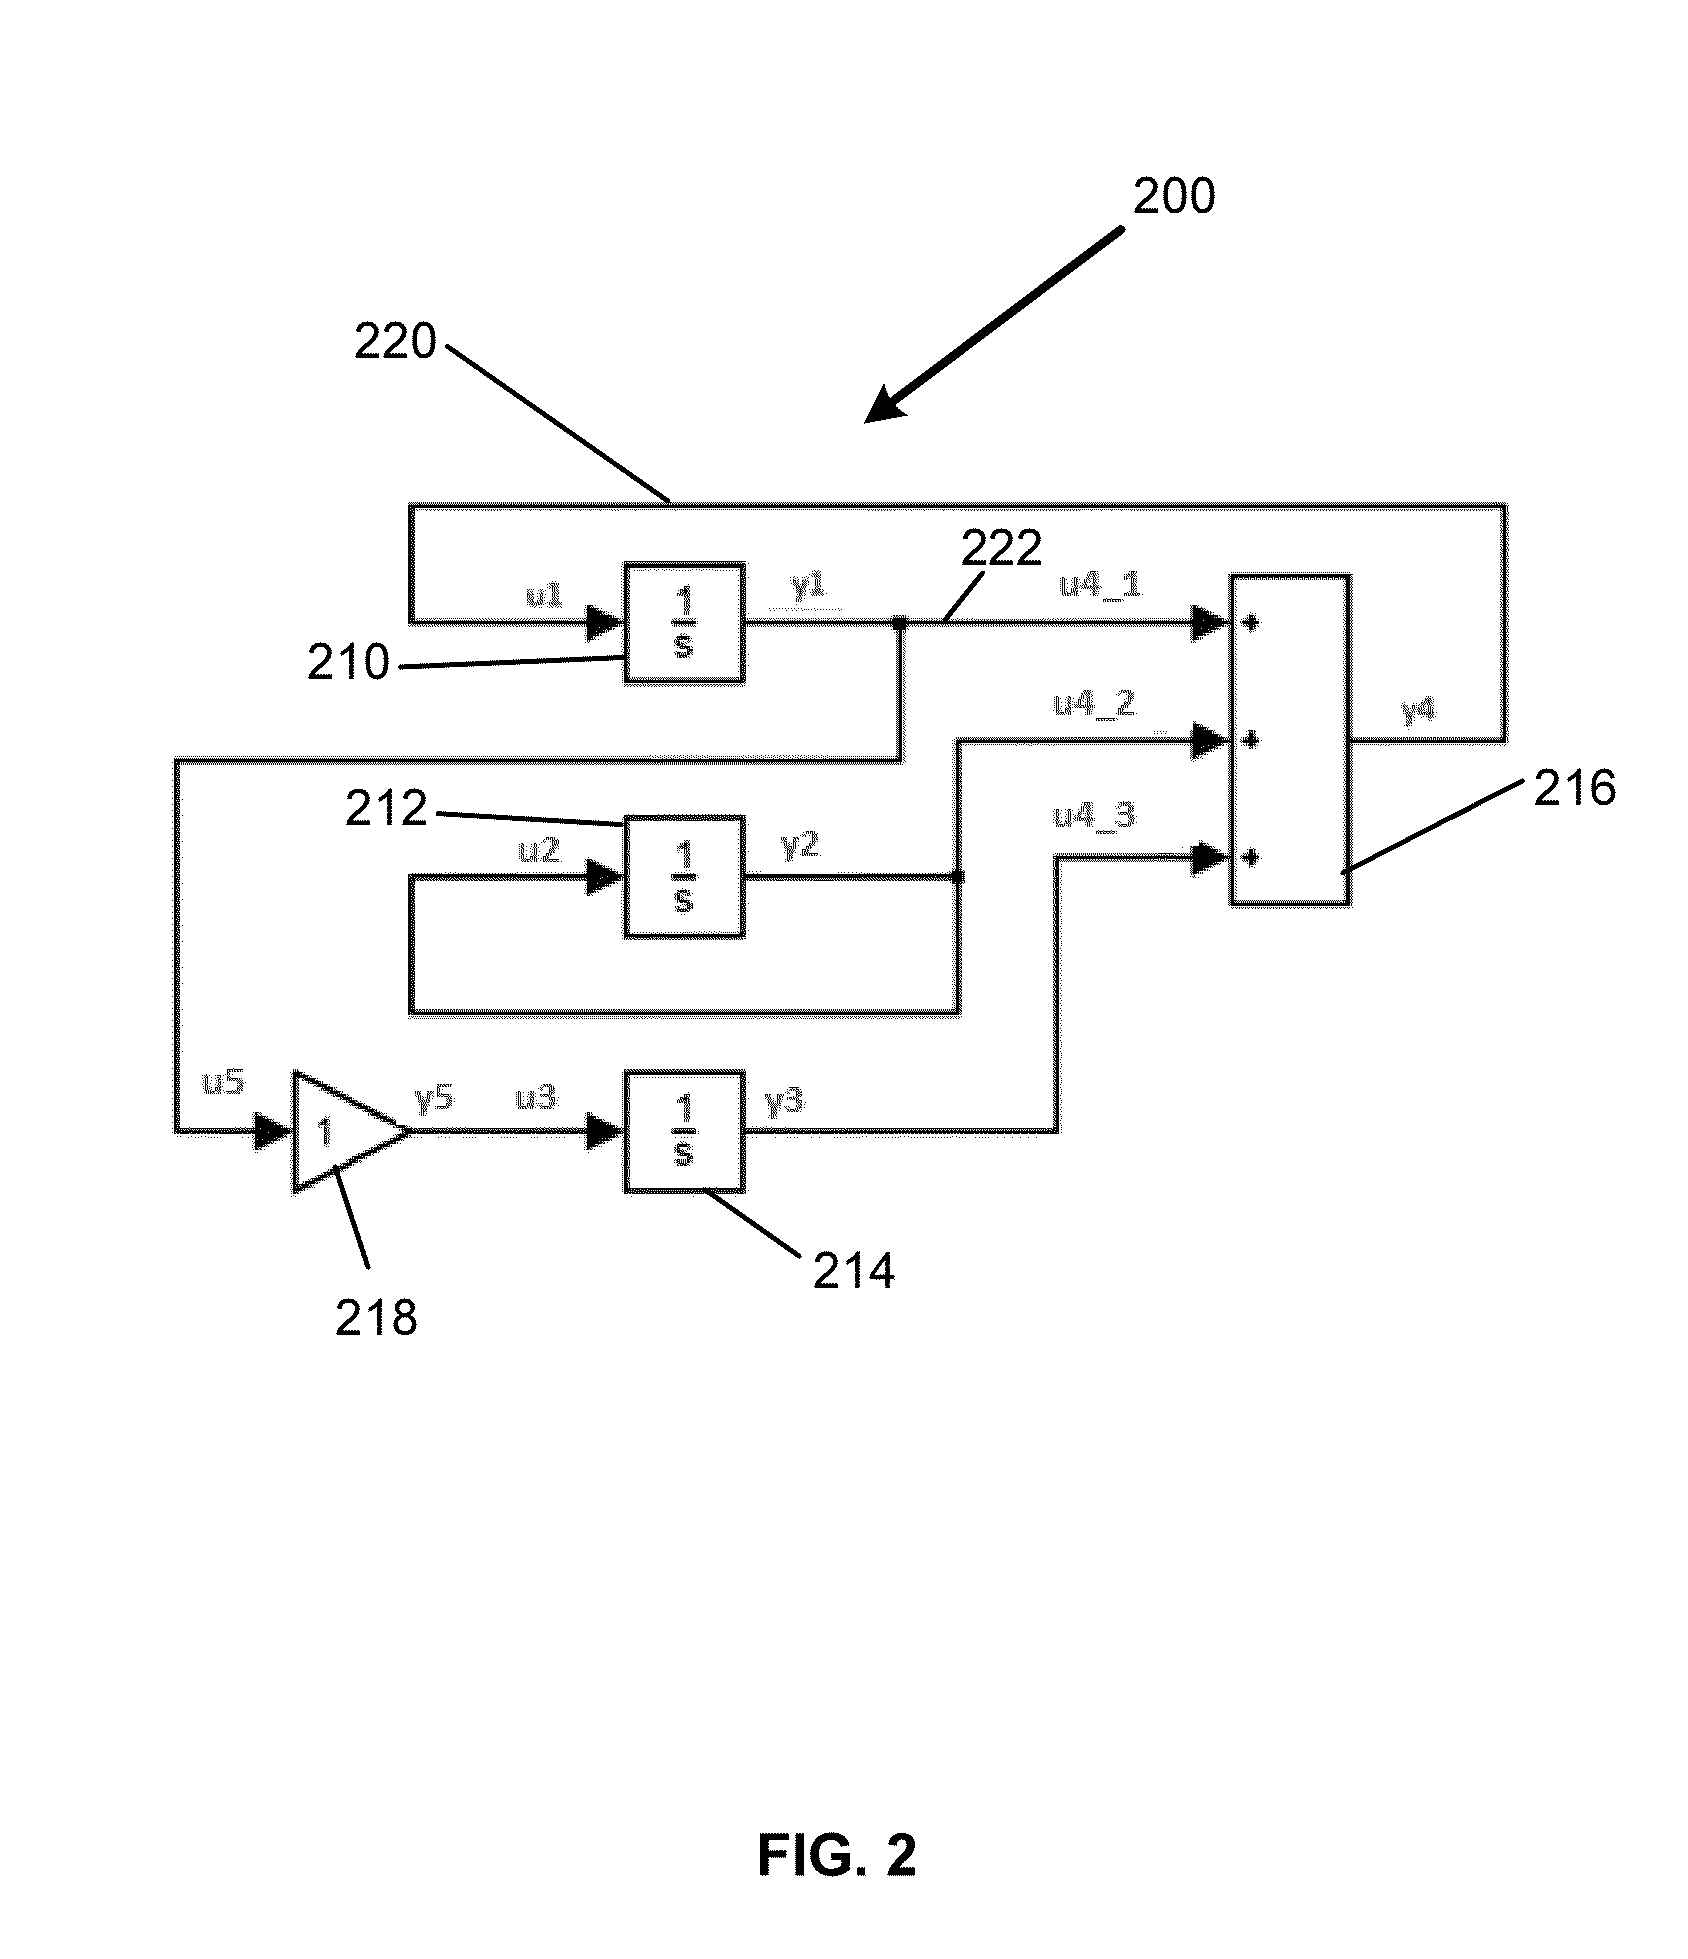
[0114]FIG. 13 illustrates exemplary processing 1300 for indicating data dependencies in a visualization according to an illustrative embodiment. The visualization may be a data dependency graph visualization. FIG. 2 previously described may be considered a data dependency graph visualization. As previously discussed, dependencies between the blocks (e.g., data dependency paths) may be indicated, for example by highlighting portions of model 200.

[0115]According to FIG. 13, data dependency visualization tool 120 may first interact with a model (act 1310). Interacting with the model may include one or more of the steps shown in the example processes of FIG. 8.

[0116]A user selection may then be received (act 1320). The user selection may identify a first portion of a visual representation of the model. For example, a user may click on a connection between blocks. R...


PUM


Abstract

In an illustrative embodiment, an apparatus, computer-readable media, or method may be configured to suggest determine relationships. Interaction with a block diagram model may include receiving a first portion of a block diagram model. The block diagram model may include a plurality of blocks. Each of the plurality of blocks may represent a set of dynamic equations. The interacting may be performed using the computer. Relationships between a plurality of a synthesized input, a synthesized output, a synthesized state, or a synthesized derivative, may be determined. A determination may be performed for the first portion of the block diagram model. The determining may include determining a block Jacobian pattern of relationships between two or more of an input, an output, a state, or a derivative of a first block of the plurality of blocks in the graphical model.

Description

[0001]This patent application is related to the co-filed application entitled “GRAPH THEORETIC LINEARIZATION AND SENSITIVITY ANALYSIS,” which is hereby incorporated by reference in its entirety.BACKGROUND SECTION[0002]A variety of dynamic systems exist, including systems for communications, controls, signal processing, video processing, and image processing. As systems have become more complicated, the development and testing of these systems have also become more complicated. Accordingly, computational tools have been developed to help model, simulate, and analyze systems.[0003]In one approach to modeling, simulating and analyzing systems, computational tools may represent systems as graphical models. Systems may be graphically modeled by decomposing components of the system into individual blocks. These blocks may then be connected to one another to form a block diagram model representing a system.BRIEF DESCRIPTION OF THE DRAWINGS[0004]The accompanying drawings, which are incorpor...

Claims


Application Information

Patent Timeline
Patent Type & Authority Applications(United States)
IPC IPC(8): G06F17/50G06F17/10
CPCG06F17/5009G06F8/10G06F30/20G06F9/445
Inventor ZHANG, FUHAN, ZHIYEDDANAPUDI, MURALIMOSTERMAN, PIETER JOHANNES
Owner THE MATHWORKS INC
Why Eureka
Try Eureka