System and method of automated acquisition, correlation and display of power distribution grid operational parameters and weather events

a technology of power distribution grid and operational parameters, applied in the field of system and method of automated acquisition, correlation and display of power distribution grid operational parameters and weather events, can solve problems such as service outages, operational events, and periodic service outages of the generation/transmission/distribution grid of an electrical power utility company, and achieve the effect of improving the utilization of data

Active Publication Date: 2013-10-10
GENERAL ELECTRIC CO
View PDF11 Cites 60 Cited by
  • Summary
  • Abstract
  • Description
  • Claims
  • Application Information

AI Technical Summary

Benefits of technology

[0006]The non-limiting example computer-implemented method, system and program product disclosed herein for providing graphical display of correlated weather information and power transmission / distribution grid operational events is contemplated by the inventor to employ the use of a corporate geographical information system (GIS), one or more sources / feeds of power grid operational event data and consumer feedback information for reporting changes in power availability, and one or more conventional sources / feeds of historical and forecast weather data (e.g., National Weather Service). Among other things, the non-limiting example computer-implemented method, system process and program product disclosed herein also serves as a useful and practical tool for enabling electrical power distribution grid controllers and operators to quickly and efficiently evaluate weather related events and determine what type, how much and how soon to implement anticipatory preparations to reduce or prevent weather induced outages.
[0012]In addition, the non-limiting example system / tool, method, computer implementation and program product implementation described herein provides certain tangible and practical commercial benefits. For example, at least one tangible result is realized in the form of an automated information acquisition and analysis tool / system that provides a user-controllable interface for presenting a video-graphic time-lapse evolution of correlated weather events and operational events which affect a utility's electrical power transmission / distribution facilities. Moreover, through a collaboration and accumulation of data acquired from a plurality of different utilities which may be using the system / tool disclosed herein, e.g., multiple vendors who manage and operate electrical power generation or transmission / distribution networks, an improved integration of infrastructure related information from each vendor's operational system and improved leveraging of the data across these systems is realized and can be used to create new value that would not have been obtainable from such systems individually.

Problems solved by technology

Weather conditions and events can have a significant impact upon the generation and distribution of electric power and, consequently, in the number and type of service outages that may result and affect the customers of a particular electrical power utility company.
Typically, the generation / transmission / distribution grid of an electrical power utility company will experience periodic service outages due to weather conditions that effect power distribution and availability to specific customers and / or specific areas.
However, not all service outages and operational events are a result of the weather, even if occurring during a prevailing weather condition / event.
Unfortunately, accurate weather-related power demand forecasting requires an ability to monitor and analyze existing power generation facilities and transmission / distribution grid operational events in light of constantly evolving weather patterns from days or even weeks past up to the present and including forecasts of several hours to weeks out.

Method used


Image

  • System and method of automated acquisition, correlation and display of power distribution grid operational parameters and weather events
  • System and method of automated acquisition, correlation and display of power distribution grid operational parameters and weather events
  • System and method of automated acquisition, correlation and display of power distribution grid operational parameters and weather events

Examples


Embodiment Construction

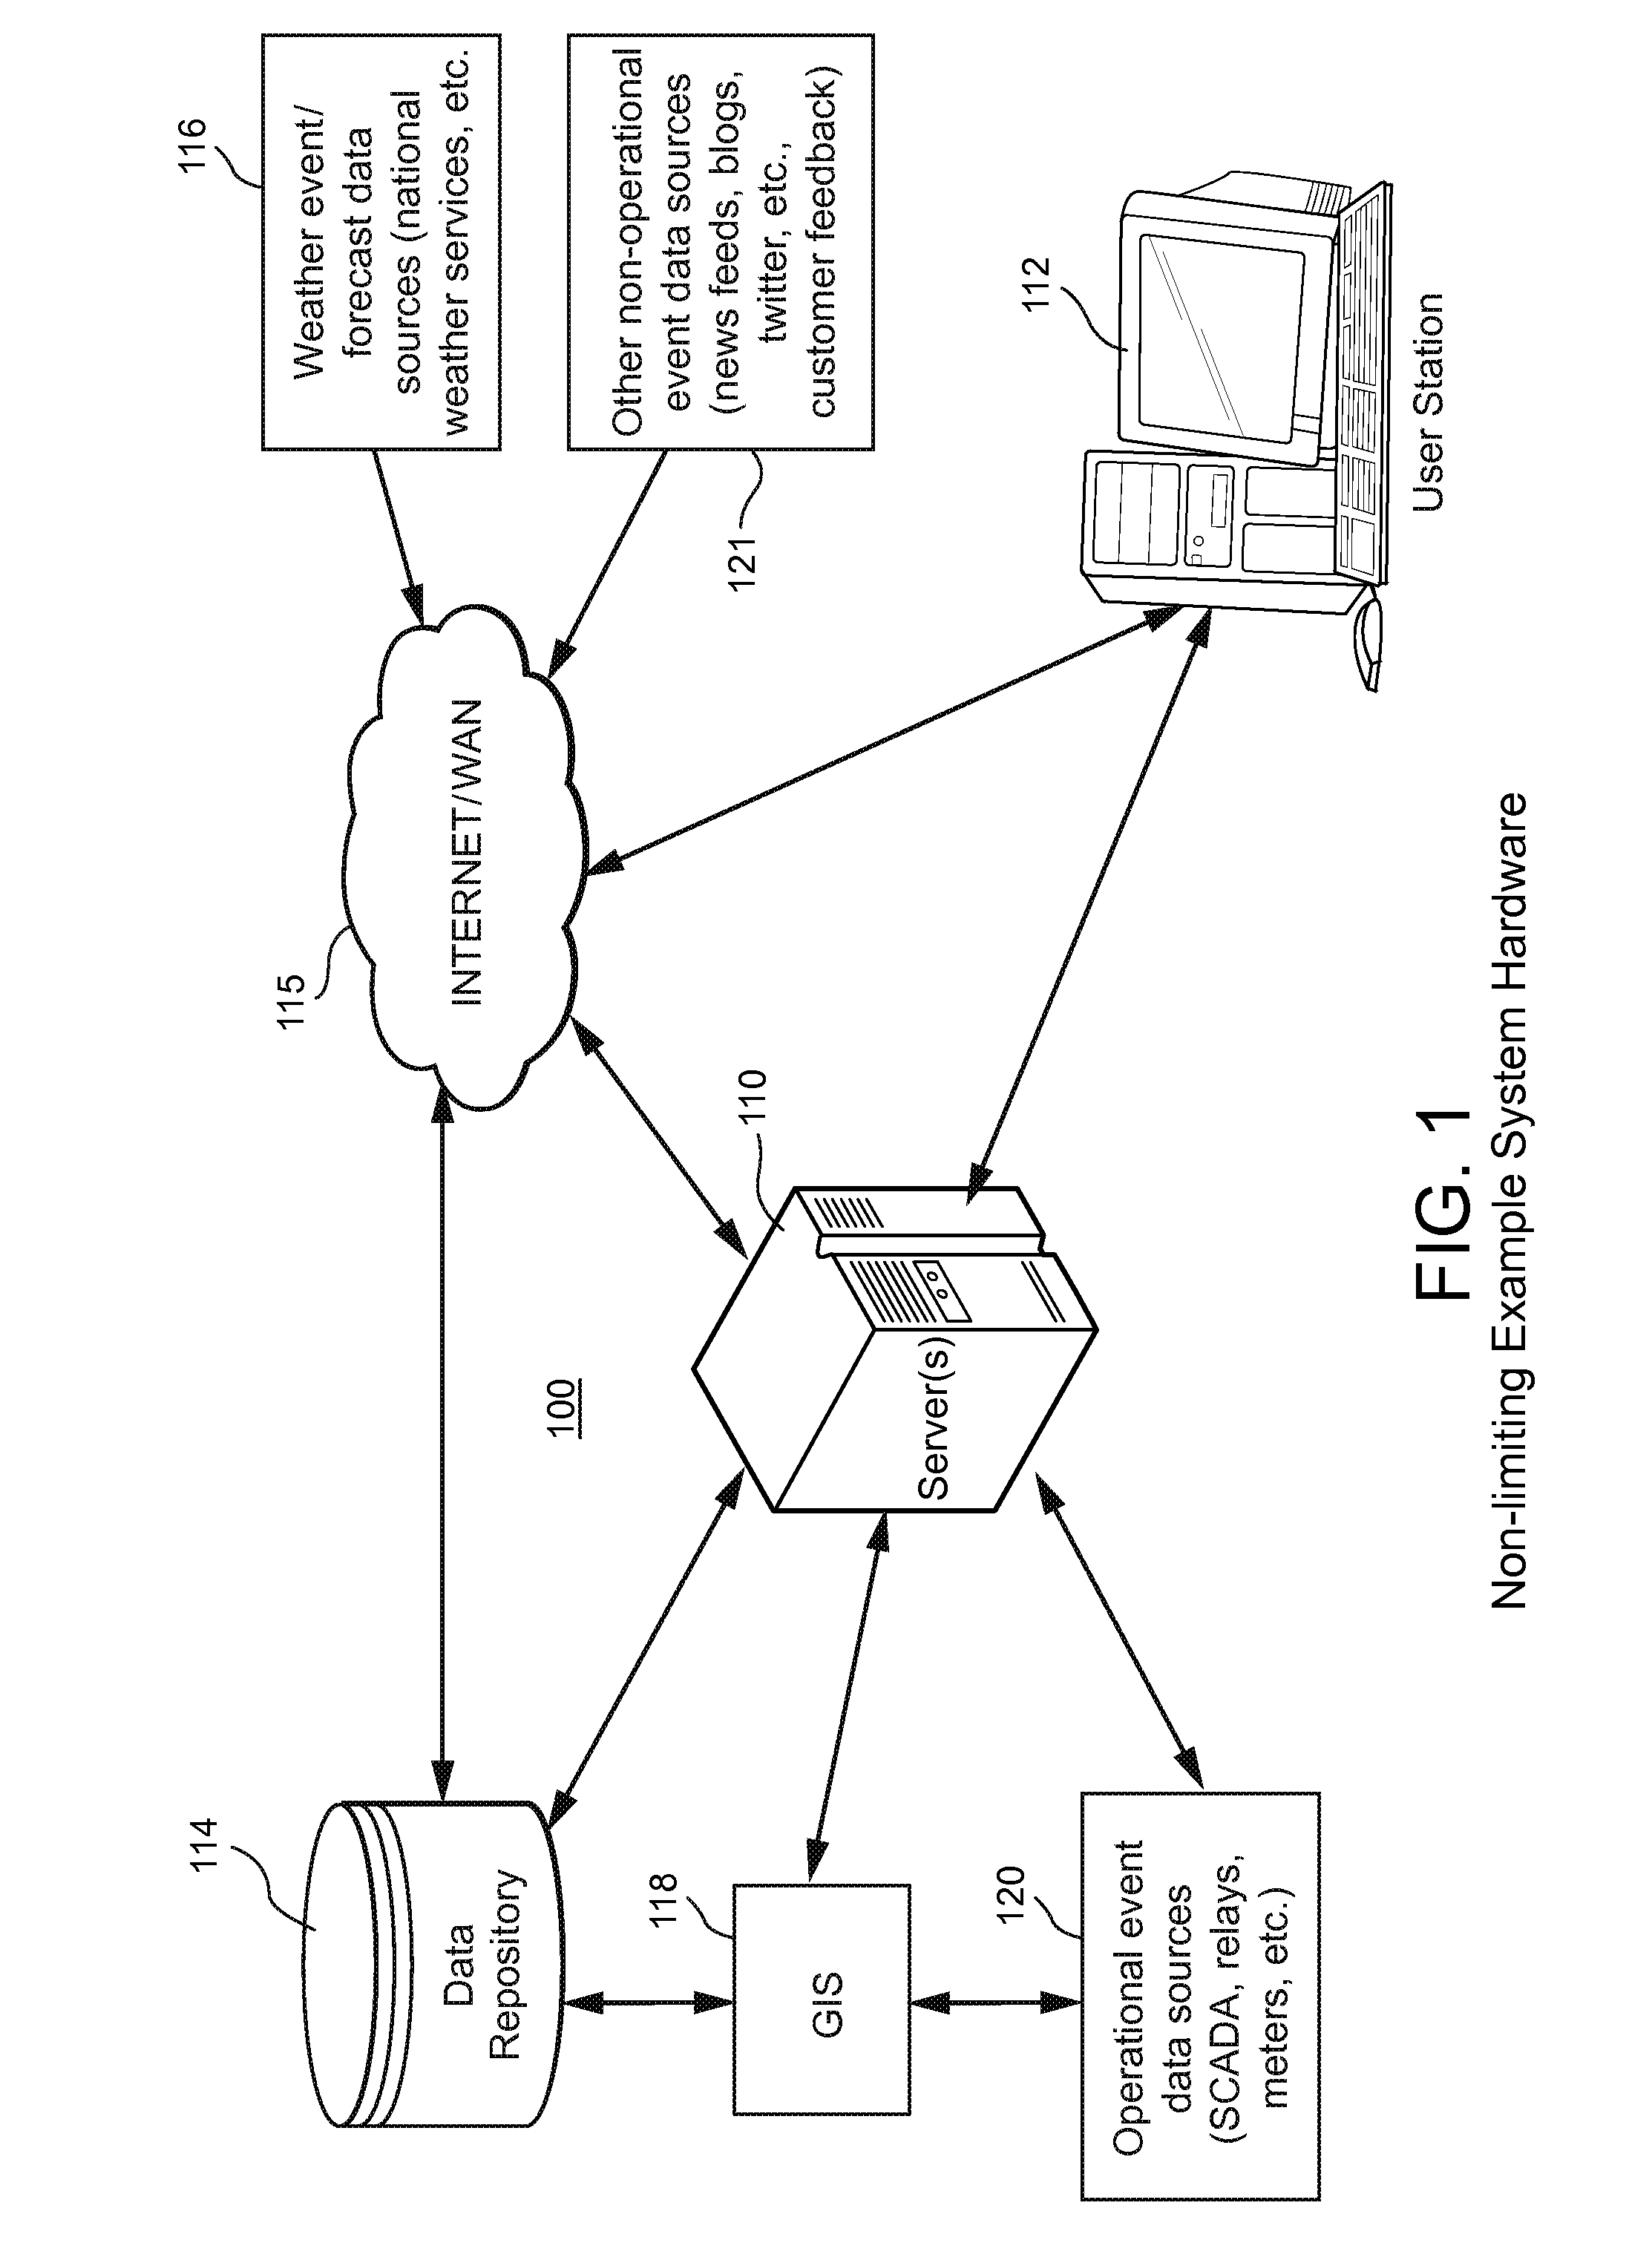
[0021]FIG. 1 is a block diagram illustrating an exemplary operating environment for performing the disclosed method and apparatus for correlation and display of operational parameters / events and weather phenomenon events. This non-limiting example operating environment is only an example of an operating environment and is not intended to suggest any limitation as to the scope of use or functionality of operating environment architecture. Neither should the operating environment be interpreted as having any dependency or requirement relating to any one or combination of components depicted in the exemplary operating environment.

[0022]More specifically, FIG. 1 schematically illustrates an example computer network arrangement 100 with which the disclosed computer-implemented weather event-operational event correlation system / tool for providing a visual display of a corporate or commercial entity's infrastructure operational events / parameters and correlated weather events may be impleme...


PUM


Abstract

Significant changes in monitored and reported operational parameters and / or power outage events occurring in a utility's electrical power transmission / distribution grid are correlated with historical, current and / or forecast weather events based on potential root cause, geographic and temporal constraints. Operational event and outage information is collected and time-stamped using a communication network of devices and sources that monitor and report, among other things, equipment parameters, electric power availability and outages. A computer-implemented root cause analysis engine (RCA) operatively associated with a computer-implemented weather data correlation engine sorts and analyzes operational parameter / event information and identifies probable correlations to localized weather phenomenon. Operational parameters / events are then displayed using a graphic display device in a manner that enables user controllable and configurable viewing of a time-lapse evolution of weather phenomenon overlayed with graphics representing both weather-related and other relevant operational parameters / events depicted in relation to the utility's physical infrastructure.

Description

[0001]The technology disclosed herein relates generally to automated information acquisition, event correlation and information display. More specifically, the disclosed technology relates to a computer-implemented tool / system and method for acquiring information concerning operational parameters / events occurring in an electrical power distribution grid, determining degree of correlation of such events to relevant weather phenomenon, and for displaying the acquired information as an animated time-lapse event evolution in a user-controllable manner.BACKGROUND[0002]Weather conditions and events can have a significant impact upon the generation and distribution of electric power and, consequently, in the number and type of service outages that may result and affect the customers of a particular electrical power utility company. Typically, the generation / transmission / distribution grid of an electrical power utility company will experience periodic service outages due to weather conditio...

Claims


Application Information

Patent Timeline
Patent Type & Authority Applications(United States)
IPC IPC(8): G06F19/00G01W1/10G01W1/00
CPCG01W1/00Y04S10/60G06Q50/06G06Q10/04Y02A90/10Y04S10/50G01W1/10
Inventor DAM, QUANG BINH
Owner GENERAL ELECTRIC CO
Why Eureka
Try Eureka