System and method for analyzing hospitality industry data and providing analytical performance management tools

a technology for hospitality industry and data analysis, applied in the field of hospitality industry data analysis, can solve the problems of limited scope of data and analytics available to hotel management teams, asset managers and/or owners to evaluate the overall process of generating revenue, inconsistent tools for business evaluation and oversight of brand performance,

Inactive Publication Date: 2014-09-11
KALIBRI LABS
View PDF6 Cites 12 Cited by
  • Summary
  • Abstract
  • Description
  • Claims
  • Application Information

AI Technical Summary

Benefits of technology

[0006]The inventive system enables evaluation of a hotel's total aggregate revenue performance (net RevPAR metric) and then breaks out the two primary ways that this revenue is acquired, namely: (1) using channel-specific levers such a commissions, transaction fees, channel technology, booking incentives (as reflected in the COPE % metric); and (2) using non-channel specific levers, such as broadly spent sales and marketing funds like generalized media, sales payroll, public relations and social media (as reflected in a Sales & Marketing Efficiency metric). This process allows hotel management to look at a macro view and then to take micro-snapshots to identify those elements that are cost-effective and those that are not. The analytics process further unpacks the efficacy of various customer acquisition methods (via different marketing channels) by filtering these three main metrics to be viewed by the variables that more finely parse the customers acquired into subgroups that reveal more about the nature of specific booking profiles, such as by stay day of week, length of stay, booking lead time, specific travel agency account or type of travel agency account.

Problems solved by technology

The hospitality industry is highly segmented, with relatively little centralized control and relatively little business intelligence useful for managing profitability.
The data and analytics that are available for a hotel management team, an asset manager and / or owner to evaluate the overall process of generating revenue is limited in scope.
For many owners, they have to learn proprietary systems for each brand and that makes the tools for business evaluation and oversight of the brand's performance inconsistent and confusing.
Anything more granular than this metric has not been possible on an industry-wide basis.
However, very little if any analysis and / or reporting of this data is made for the purpose of improving any individual hotel's / franchisee's profitability.
Accordingly, despite a relatively large data set, an individual hotel / franchisee has very little data-based business intelligence to assist the individual hotel / franchisee in making sales and marketing decisions that could improve profitability on a per-hotel / franchisee basis.

Method used


Image

  • System and method for analyzing hospitality industry data and providing analytical performance management tools
  • System and method for analyzing hospitality industry data and providing analytical performance management tools
  • System and method for analyzing hospitality industry data and providing analytical performance management tools

Examples


Embodiment Construction

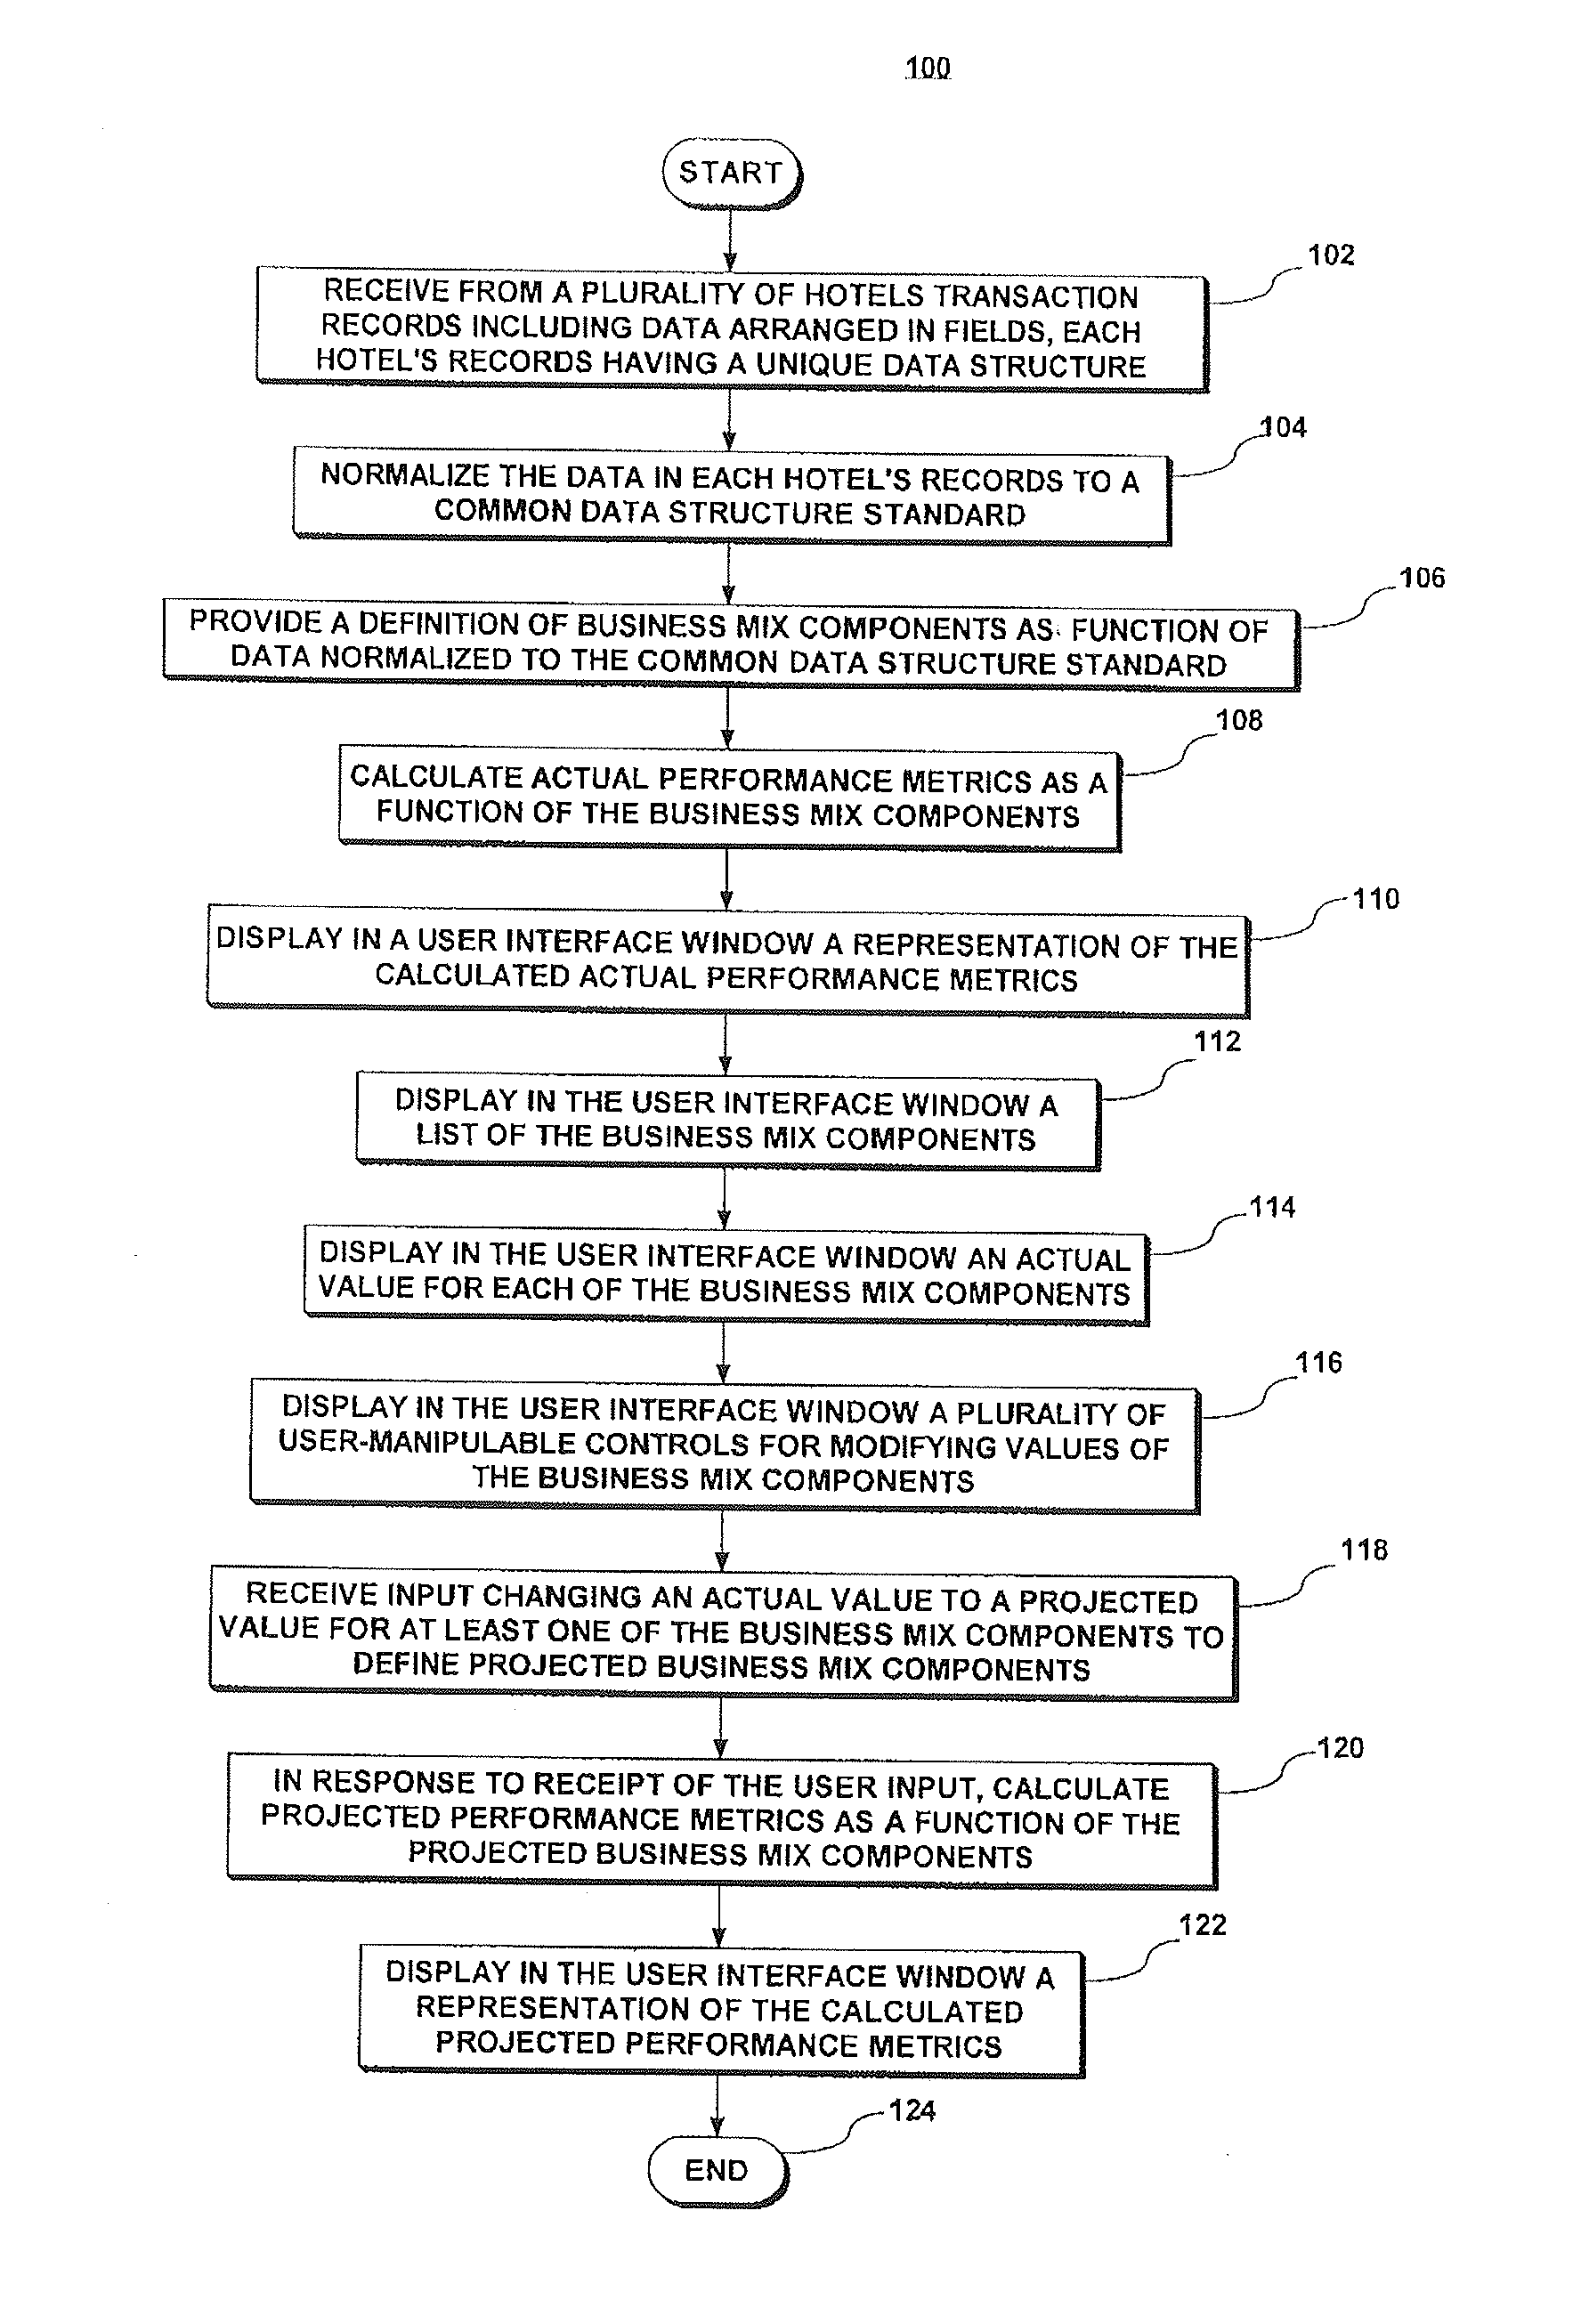
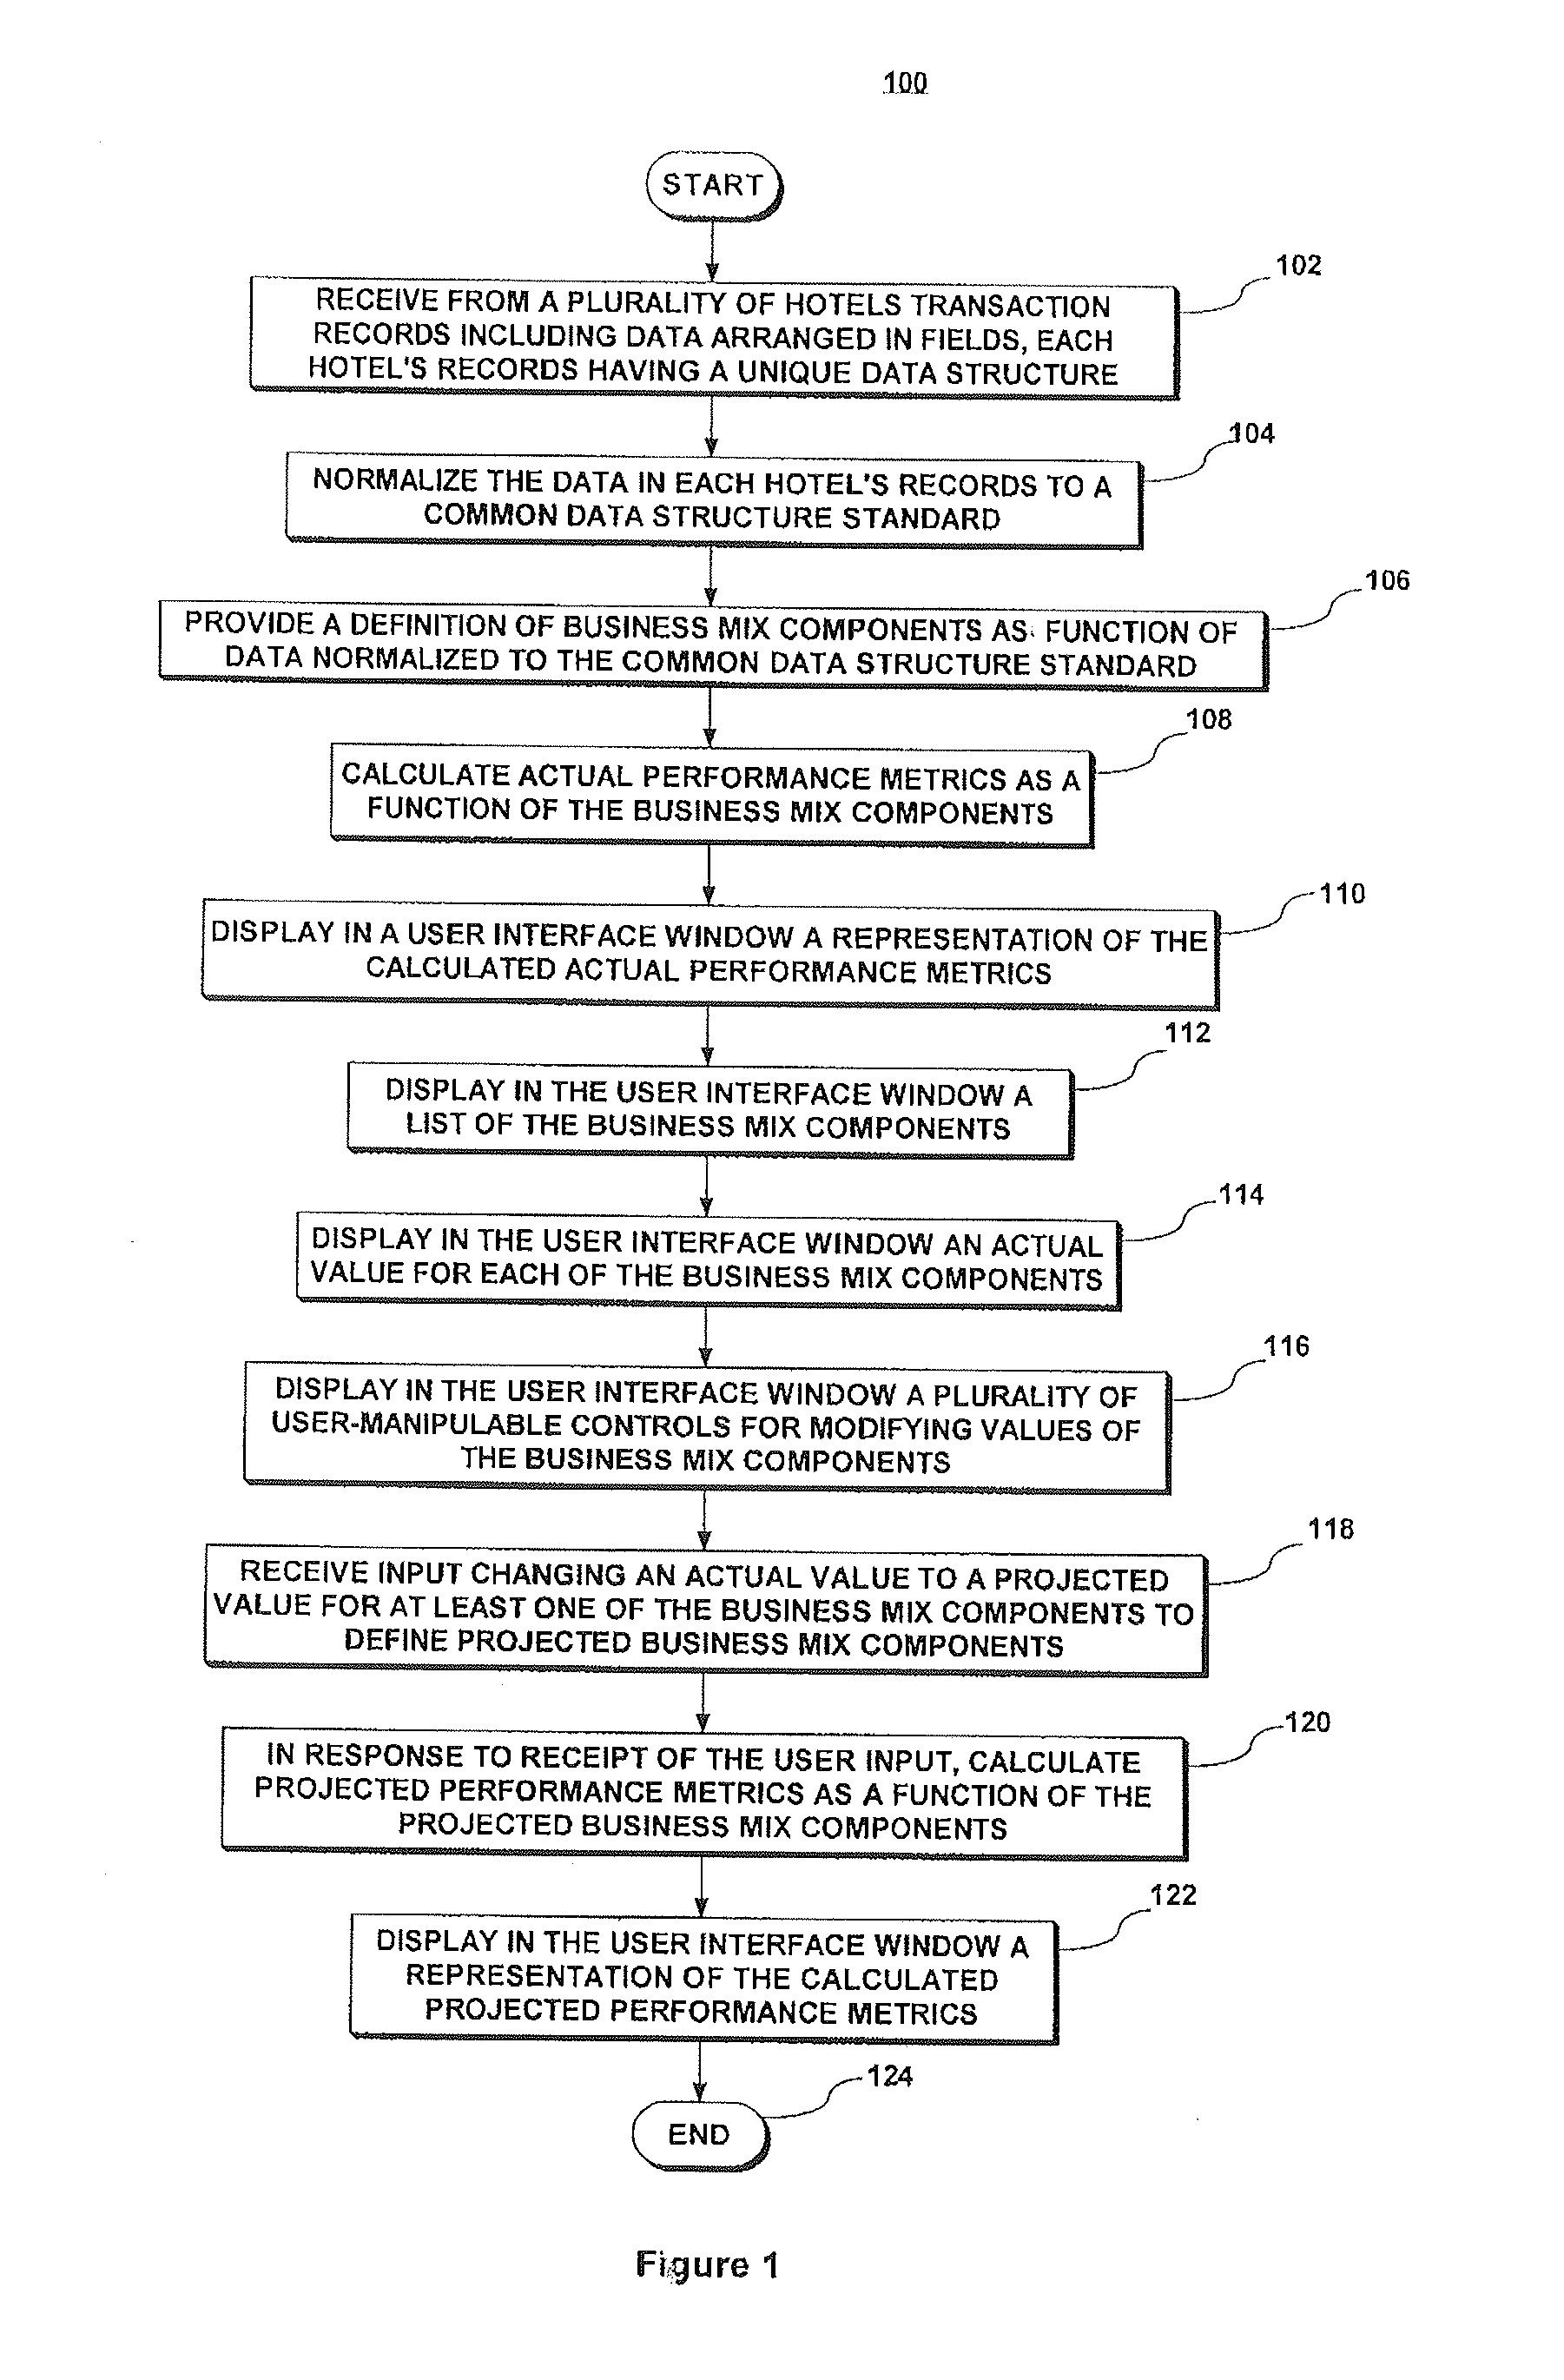
[0023]The present invention relates to a system and method for analyzing hospitality industry data that provides tools for improving and / or optimizing performance on a per-hotel and / or per-owner basis or across a range of hotels managed and / or owned by one company that may be representing multiple brands.

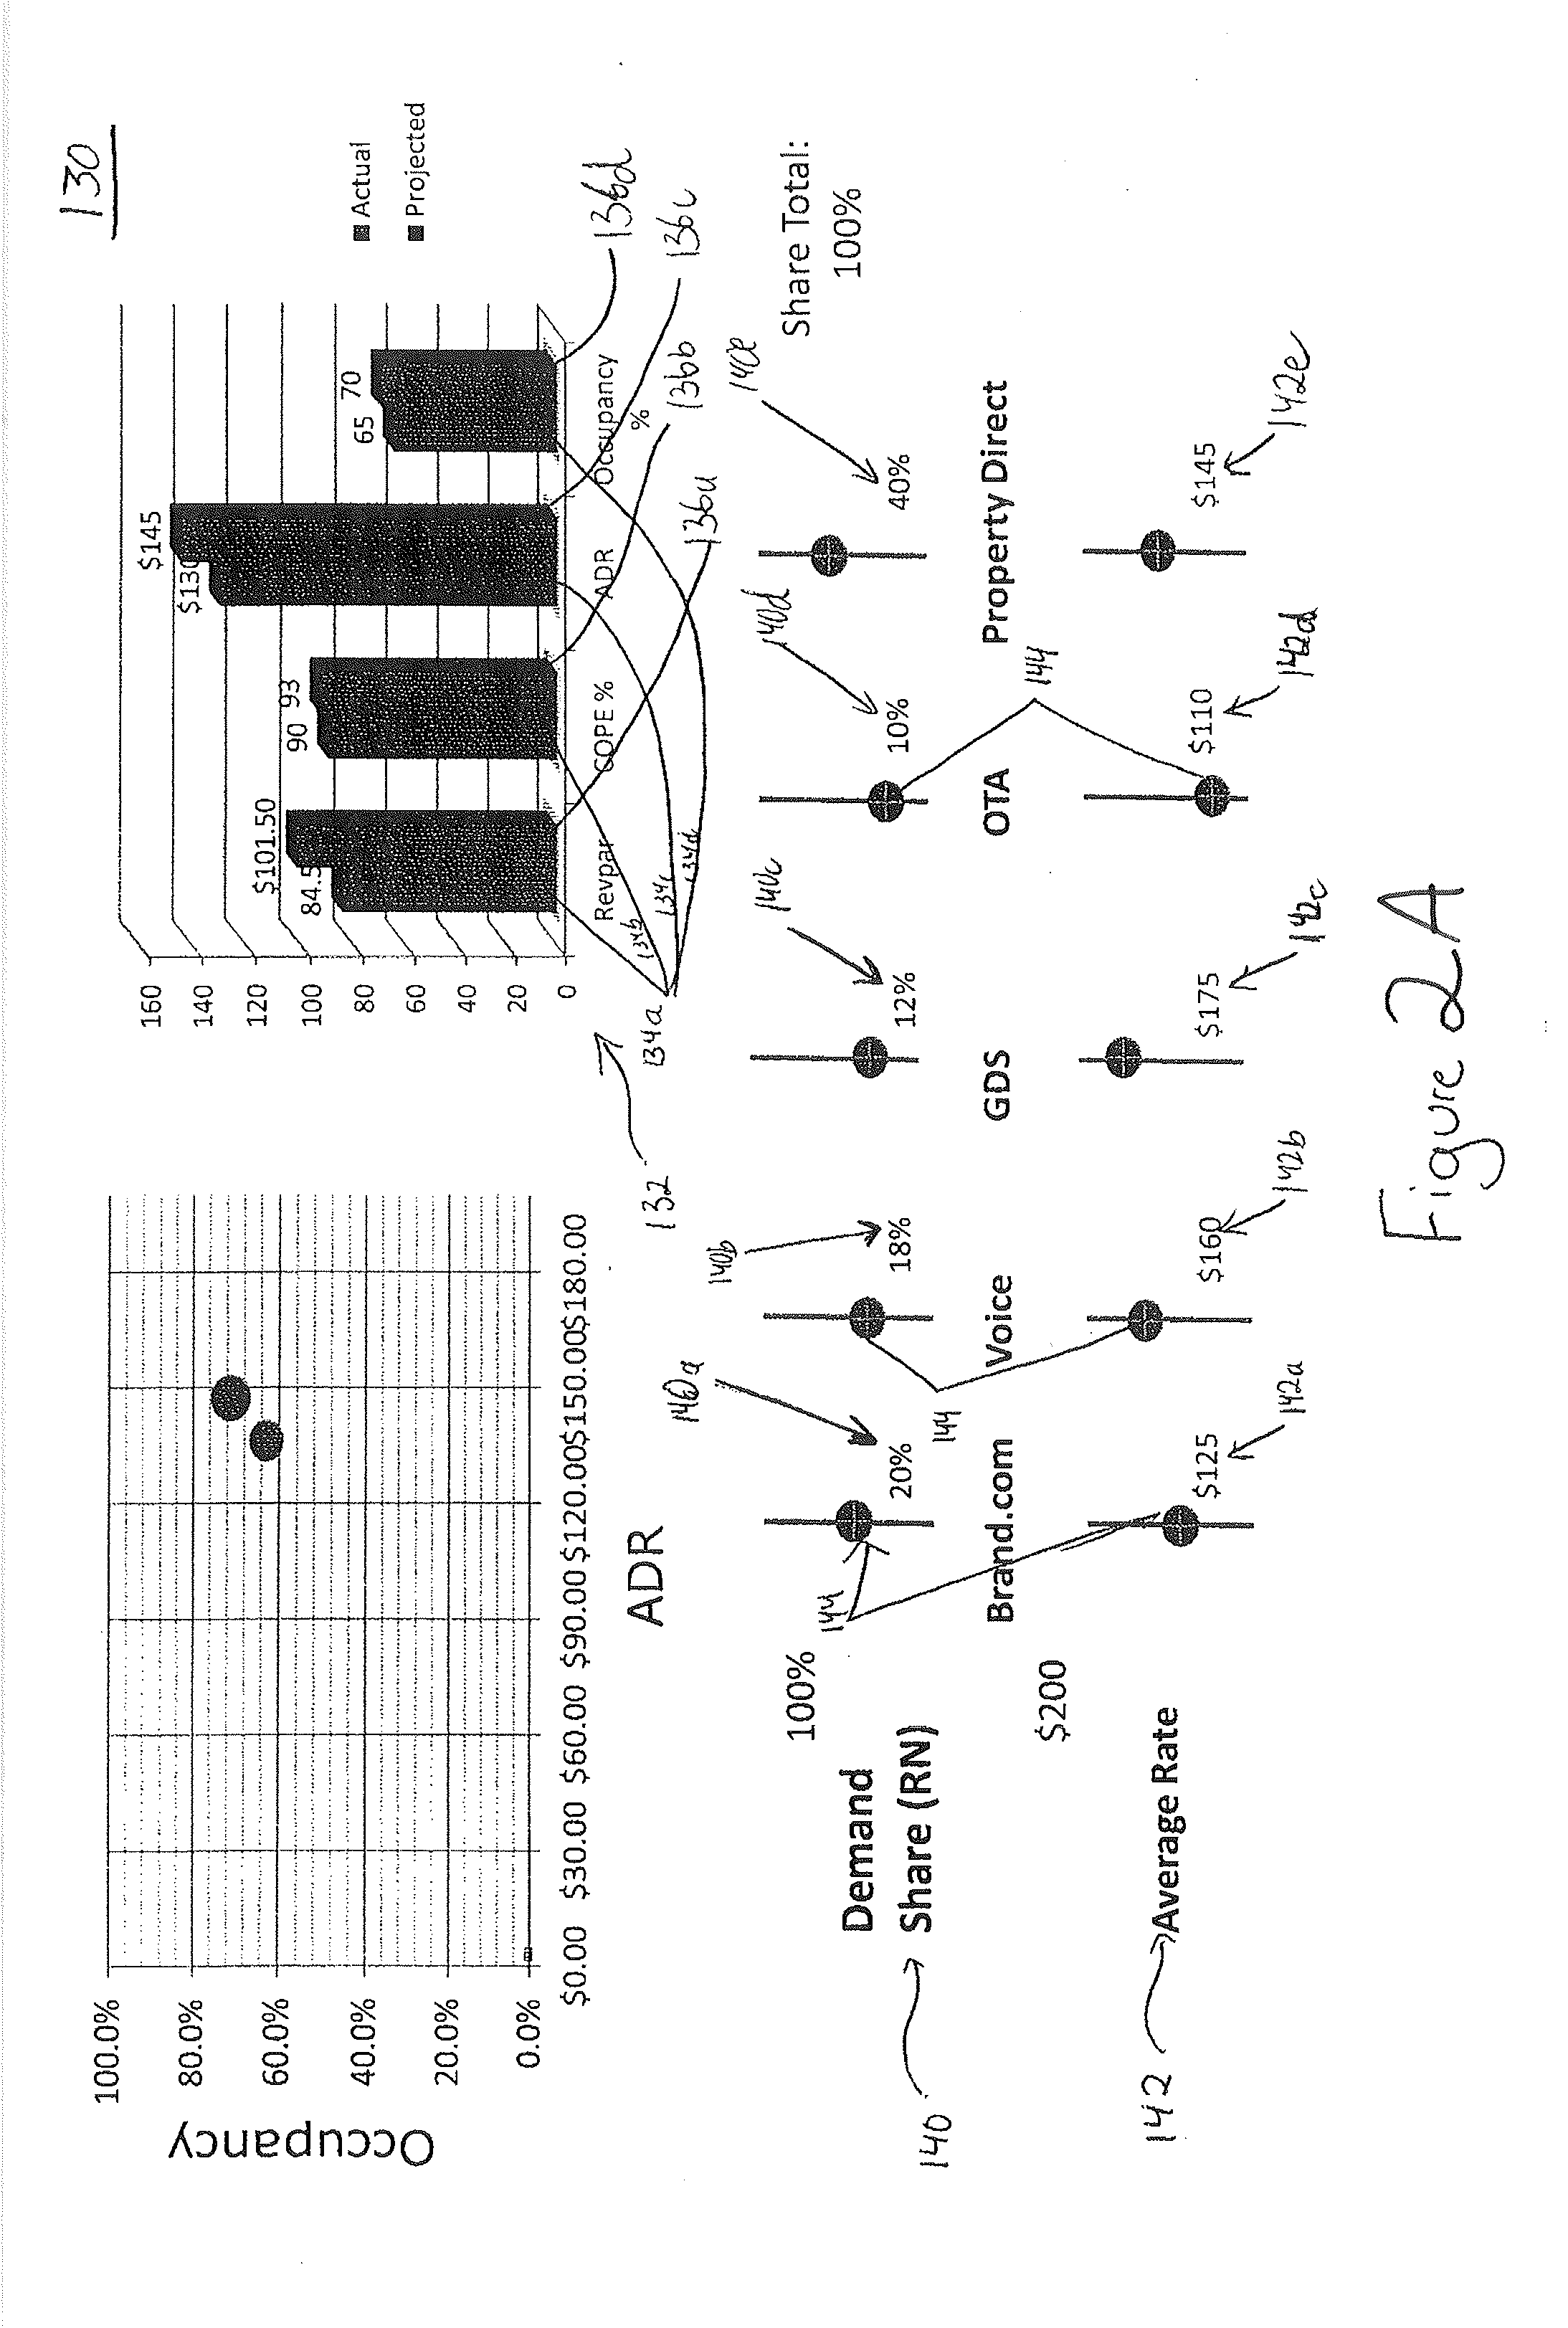
[0024]As discussed above, the inventive system enables evaluation of the hotel's total aggregate revenue performance (net RevPAR metric) and then breaks out the two primary ways that this revenue is acquired, namely: (1) using channel-specific cost levers, such as commissions, transaction fees, channel technology, booking incentives (as reflected in the COPE % metric); and (2) using non-channel specific cost levers, such as broadly spent sales and marketing funds like generalized media, sales payroll, public relations and social media (as reflected in the Sales & Marketing Efficiency metric). This process allows management to look at the macro view and then to take micro-snapshots t...


PUM


Abstract

Hospitality customer acquisition and retention costs are analyzed on a per-channel, channel-agnostic, and aggregated basis. Hotel performance is analyzed by examining net revenue by channel (accounting for each channel's contribution to operating expenses and profits), net revenue in aggregate (via net revPAR and revPAR capture metrics), and the relative benefit of sales and marketing expenses by quantifying net sales and marketing efficiency. Conceptually, this differentiation parses the relevant business into a revenue performance evaluation and a return on investment evaluation, in terms that are specific to the hospitality environment. Transaction data is analyzed from multiple hotels and each hotel's costs are mapped to a common data structure to allow for hotel-to-industry comparisons. Graphical user interfaces are provided for reporting data and comparisons, and for receiving input to initiate what-if analyses to determine projected impacts to performance metrics as a result of changes made to business mix components.

Description

CROSS-REFERENCE TO RELATED APPLICATIONS[0001]This application is based on, and claims priority to, U.S. Provisional Patent Application Nos. 61 / 776,707, filed Mar. 11, 2013, and 61 / 777,451, filed Mar. 12, 2013, the entire contents of both of which are fully incorporated herein by reference.FIELD OF THE INVENTION[0002]The present invention relates generally to analysis of data in the hospitality industry, and more particularly to a system and method for analyzing hospitality industry data for the purposes of increasing profitability.DISCUSSION OF RELATED ART[0003]The hospitality industry is highly segmented, with relatively little centralized control and relatively little business intelligence useful for managing profitability. For example, in the hotel segment alone, there are many different hotel chains / brands, such as Marriott, Hilton, IHG and Hyatt, each of which operates according to a structure by which they provide marketing and other services to a hotel owner and, in addition,...

Claims


Application Information

Patent Timeline
Patent Type & Authority Applications(United States)
IPC IPC(8): G06Q50/12G06Q10/06
CPCG06Q10/0639G06Q50/12
Inventor GREEN, CINDY ESTISBENNETT, ROBERT S.
Owner KALIBRI LABS
Why Eureka
Try Eureka