Eureka AIR delivers breakthrough ideas for toughest innovation challenges, trusted by R&D personnel around the world.

Rotation of graphical scenes

Inactive Publication Date: 2015-01-01
MINESET INC
View PDF35 Cites 5 Cited by
  • Summary
  • Abstract
  • Description
  • Claims
  • Application Information

AI Technical Summary

Benefits of technology

This patent describes a technology that allows users to interactively rotate data about a specific axis in a three-dimensional interface. The data can be structured, semi-structured, or unstructured, and can be filtered and analyzed before being displayed. Users can easily drag a cursor across an axis in the interface to rotate the data. This technology provides a more intuitive and flexible way to display and analyze geospatial data.

Problems solved by technology

However, it can be cumbersome to control the display of data from control portions of a visualization interface that are separate from a graphics portion.

Method used


Image

  • Rotation of graphical scenes
  • Rotation of graphical scenes
  • Rotation of graphical scenes

Examples


Embodiment Construction

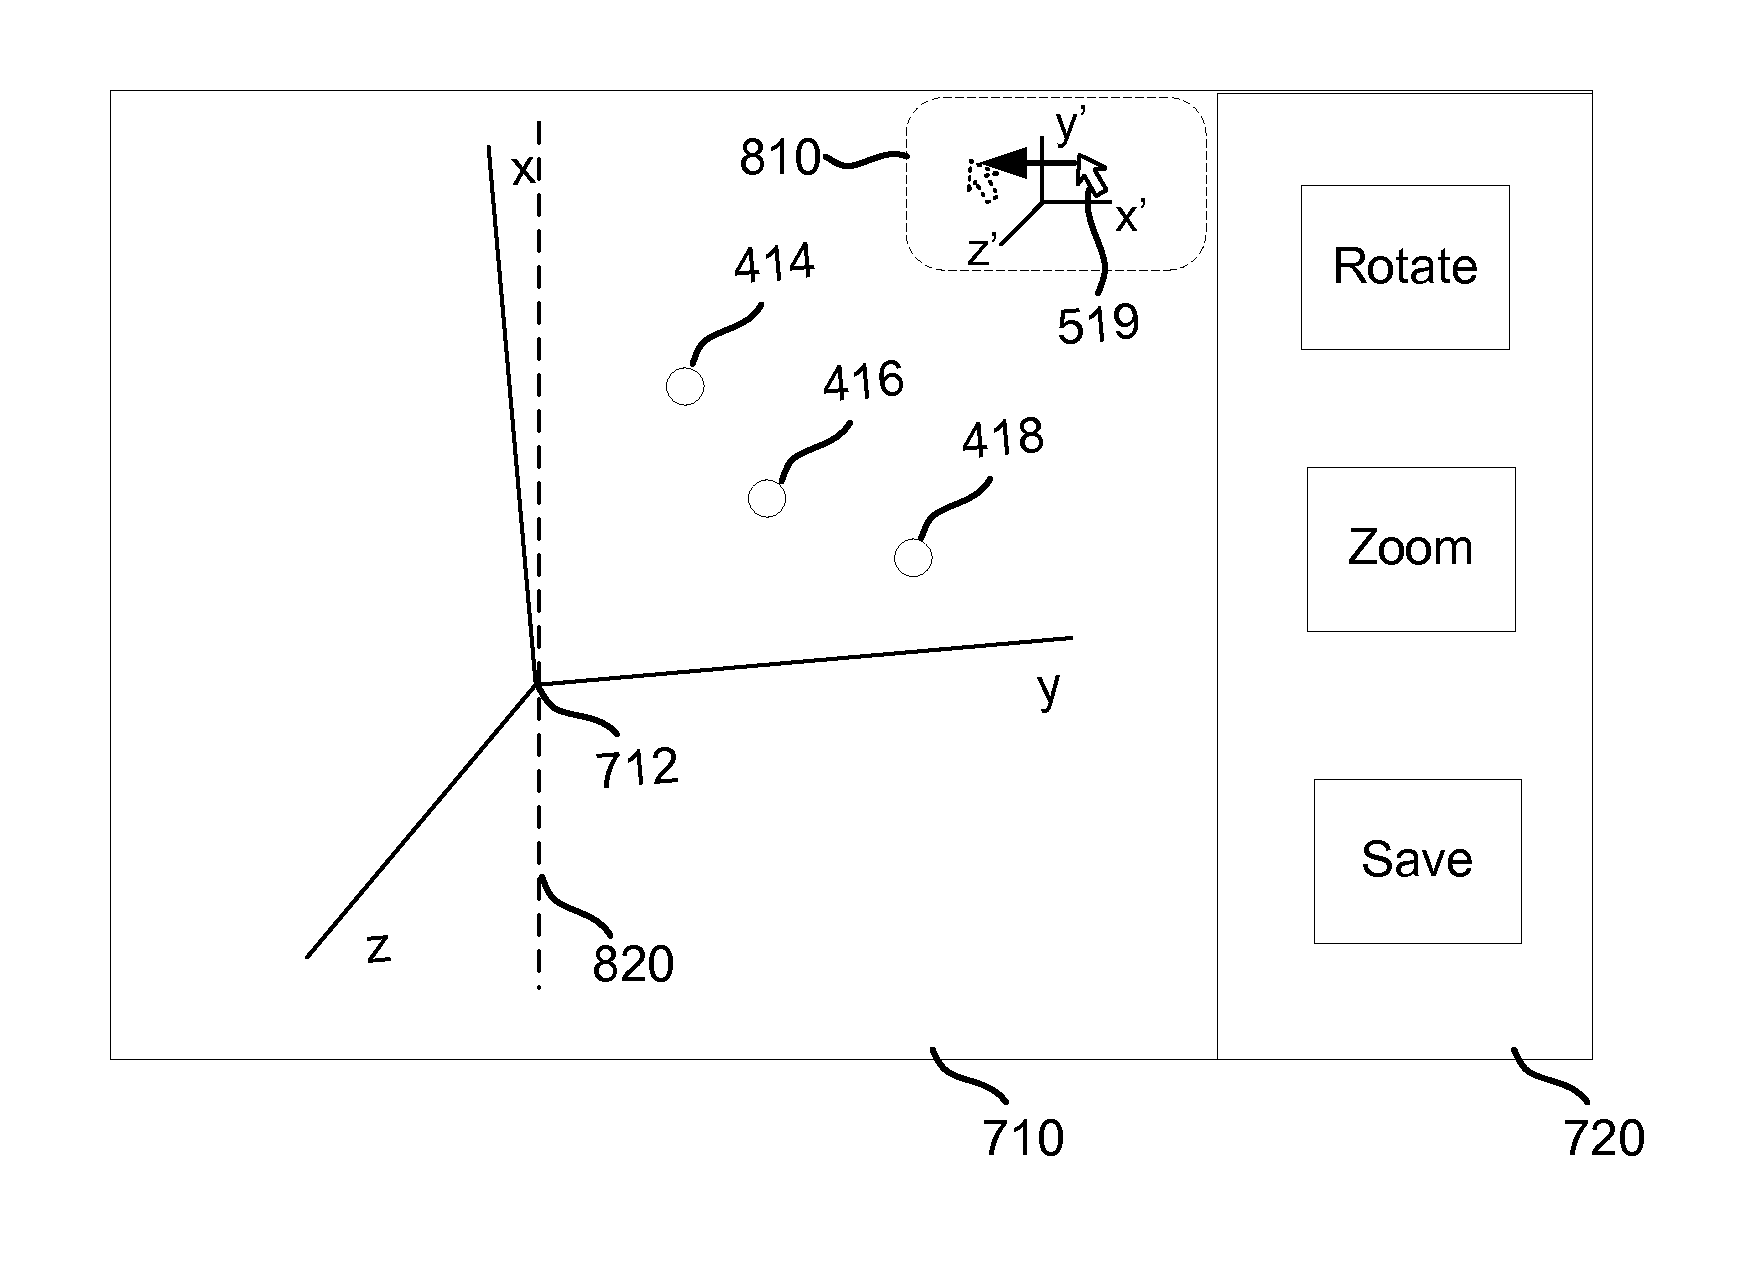
[0020]The present technology may provide data visualization with the capability to interactively rotate data about a particular co-ordinate axis or other axis. Data to be visualized is accessed by a data visualization application. The data may be structured or unstructured, filtered and analyzed. The accessed data may be displayed through an interface of the visualization application for a user. The coordinate system for displaying the data may also be displayed. A user may rotate data about a particular axis of the coordinate system by providing a continuous input within a graphics portion of an interface. The input may be associated with the particular axis. For example, to rotate data about a particular coordinate axis such as an x, y or z axis displayed in the interface, a user may drag a cursor across the axis within the graphical portion of the interface. The data displayed in the interface will rotate about the coordinate axis as the user drags the cursor.

[0021]FIG. 1 is a sy...


PUM


Abstract

Data visualization is provided with the capability to interactively rotate data about a particular co-ordinate axis or other axis. Data to be visualized is accessed by a data visualization application. The accessed data may be displayed through an interface of the visualization application for a user. A user may rotate data about a particular axis of the coordinate system by providing a continuous input within a graphics portion of an interface. The input may be associated with the particular axis. The data displayed in the interface will rotate about the coordinate axis as the user drags the cursor.

Description

CROSS-REFERENCE TO RELATED APPLICATIONS[0001]This application claims the priority benefit of U.S. provisional application No. 61 / 841,259, titled “Rotation of Graphical Scenes,” filed Jun. 28, 2013, the disclosure of which is incorporated herein by reference.BACKGROUND[0002]1. Field of the Invention[0003]The present invention relates to visualization of data. In particular, the present invention relates to rotating about graph axes.[0004]2. Description of the Prior Art[0005]Visualization of data in three dimensional graphs can be helpful to understand the data. An example of a three dimensional graph is a plot of data on multiple axis, such as a horizontal, vertical, and another coming towards or away from the point of view of a viewer. Typically, visualization applications which display three dimensional data provide an interface having a graphical portion which provides data graphics and a control portion, such as a bar of control buttons. The control buttons may be implemented on ...

Claims


Application Information

Patent Timeline
IPC IPC(8): G06F3/0481G06F3/0482G06F3/0484
CPCG06F3/04815G06F3/04845G06F3/0484G06F3/0482G06F2203/04806G06F2203/04808
Inventor HANSEN, MARC, DAVID
Owner MINESET INC
Why Eureka
Eureka Blog
Learn More