

Test preparation systems and methods
a technology of applied in the field of test preparation system and method, can solve problems such as students ignoring comments, and achieve the effect of convenient us
- Summary
- Abstract
- Description
- Claims
- Application Information
AI Technical Summary
Benefits of technology
Problems solved by technology
Method used
Image

Examples
Embodiment Construction
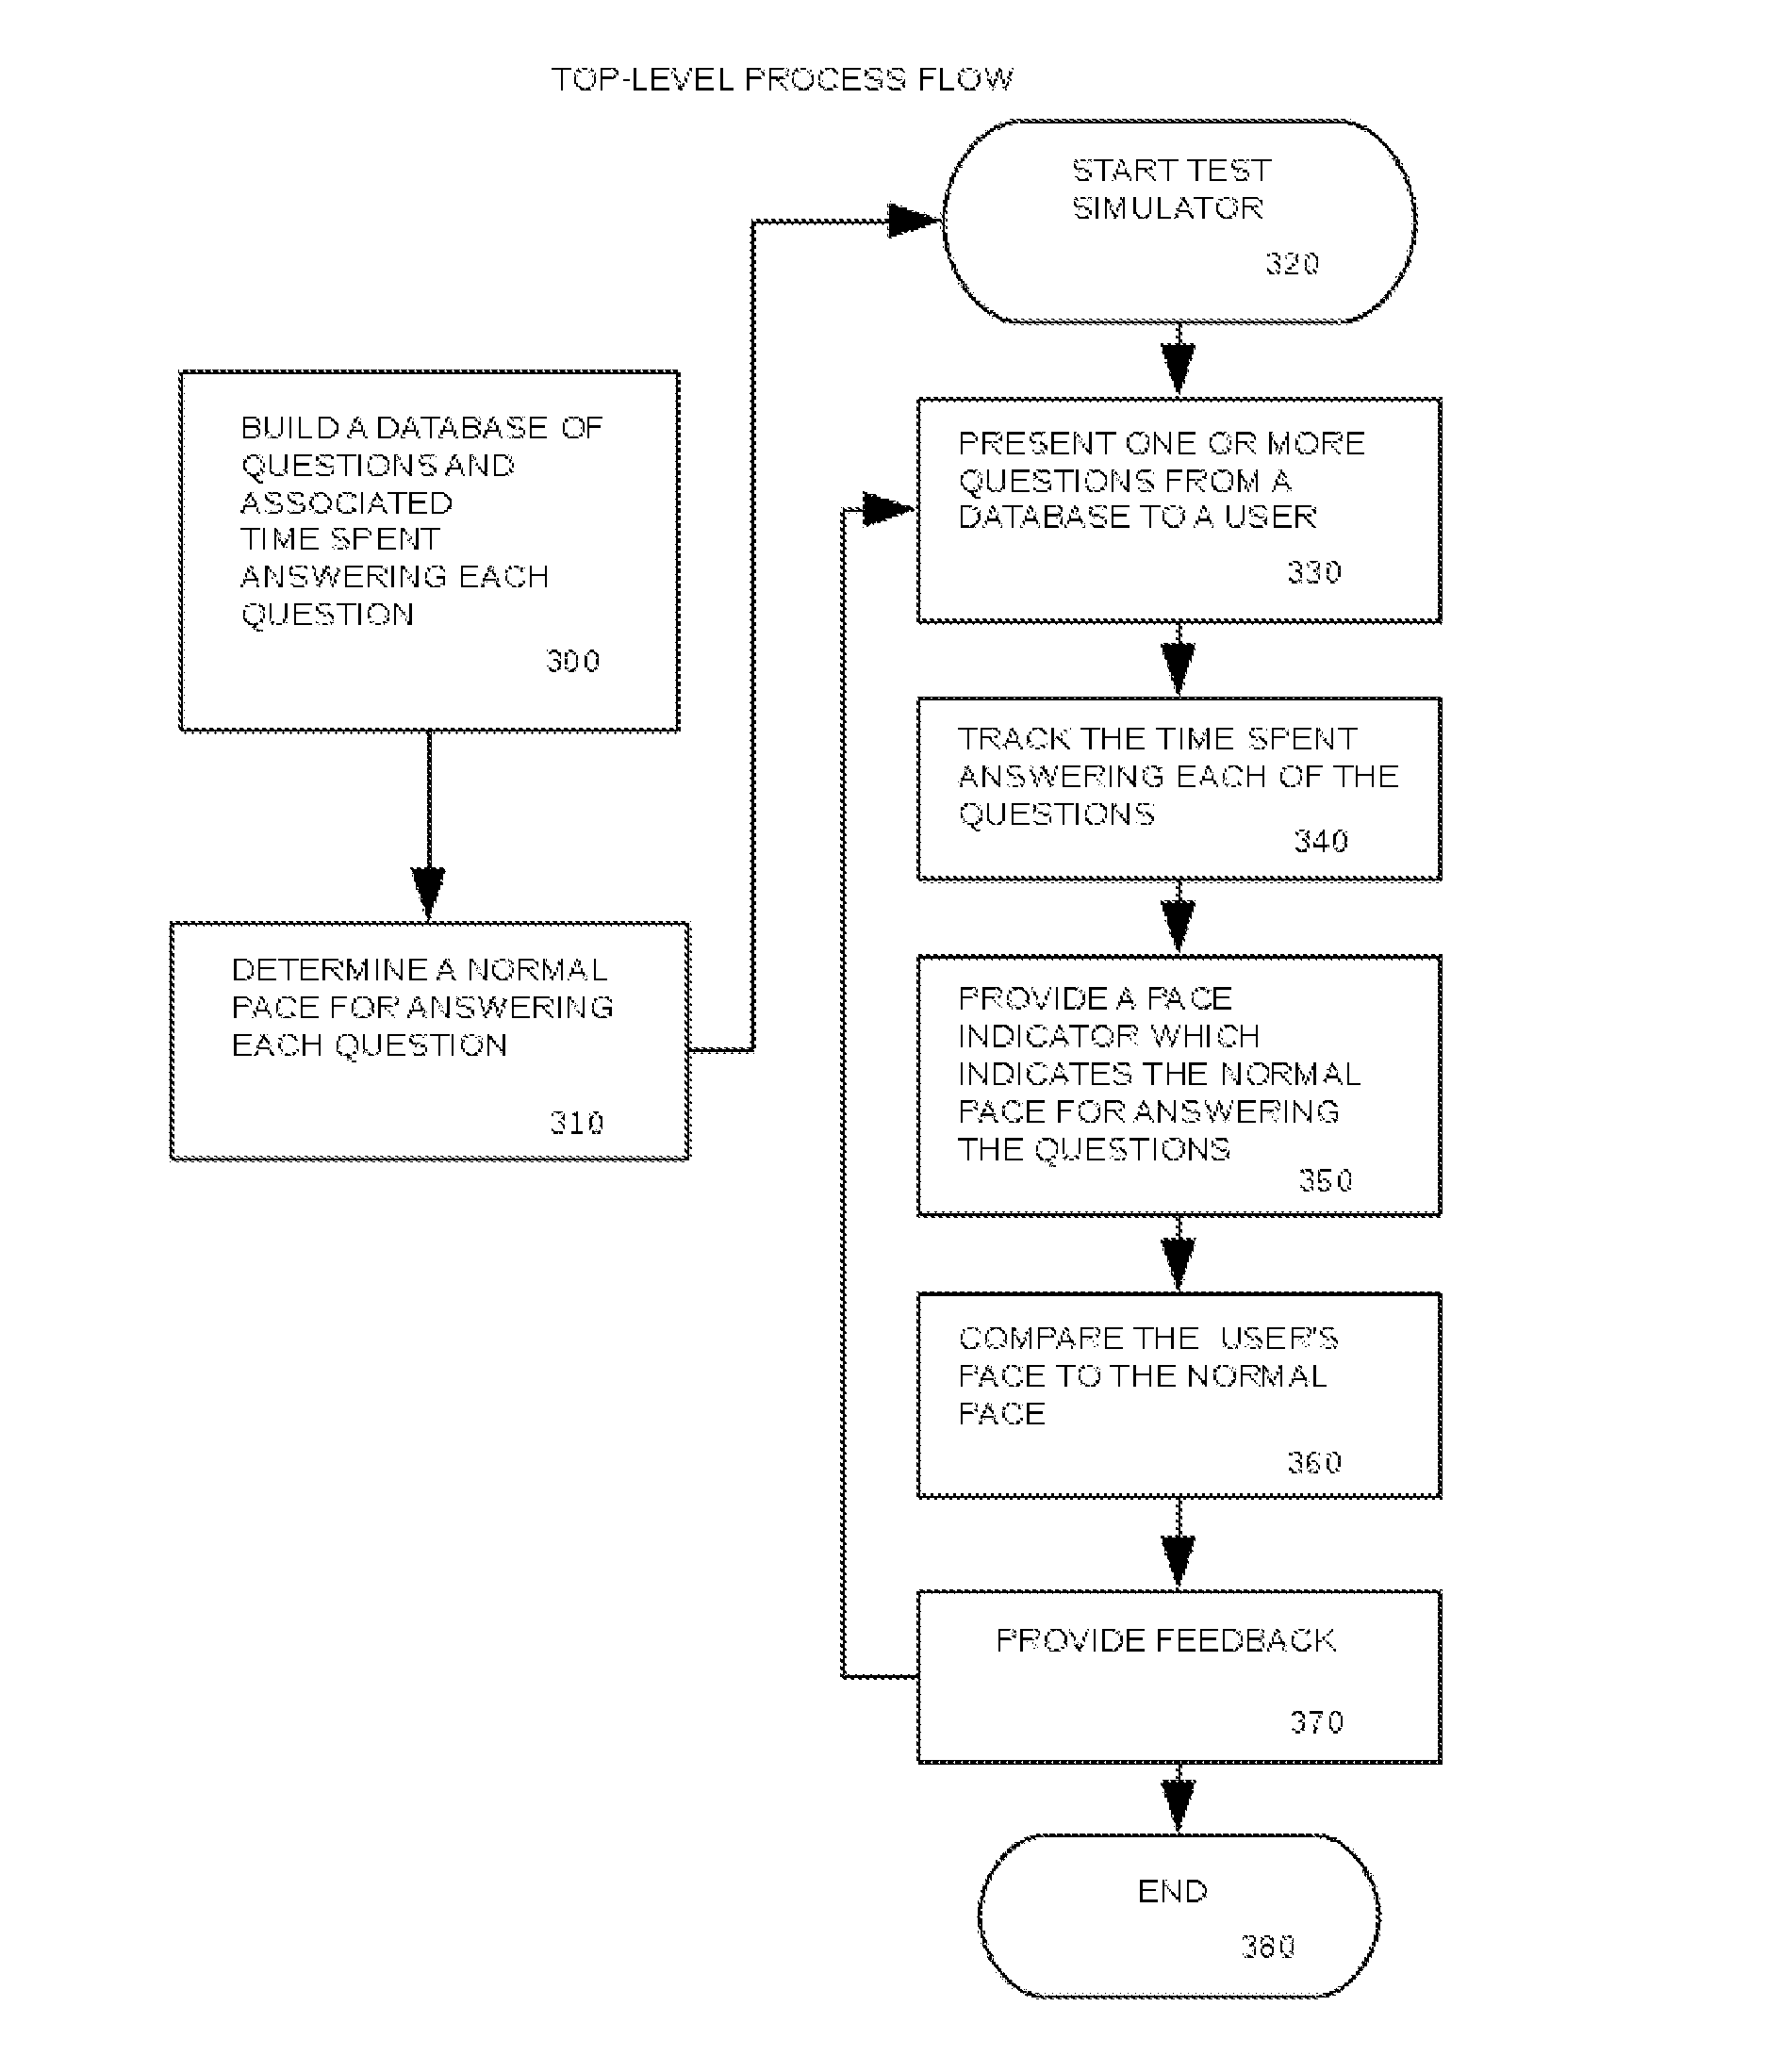
[0047]The present invention generally relates to exam question tutoring and pace setting. The invention provides a digital pace indicator that informs a test-taker of how their pace compares to a normal pace. In addition, the invention provides feedback to help a user improve their pace when answering questions.
[0048]The terms “user”, “test taker” and “student” shall be regarded as equivalent terms throughout this application.
[0049]Certain features described in the context of various embodiments are not to be considered essential features of those embodiments, unless the embodiment is inoperative without those elements.
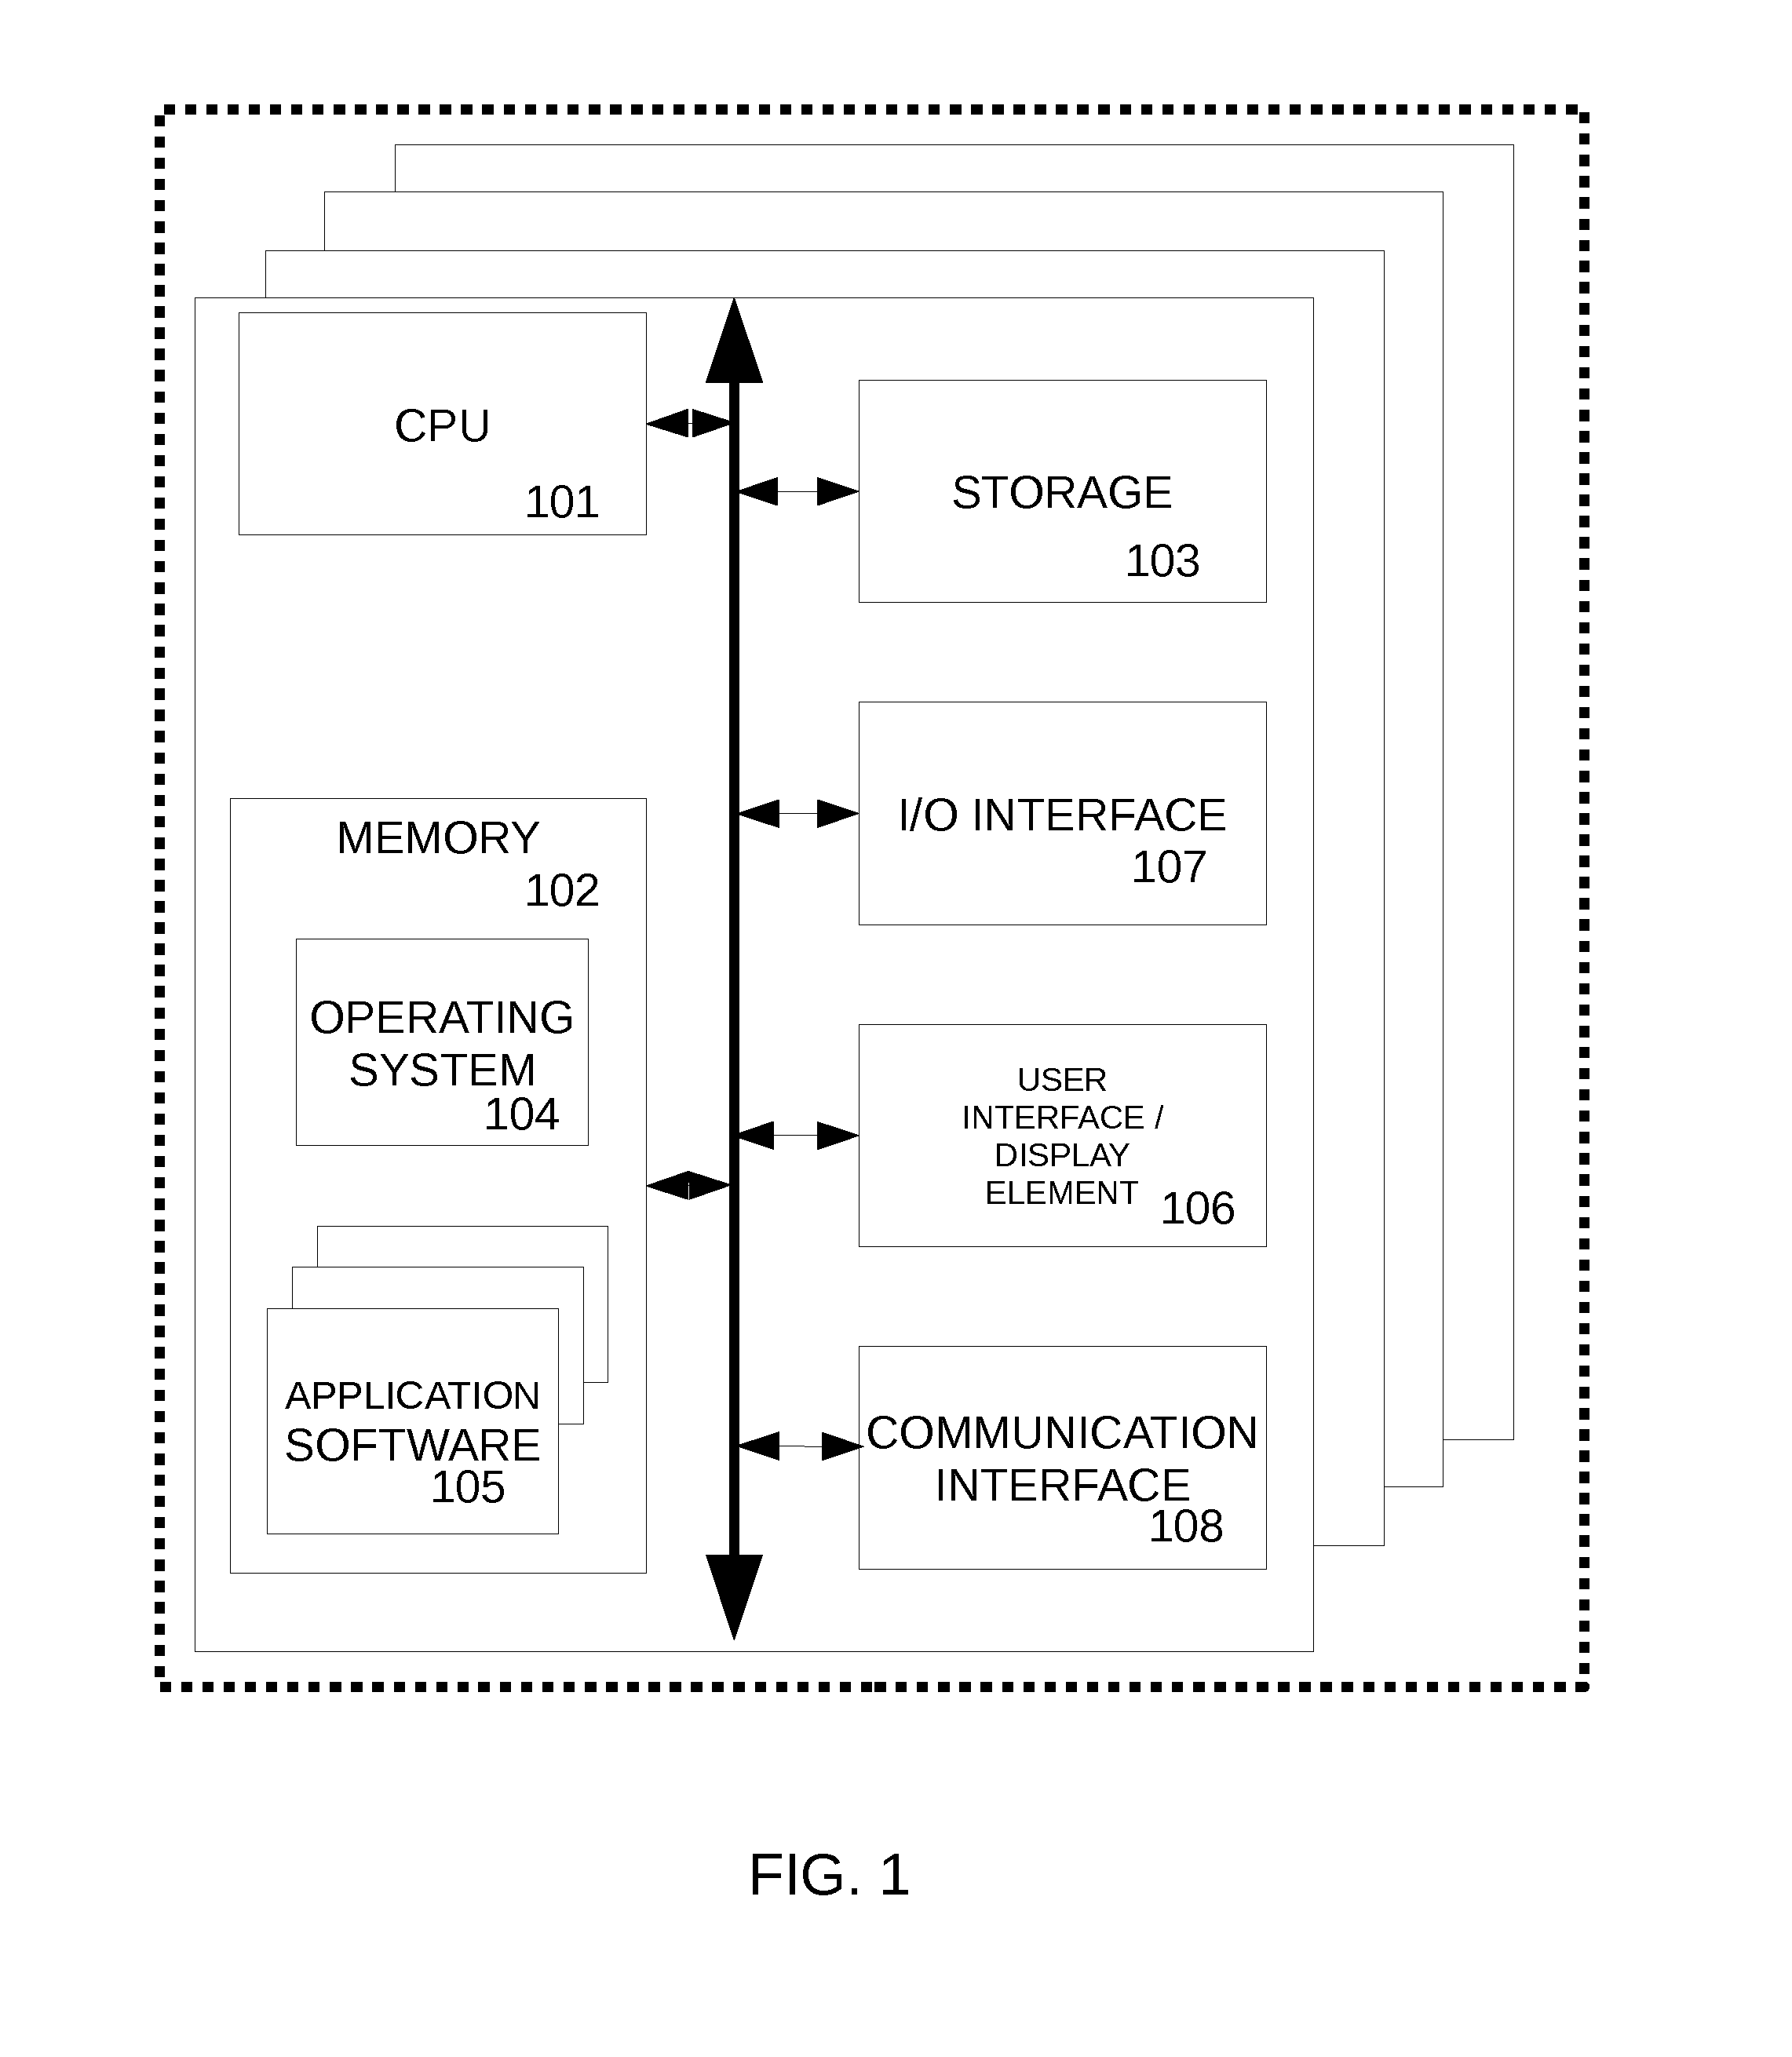
[0050]The invention can be implemented in numerous ways, including as a process; an apparatus; a system; a composition of matter; a computer program product embodied on a computer readable storage medium; and / or a processor, such as a processor configured to execute instructions stored on and / or provided by one or more memories coupled to one or more processors, where...
PUM
 Abstract
Description
Claims
Application Information