Visualization of network threat monitoring

a threat monitoring and visualization technology, applied in the field of computer network monitoring, can solve the problems of consuming all of the available bandwidth of the targeted network, affecting the service to the users of the network and its network devices, and affecting the damage caused by denial of service attacks

Active Publication Date: 2018-03-15
ARBOR NETWORKS
View PDF7 Cites 57 Cited by
  • Summary
  • Abstract
  • Description
  • Claims
  • Application Information

AI Technical Summary

Benefits of technology

[0010]In addition, in accordance with aspects of the disclosure, a non-transitory computer readable storage medium and one or more computer programs embedded therein are provided. The computer programs includes instructions, which when executed by a computer system, cause the computer system to receive traffic metric data indicating measurements related to a characteristic of network traffic flowing in a network, identify network threats in intercepted traffic of the network traffic, identify a time associated with detection of each occurrence of the network threats, and generate a g

Problems solved by technology

Due to growing problems associated with security threats to networks that exploit the Internet, network providers monitor for network threats while monitoring traffic flow.
For example, networks and network devices are increasingly affected by the damages caused by Denial of Service (“DoS”) attacks.
This attack may cause a loss of service to the users of the network

Method used


Image

  • Visualization of network threat monitoring
  • Visualization of network threat monitoring
  • Visualization of network threat monitoring

Examples


Embodiment Construction

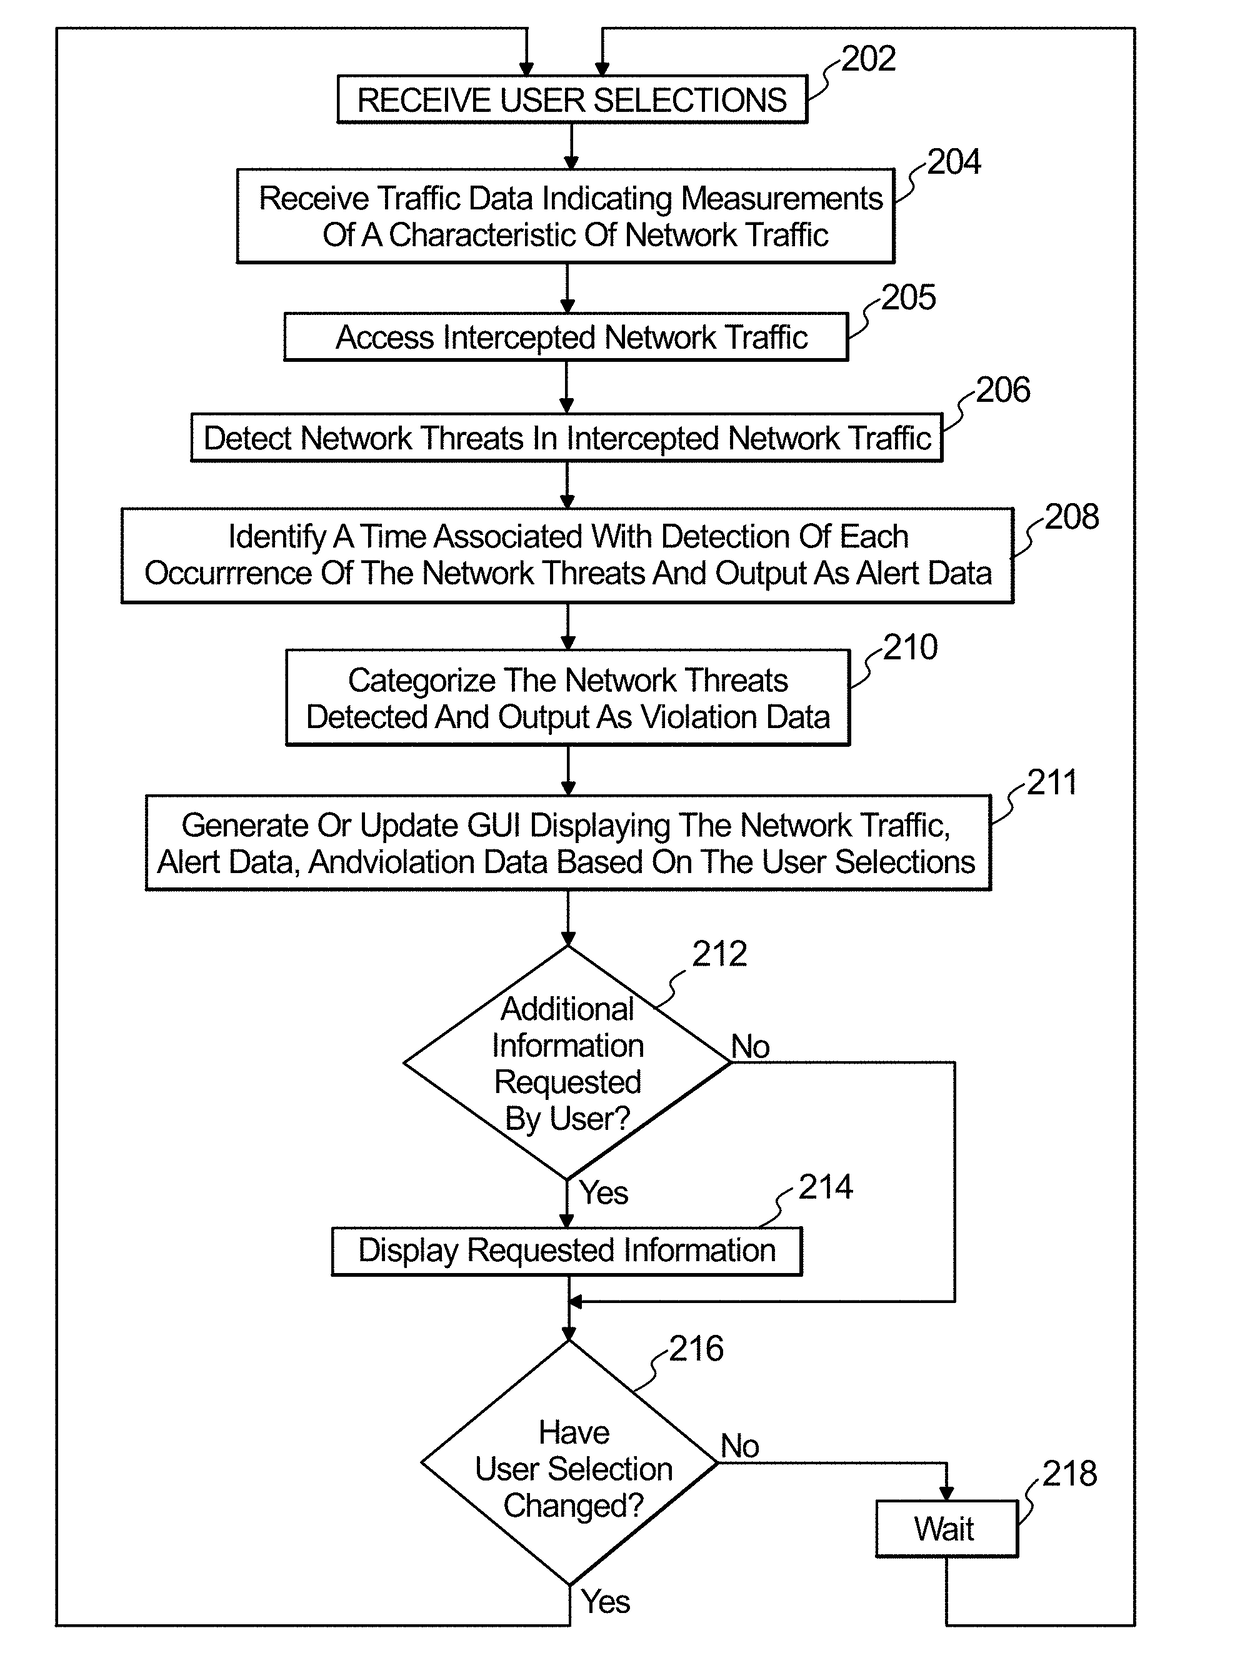
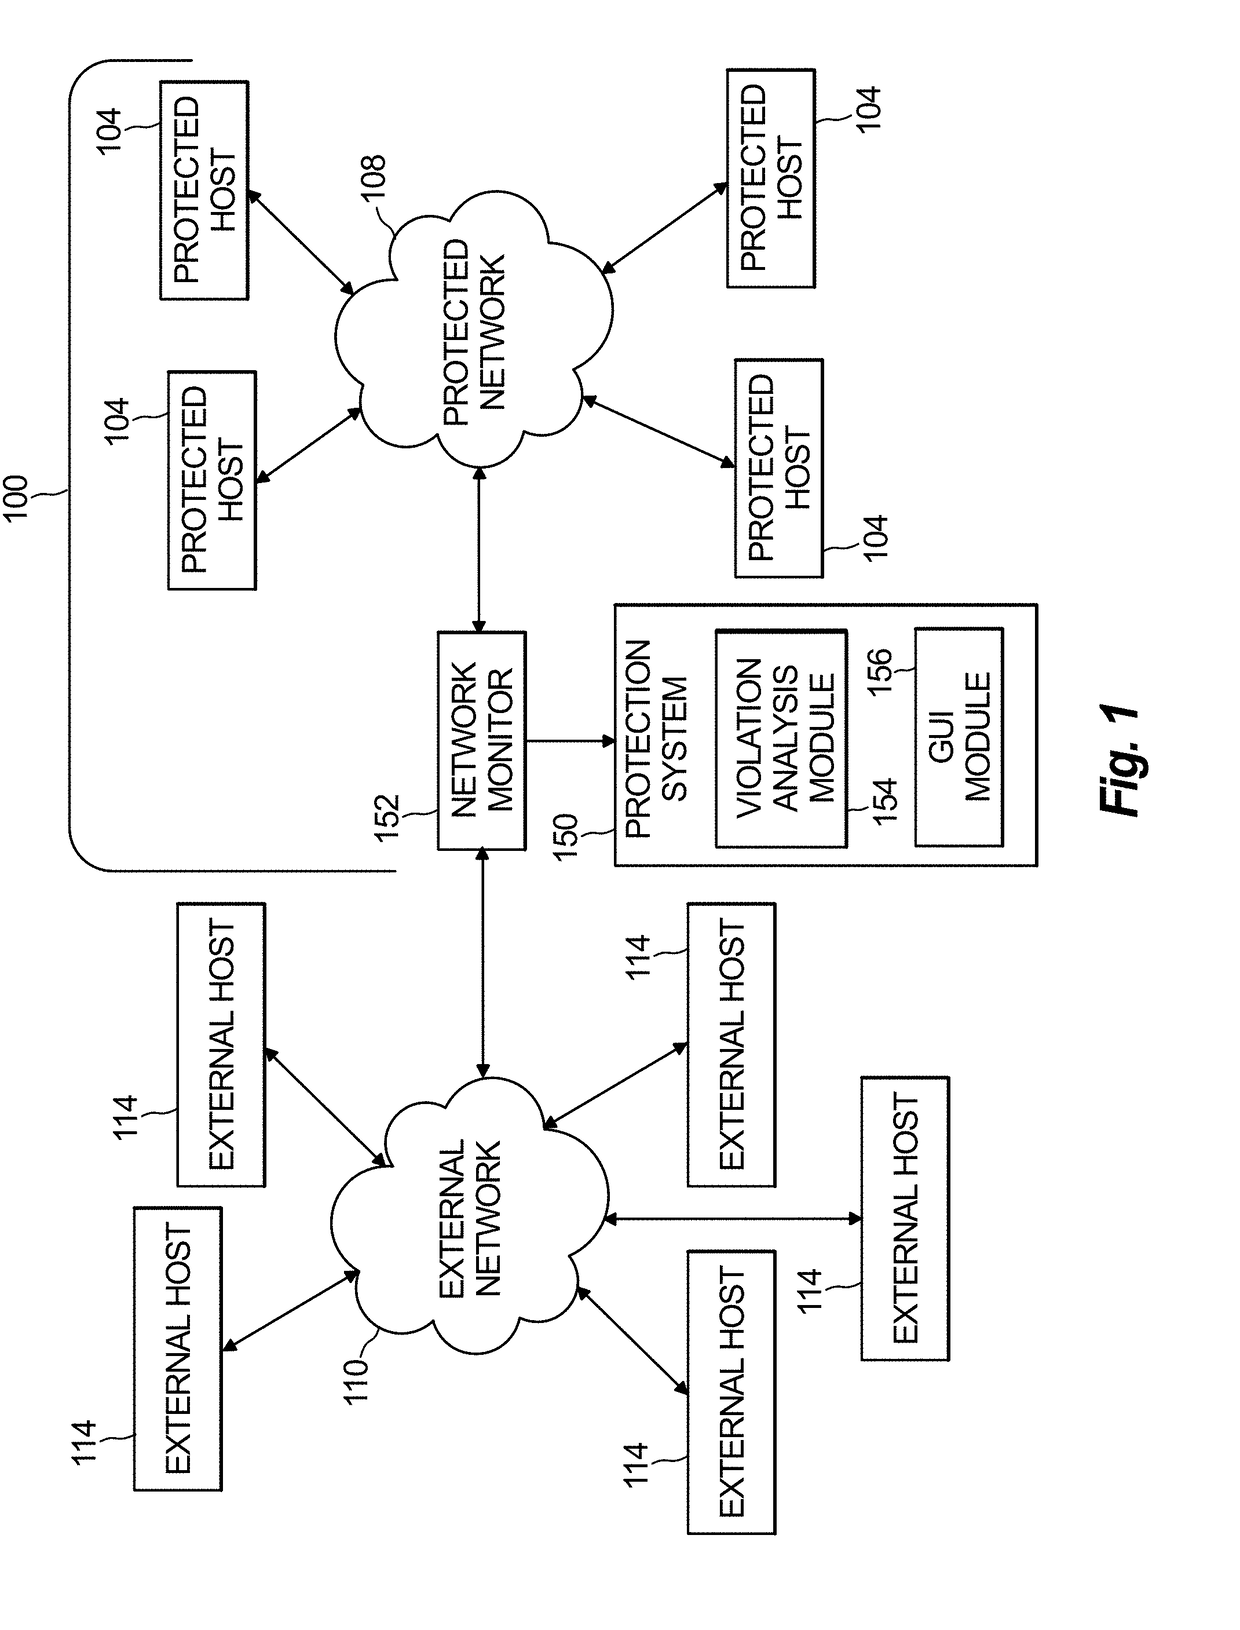
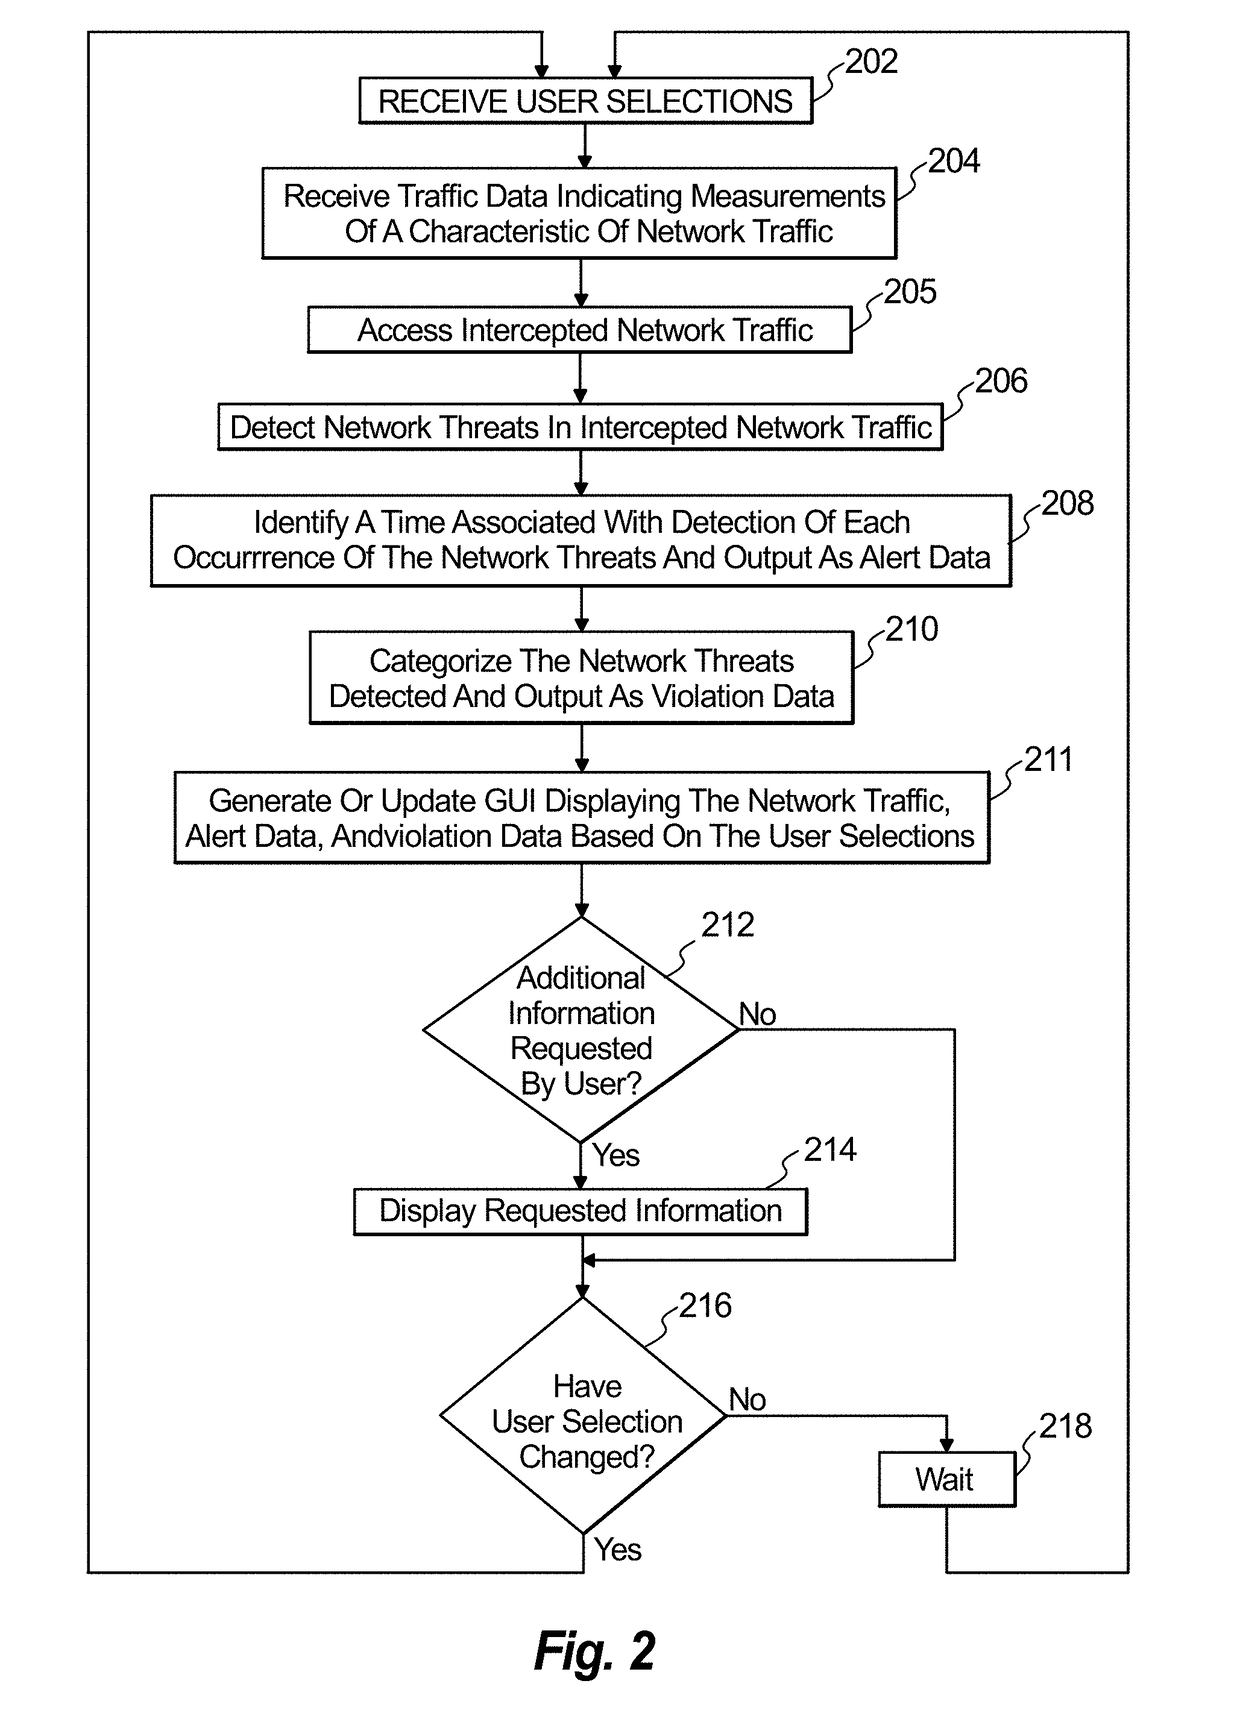
[0016]Reference will now be made to the drawings wherein like reference numerals identify similar structural features or aspects of the subject disclosure. For purposes of explanation and illustration, and not limitation, a block diagram of an exemplary embodiment of a protected network environment in accordance with the disclosure is shown in FIG. 1 and is designated generally by reference character 100. Other embodiments of the protected network environment 100 in accordance with the disclosure, or aspects thereof, are provided in FIGS. 2-6, as will be described.

[0017]Unless defined otherwise, all technical and scientific terms used herein have the same meaning as commonly understood by one of ordinary skill in the art to which this disclosure belongs. Although any methods and materials similar or equivalent to those described herein can also be used in the practice or testing of the present disclosure, exemplary methods and materials are now described.

[0018]It must be noted that ...


PUM


Abstract

A method to monitor a network is provided, including receiving traffic metric data indicating measurements related to a characteristic of network traffic flowing in the network and identifying network threats in intercepted traffic of the network traffic. The method further includes identifying a time associated with detection of each occurrence of the network threats and generating a graphical user interface having a GUI that includes a display of a time series graph that corresponds to a selected time period. The display includes a network traffic plot and an alert plot adjacent to the network traffic plot. The network traffic plot indicates a characteristic of network traffic relative to a timeline displayed along a first axis. The alert plot includes alert indicators, wherein each alert indicator is associated with detection of a network threat and aligned relative to the timeline based on the time identified for each occurrence of the detected network threats.

Description

FIELD OF THE INVENTION[0001]The present disclosure relates generally to computer network monitoring, and more specifically to visualization of monitoring of threats to a network.BACKGROUND OF THE INVENTION[0002]The Internet is a global public network of interconnected computer networks that utilize a standard set of communication and configuration protocols. It consists of many private, public, business, school, and government networks. Within each of the different networks are numerous host devices such as workstations, servers, cellular phones, portable computer devices, to name a few examples. These host devices are able to connect to devices within their own network or to other devices within different networks through communication devices such as hubs, switches, routers, and firewalls, to list a few examples.[0003]Due to growing problems associated with security threats to networks that exploit the Internet, network providers monitor for network threats while monitoring traffi...

Claims


Application Information

Patent Timeline
IPC IPC(8): H04L29/06G06F3/0482
CPCH04L63/1433G06F3/0485G06F3/0482H04L63/20H04L63/1408G06F21/577G06F21/604
Inventor DOPPKE, JEFFREYFIELDS, JOSHUA M.CASSELL, CHRISTOPHER C.
Owner ARBOR NETWORKS
Why Eureka
Try Eureka