
Method and system enabling photoplethysmograph measurement of volume status

Active Publication Date: 2018-05-17
SILVERMAN DAVID G
View PDF2 Cites 3 Cited by
  • Summary
  • Abstract
  • Description
  • Claims
  • Application Information

AI Technical Summary

Benefits of technology

The present invention provides a method for measuring volume status through photoplethysmograph (PPG) monitoring using a calizont reference method. This allows for noninvasive monitoring of both systemic and local status. The method also utilizes the relationship between changes in DC and AC to provide Frank-Starling relationships during volume loss and replacement. This provides valuable information for studying microcirculatory dynamics.

Problems solved by technology

Assessments of impact on blood volume by challenges ranging from local application of a vasoactive agent to systemic blood loss share a common problem—how to effectively monitor the impacts noninvasively.
Monitoring of local volume and flow has been thwarted by limitations.
Moreover, none of the noninvasive techniques distinguishes arterial and venous volume; thus, they cannot fully characterize local physiologic impact and its relationship to arterial and venous components of the systemic circulation.
Monitoring of systemic volume likewise has been challenging, prompting a search for alternatives to invasive (and not consistently reliable) central venous and pulmonary artery pressure monitoring.
When available, echocardiography often provides the gold standard, but preload measurements have been inconsistent and stroke volume measurements during lower body negative pressure (LBNP), a model of simulated blood loss, are disturbed by vacuum-induced changes in chest alignment; likewise for measures of thoracic impedance.
Although increases in ventilation-induced variations in intra-arterial and intra-venous waveforms can identify hypovolemia, they do not quantify volume status and the effectiveness of such monitoring is limited in the absence of positive pressure ventilation.
However, changes in arterial and venous volume have not been effectively distinguished and compared.
However, and as noted above, these only provide relative assessments (i.e., they neither measure nor estimate actual volume), and they are confounded by rate, depth and pattern of respiration.
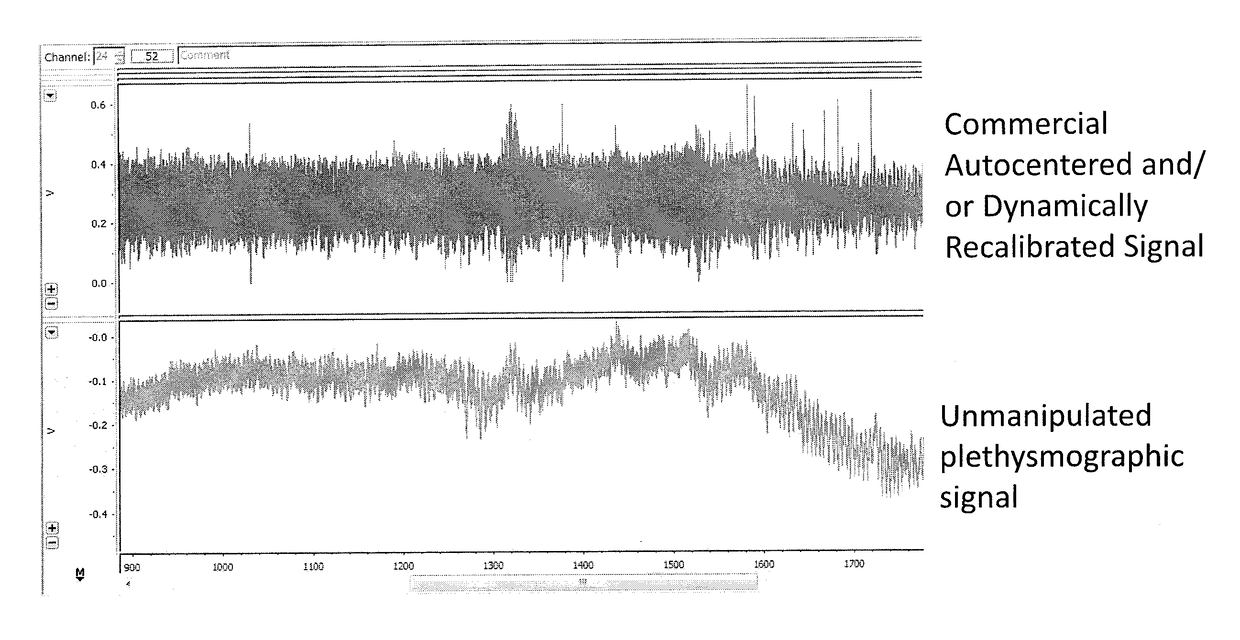
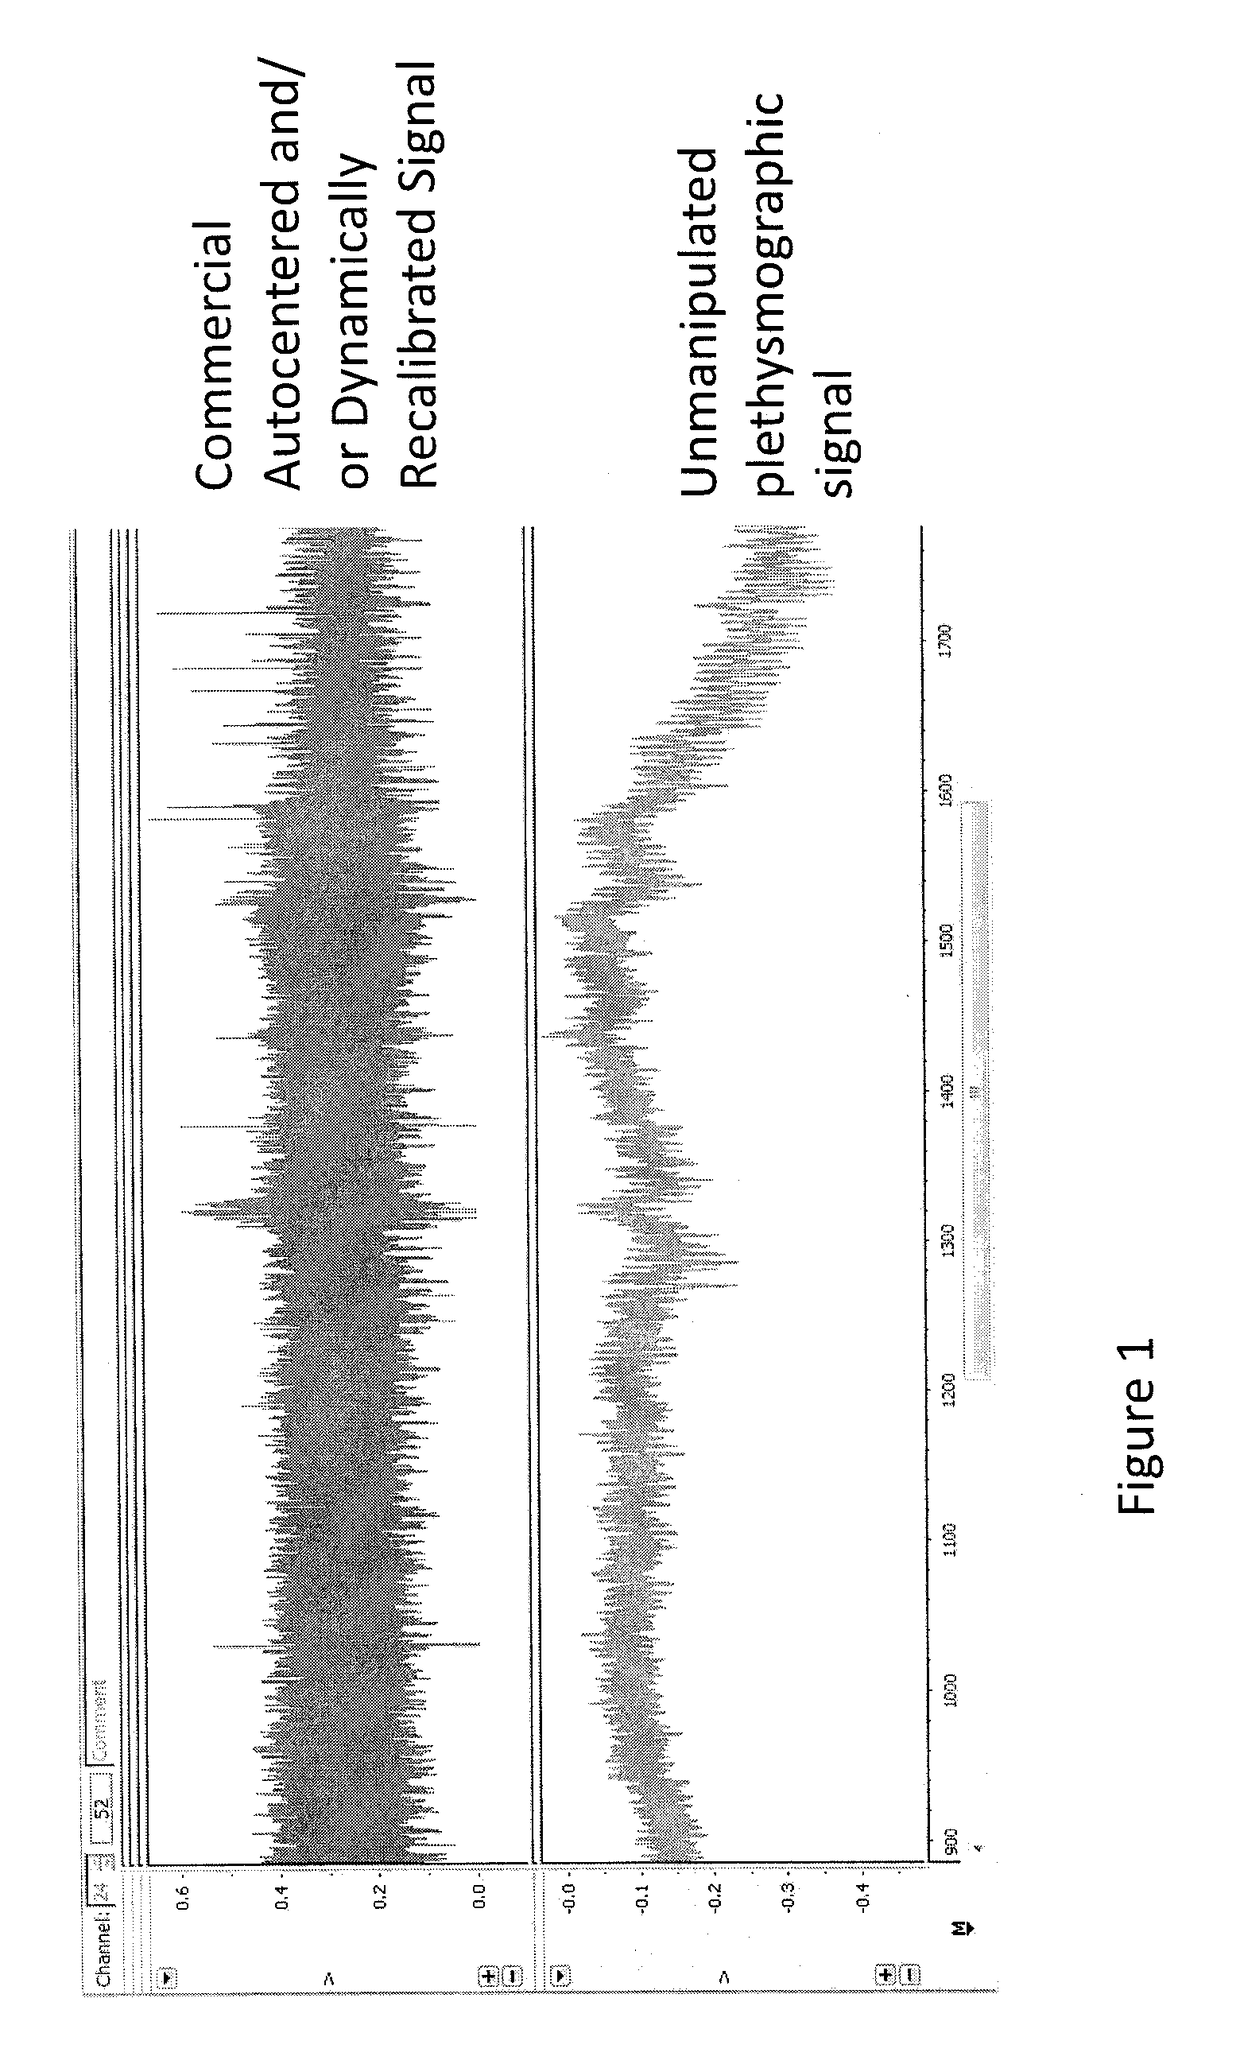
A major limitation to the use of the photoplethysmograph for these purposes is that commercial devices (e.g., for clinical monitoring) have autocentering and / or dynamic recalibrating algorithms that minimize changes in voltages caused by what I believe to be important physiologic changes.

Method used


Image

  • Method and system enabling photoplethysmograph measurement of volume status
  • Method and system enabling photoplethysmograph measurement of volume status
  • Method and system enabling photoplethysmograph measurement of volume status

Examples


Embodiment Construction

[0086]The detailed embodiments of the present invention are disclosed herein. It should be understood, however, that the disclosed embodiments are merely exemplary of the invention, which may be embodied in various forms. Therefore, the details disclosed herein are not to be interpreted as limiting, but merely as a basis for teaching one skilled in the art how to make and / or use the invention.

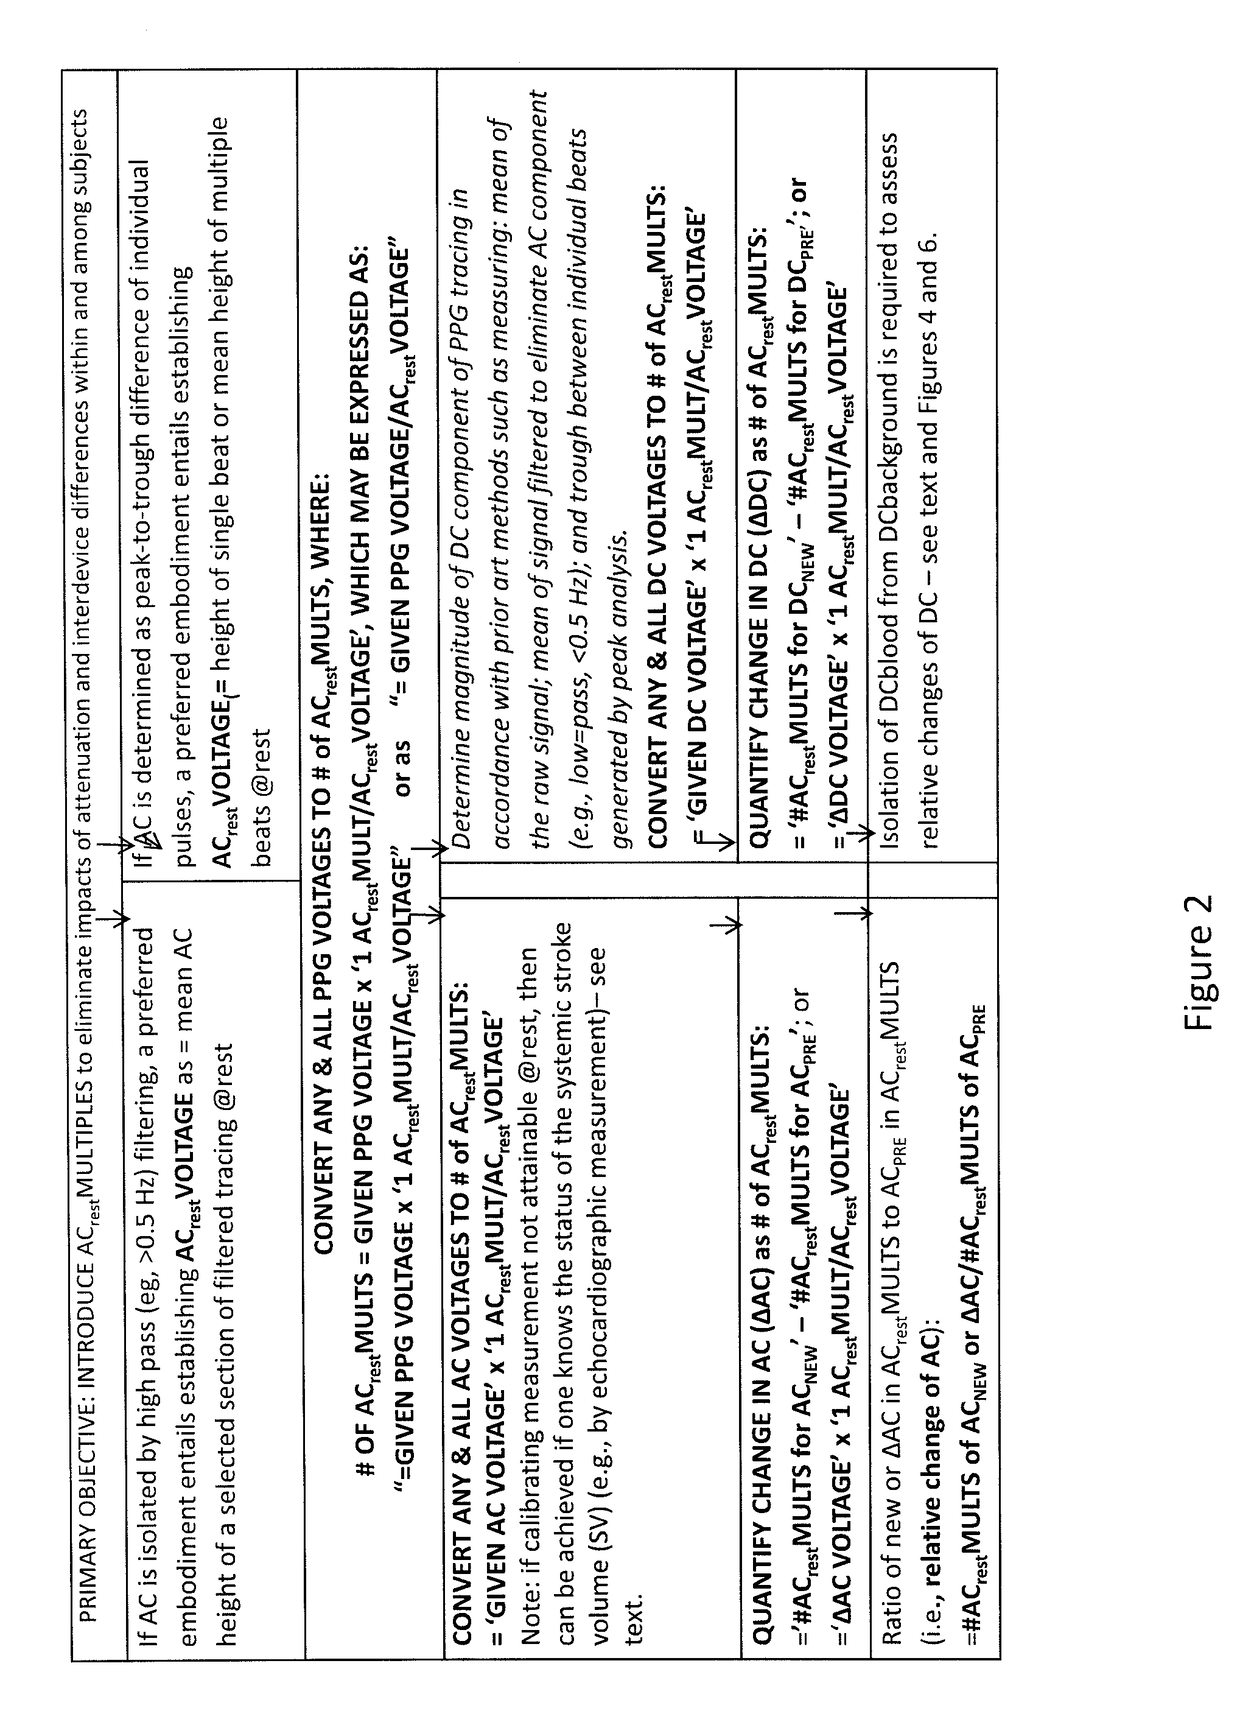
[0087]With reference to the accompanying figures, a system and method enabling photoplethysmograph monitoring and measurement of volume status by establishing the “AC Calibration Voltage,” which is the measured voltage generated by the small portion of a cardiac stroke volume delivered to a given photoplethysmograph at a given site in a given subject at the time of calibration, of a given photoplethysmograph at a given site under resting conditions so as to convert all voltages (photoplethysmographic (PPG) signal and its AC and DC components) to herein introduce “AC Multiples” of the AC Calibra...


PUM


Abstract

A method enables photoplethysmograph measurement of volume status. The method includes the steps of converting photoplethysmograph voltages to volume measurements and characterizing a local microcirculation as a microcosm in a manner allowing a photoplethysmograph to facilitate noninvasive monitoring of systemic status.

Description

CROSS REFERENCE TO RELATED APPLICATIONS[0001]This application is a continuation in part of U.S. patent application Ser. No. 14 / 511,306, filed Oct. 10, 2014, entitled “METHOD AND SYSTEM ENABLING PHOTOPLETHYSMOGRAPH MEASUREMENT OF VOLUME STATUS,” which is currently pending, which is a continuation-in-part of U.S. patent application Ser. No. 14 / 460,082, filed Aug. 14, 2014, entitled “METHOD AND SYSTEM ENABLING PHOTOPLETHYSMOGRAPH MEASUREMENT OF VOLUME STATUS,” which is now abandoned, which claims the benefit of U.S. Provisional Application Ser. No. 61 / 865,746, filed Aug. 14, 2013, entitled “CONVERTING PHOTOPLETHYSMOGRAPHIC VOLTAGE TO A VOLUME MEASUREMENT: UNIQUE APPLICATION OF THE AC COMPONENT TO NORMALIZE FOR SIGNAL ATTENUATION WITHIN AND AMONG SUBJECTS,” U.S. Provisional Application Ser. No. 61 / 889,780, filed Oct. 11, 2013, entitled “CONVERTING PHOTOPLETHYSMOGRAPHIC (PPG) VOLTAGE TO A VOLUME MEASUREMENT: UNIQUE APPLICATION OF THE AC COMPONENT TO NORMALIZE FOR SIGNAL ATTENUATION, ESTA...

Claims


Application Information

Patent Timeline
IPC IPC(8): A61B5/0295A61B5/029A61B5/02A61B5/00
CPCA61B5/0295A61B5/029A61B5/02007A61B5/6815A61B5/0261A61B5/725A61B5/7253A61B5/7282
Inventor SILVERMAN, DAVID G.
Owner SILVERMAN DAVID G
Learn More