
Optimized Selection of Demand Forecast Parameters

a demand forecast and parameter technology, applied in the computer system field, can solve the problems of increased costs associated with holding inventories, lost revenues, and sales forecast systems encountering problems in producing

Pending Publication Date: 2020-04-02
ORACLE INT CORP
View PDF3 Cites 7 Cited by
  • Summary
  • Abstract
  • Description
  • Claims
  • Application Information

AI Technical Summary

Benefits of technology

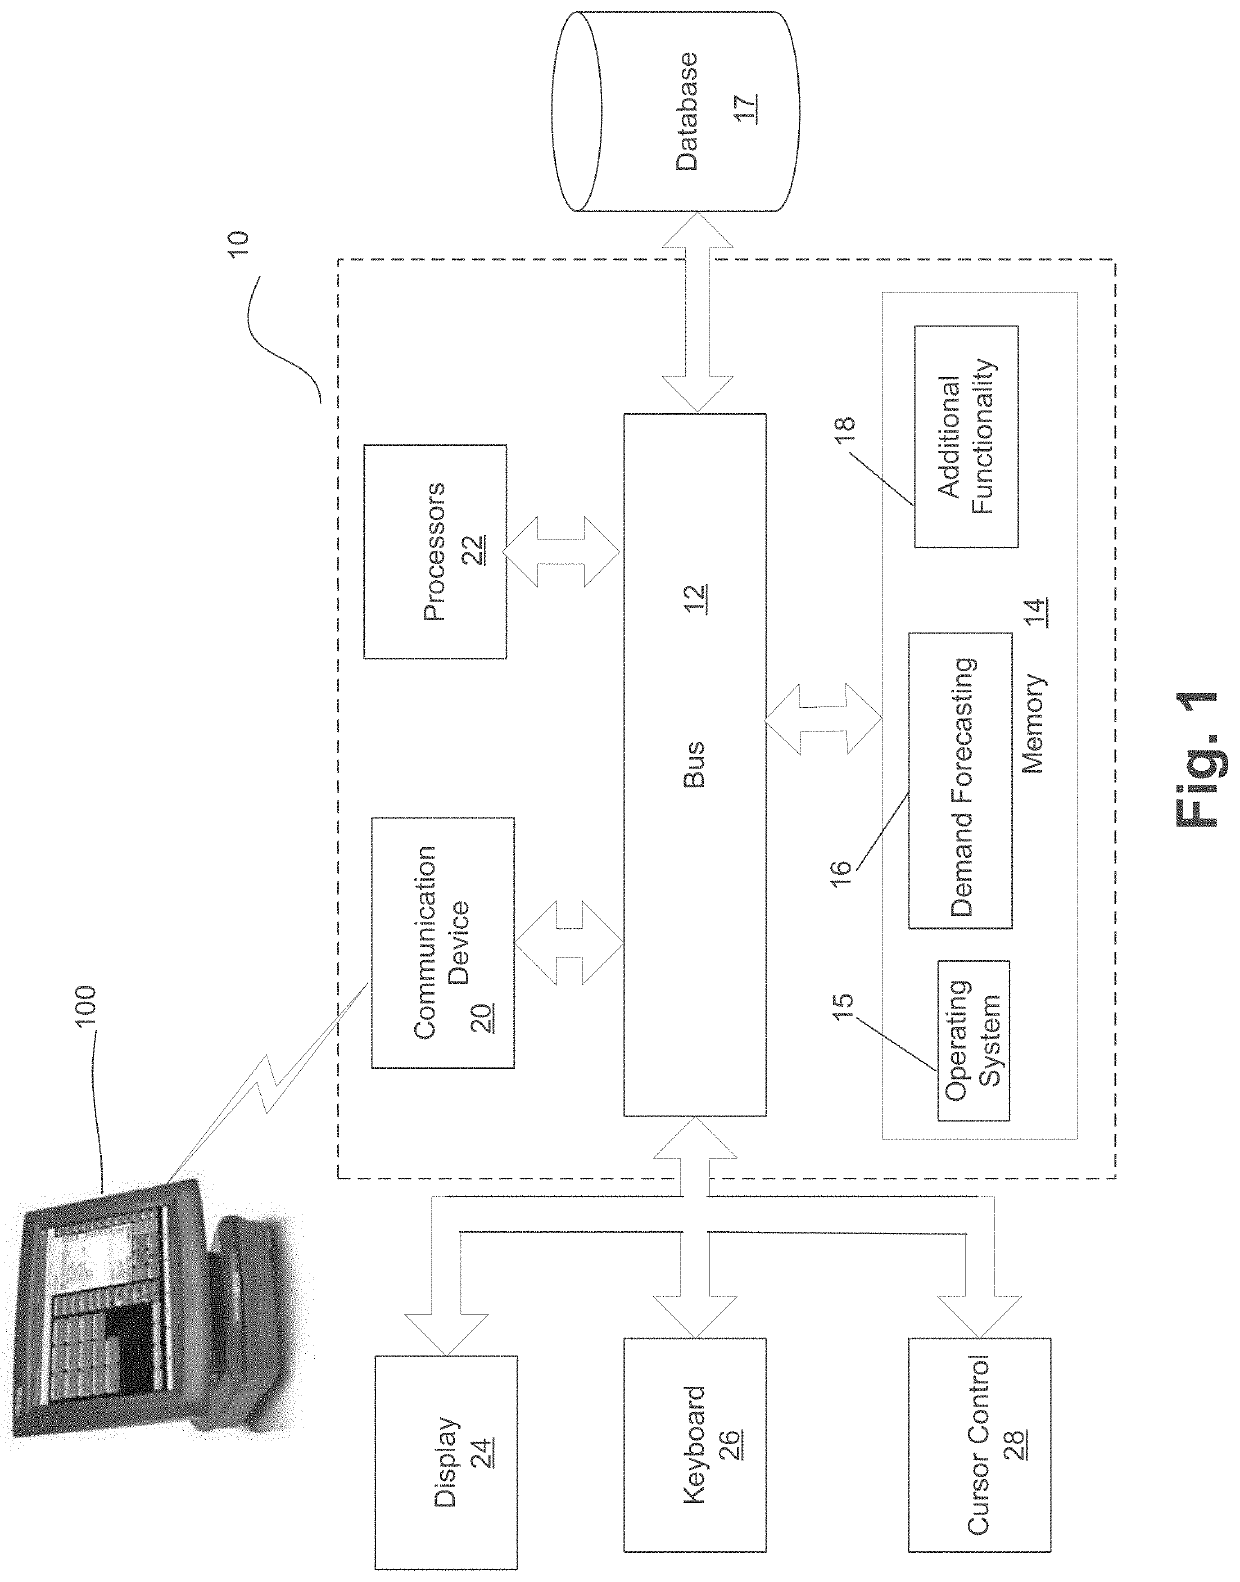
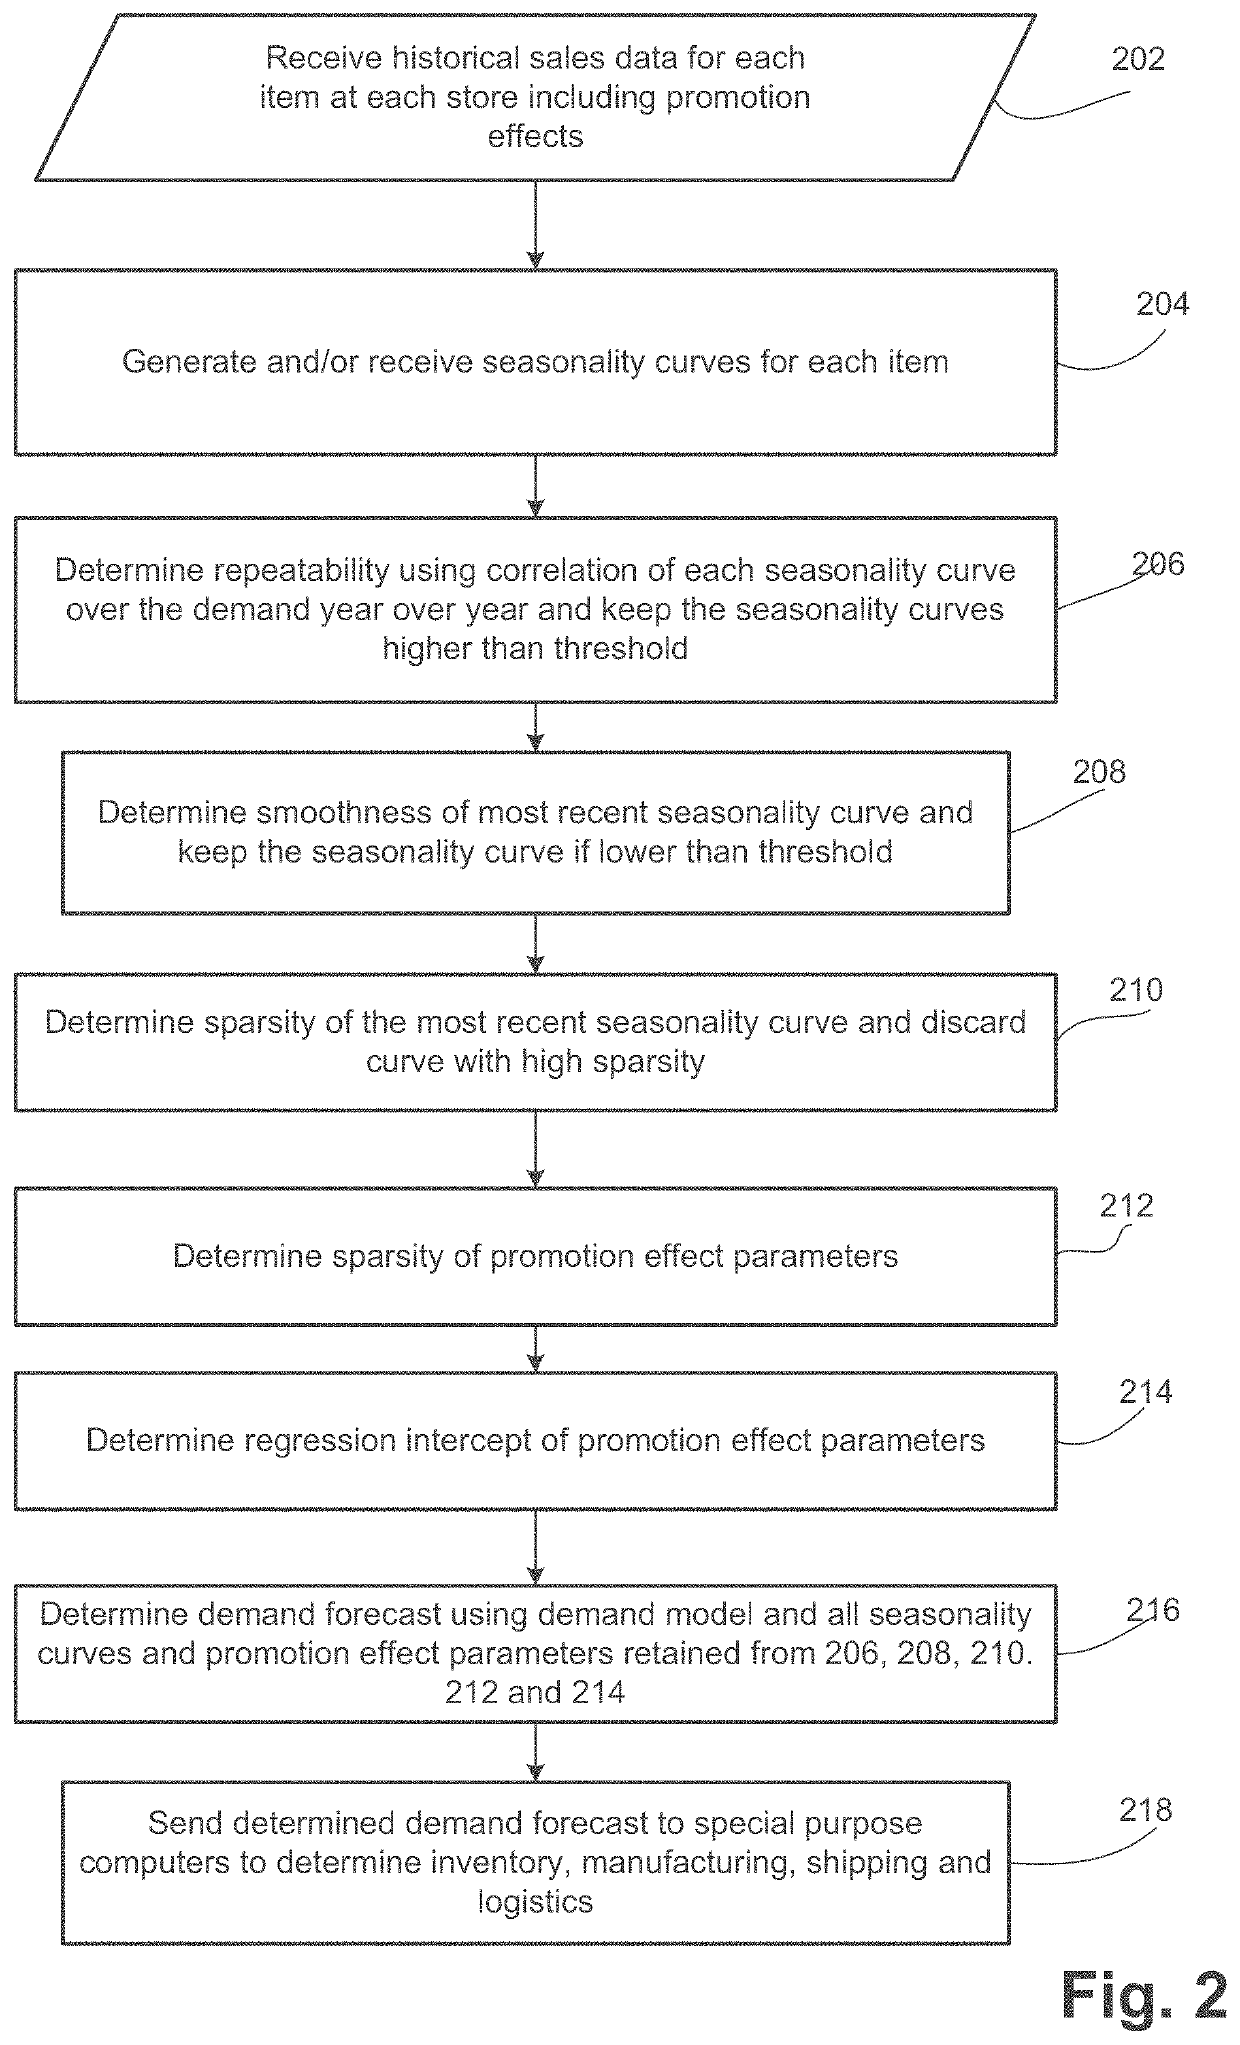
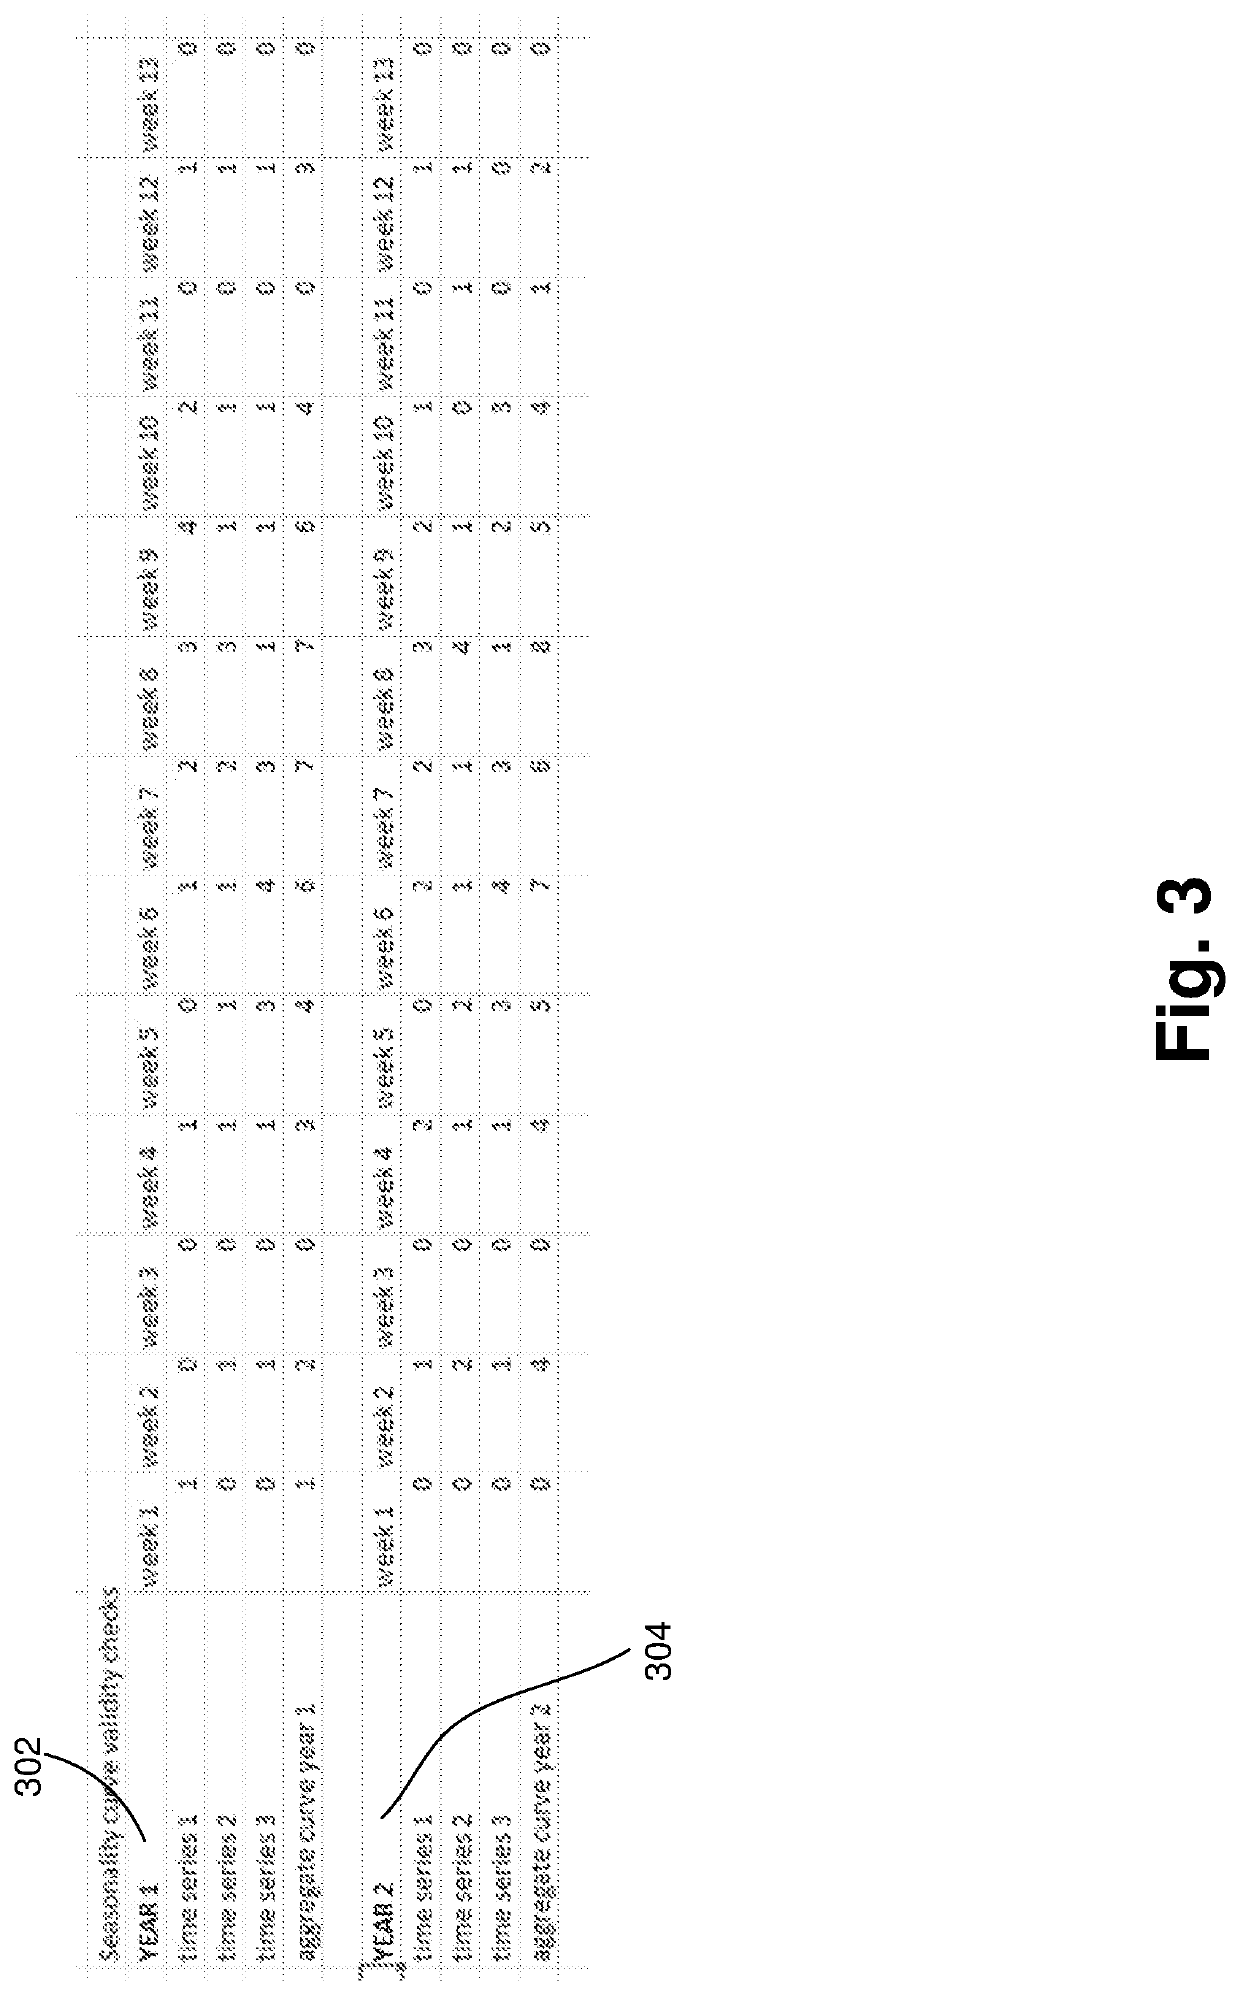
The patent describes a system for predicting demand for a specific item and using that information to make decisions about when to ship additional inventory to retail stores. The system uses historical sales data and seasonality curves to determine the correlation between demand and sales, and selects the best curve to use for predicting future sales. This results in a more accurate demand forecast, which can help improve inventory management and reduce waste.

Problems solved by technology

Overestimating the demand can result in overproduction and increased costs associated with holding inventories (e.g., storage costs, obsolescence, etc.).
Underestimating the demand, on the other hand, can result in lost revenues.
In general, sales forecast systems encounter problems in producing a week-by-week forecast of sales units for retail items.
However, as noted above, several demand variables affect the sales of retail items.
Further, the quality of a sales forecast is very dependent on the quality of the input data (i.e., garbage in, garbage out).
In many situations, the historical data necessary and available for sales forecasting is less than adequate, and the resulting forecasts can do more harm than good.
Less sophisticated solutions do not catch the bad numbers, which can result in over / understock, wrong allocations, bad plans, etc.

Method used


Image

  • Optimized Selection of Demand Forecast Parameters
  • Optimized Selection of Demand Forecast Parameters
  • Optimized Selection of Demand Forecast Parameters

Examples


Embodiment Construction

[0020]Embodiments automatically determine problematic demand forecast model parameters and then remove the problematic parameters from the demand forecast and replace with reliable parameters. Of those reliable parameters, embodiments automatically select the best of the parameters. As a result, the demand forecast is optimized and more accurate.

[0021]Sales demand forecasting methods can roughly be grouped into judgmental, extrapolation, and causal methods. Extrapolation methods use only the time series data of the activity itself to generate the forecast. Known particular techniques range from the simpler moving averages and exponential smoothing methods to the more complicated Box-Jenkins approach. While these known methods identify and extrapolate time series patterns of trend, seasonality and autocorrelation successfully, they do not take external factors such as price changes and promotion into account.

[0022]Vector Auto Regression (“VAR”) models extend the Box-Jenkins methods t...


PUM


Abstract

Embodiments select demand forecast parameters for a demand model for a first item. Embodiments receive historical sales data for a plurality of items on a per store basis and receive a plurality of seasonality curves for the first item of the plurality of items, each seasonality curve corresponding to a different pooling level for the first item. Embodiments determine a correlation for each of the seasonality curves at each pooling level and determine a root mean squared error (“RMSE”) for each determined correlation. Embodiments determine a score for each pooling level, the score based on the corresponding correlation, RMSE and a penalty and select one of the seasonality curves based on the determined scores. Embodiments use the demand model and the selected seasonality curve to determine a demand forecast for the first item, the demand forecast including a prediction of future sales data for the first item.

Description

FIELD[0001]One embodiment is directed generally to a computer system, and in particular to a computer system that forecasts demand for retail items.BACKGROUND INFORMATION[0002]Products are typically delivered to consumers through a network of manufacturers, distributors, transporters, retailers, etc. Such a network of facilities that together deliver products to consumers is commonly referred to as a “supply chain” network[0003]Suppliers of products (e.g., manufactures, vendors, retailers, etc.) often face the task of forecasting the demand for the products in order to provide a smooth and efficient flow of the products through the supply chain network in the presence of constantly-changing market conditions. Overestimating the demand can result in overproduction and increased costs associated with holding inventories (e.g., storage costs, obsolescence, etc.). Underestimating the demand, on the other hand, can result in lost revenues.[0004]Further, in the retail industry, retailers ...

Claims


Application Information

Patent Timeline
Patent Type & Authority Applications(United States)
IPC IPC(8): G06Q10/06G06Q30/02
CPCG06Q30/0202G06Q10/06315
Inventor POPESCU, CATALINLEI, MINGHE, LIN
Owner ORACLE INT CORP
Learn More