System for Automatically Generating Insights by Analysing Telemetric Data

Pending Publication Date: 2022-09-15
VUNET SYST PTE LTD
View PDF0 Cites 0 Cited by
  • Summary
  • Abstract
  • Description
  • Claims
  • Application Information

AI Technical Summary

Benefits of technology

The patent text describes a server system that can anticipate and flag any potential problems or surges in activity. This allows information technology personnel to prepare for and handle these issues in advance, while management can plan and take appropriate actions. Overall, this system enables timely and effective response to new challenges, improving operational efficiency and management effectiveness.

Problems solved by technology

With backend server systems getting complex and user volume rising, the information technology (IT) services are getting more complex than ever.
This has led to upsurge in task-load of the IT team monitoring the backend server systems and trying to counter the challenges faced.
But the telemetric data of the IT systems is voluminous and difficult to keep track for timely actionable counter-measures for probable service disruptions.
Furthermore, with the increasing shift of services dependency on digital platforms, the load on the backend server systems handling myriad processes has also risen.

Method used


Image

  • System for Automatically Generating Insights by Analysing Telemetric Data
  • System for Automatically Generating Insights by Analysing Telemetric Data
  • System for Automatically Generating Insights by Analysing Telemetric Data

Examples


first embodiment

[0087]FIGS. 6A-6E exemplarily illustrates an output dashboard displayed on a user device, for example, a desktop. FIG. 6A shows a sample dashboard of ‘Digital Payment: Online Banking’. The tile 601 of the dashboard 600 illustrates performance-index based visualizations, as exemplarily illustrated in FIG. 6B. Digital transactions are handled servers, whose health needs monitoring. User-experience index (UEI) and overall performance index (OPI) are the scoring mechanisms used to determine the health of the servers. On the left of the tile 601, meter gauges 605 depict the present value of the UEI and OPI. On the right of the tile 601, time history for the past 7 days of UEI and OPI is displayed. The second tile 602 of the dashboard 600, contains examples of proactive insights and predictive insights, as exemplarily illustrated in FIG. 6C. Foretelling of anticipated events and projection of possible metric behavior with good confidence levels is possible with the system 100 owing to an ...

second embodiment

[0089]FIG. 7 exemplarily illustrates an output dashboard displayed on a user device, for example, a mobile, a smartphone, etc. FIG. 7 shows a sample dashboard of network surveillance system and associated server health monitoring components displayed on the user device, for example, a smartphone. The home screen of the mobile application dashboard 701 is shown in FIG. 7. The title 702 with customer name, for example, ‘Mobile XYZ Home’, is positioned on the top of the mobile application dashboard 701, followed by a search bar 703 beneath. The mobile application dashboard 701 comprises a couple of statistical tiles 704 presenting the count of the total number of devices (being Up or Down), followed by network components and cameras. The statistical tiles 704 provide analytics stats of the network Surveillance system. The mobile application dashboard 701 comprises a selected metric tile 705 for ‘network’ components which have ‘up’ status along with a text insight, for example, a pop-up...


PUM


Abstract

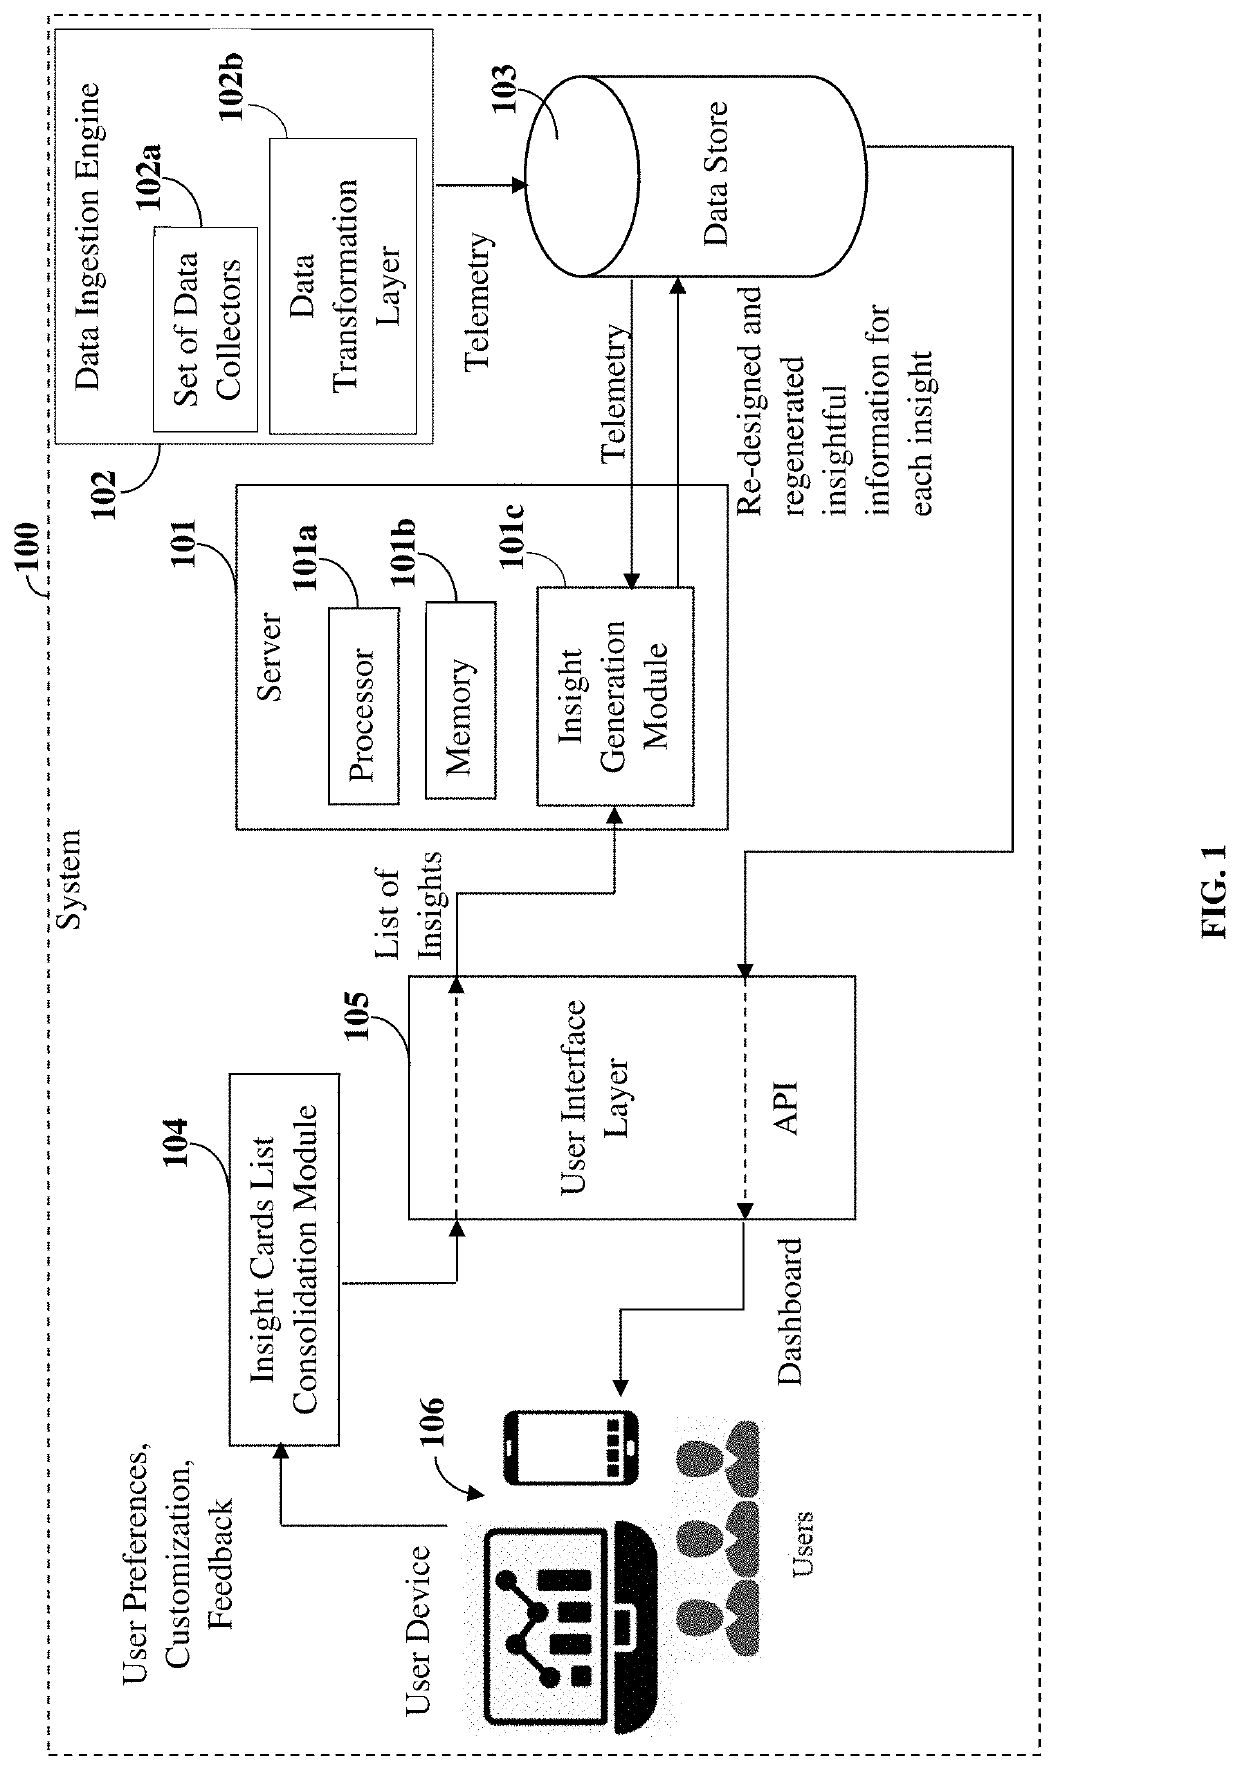
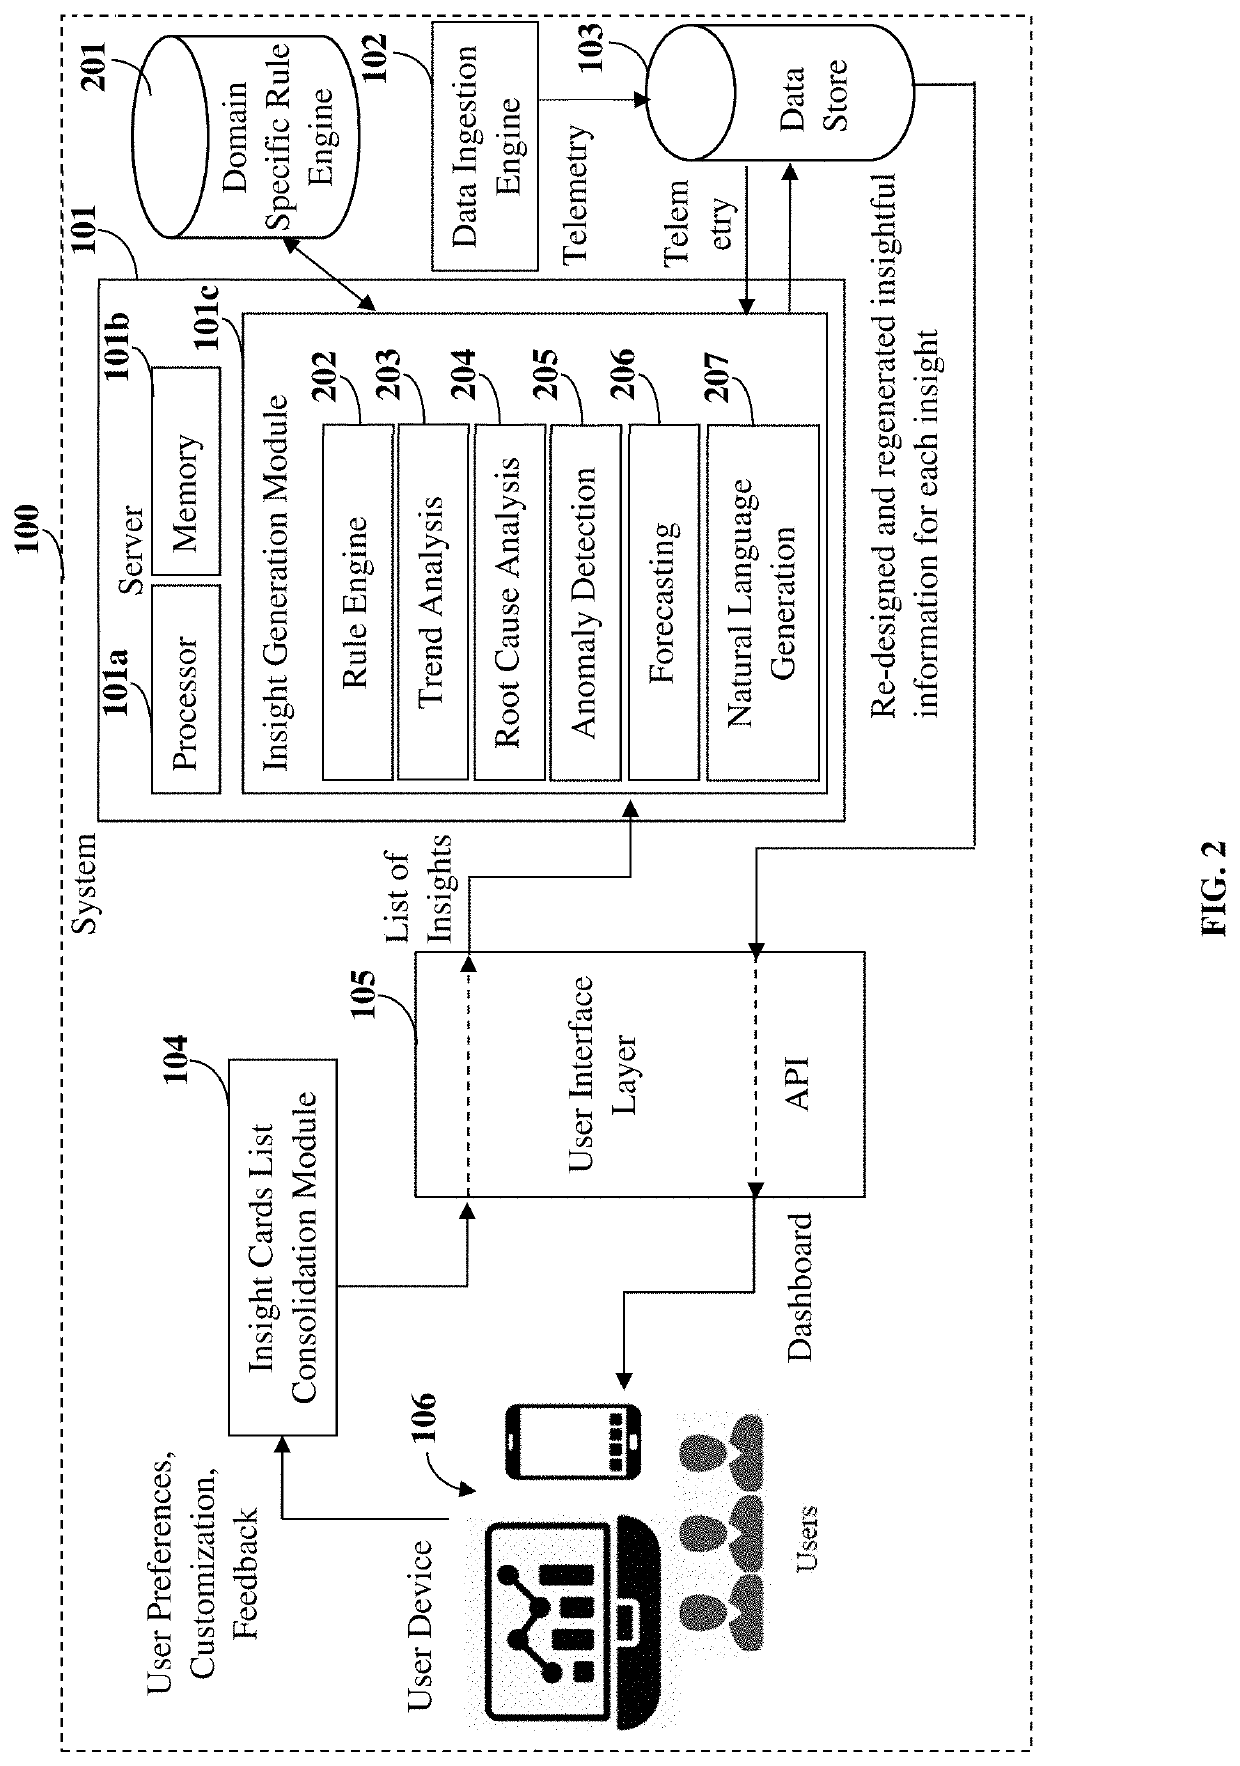
A system and method for analyzing telemetry of a technology system and generating automated insights are provided. The system receives telemetry from the technology system. The system identifies key metric types in the received telemetry and parses the telemetry. The system categorizes the parsed telemetry and applies domain specific context and rules to the categorized telemetry. The system performs on-demand operations on the categorized telemetry and generates a list of insights based on user preferences. The system generates insightful information comprising human readable text statements, proactive actionable suggestions for preventive measures, predictive forecast of upcoming events, and any combination thereof, for each of the insights. The system creates an output dashboard for the generated insightful information and displays the output dashboard on the user device.

Description

CROSS-REFERENCE TO RELATED APPLICATION[0001]This application claims priority to and the benefit of the non-provisional patent application titled “System for Automatically Generating Insights by Analyzing Telemetric Data”, application number 202141009910, filed in the Indian Patent Office on Mar. 9, 2022, which claims the benefit of provisional patent application titled “Method and System for Segregation, Analysis and Generation Automated Insights”, application number 202141009910, filed in the Indian Patent Office on Mar. 9, 2021. This application also claims priority to and the benefit of the non-provisional patent application titled “System for Automatically Generating Insights by Analyzing Telemetric Data”, application number 202244012797, filed in the Indian Patent Office on Mar. 9, 2022, which claims the benefit of provisional patent application titled “Method and System for Segregation, Analysis and Generation Automated Insights”, application number 202141009910, filed in the ...

Claims


Application Information

Patent Timeline
IPC IPC(8): G06F11/30G06F11/07G06F11/34
CPCG06F11/3086G06F11/0778G06F11/3428G06F11/079G06F11/324G06F11/004
Inventor RAMACHANDRAN, ASHWIN KUMARKAVEETIL, JITHESHSAROHA, SAGAR
Owner VUNET SYST PTE LTD
Why Eureka
Try Eureka