Graphical user interface for project data

a project data and user interface technology, applied in the field of graphical user interfaces, can solve the problems of complex and difficult to learn most common project management systems and software, the underlying data of the project is often comprehensive and complex, and simple additions or changes to a project or task require extensive and time-consuming navigation and editing of data

Inactive Publication Date: 2005-02-08
SPINOZA TECH
View PDF13 Cites 145 Cited by
  • Summary
  • Abstract
  • Description
  • Claims
  • Application Information

AI Technical Summary

Benefits of technology

In accordance with still another aspect of the invention, the radar screen is further divided into one or more wedges with each wedge representative of a separate task and various attributes of the task. The size of each wedge represents the relative importance of the task to the project as a whole. Thus, for example, four tasks each of equal importance would divide the radar screen into four equal quarter-circle wedges.
In accordance with still another aspect of the invention, the background of the radar screen or one or more of its wedges is color-enhanced to provide visual indication to the status of project or tasks.

Problems solved by technology

The most common project management systems and software are complicated and difficult to learn.
Additionally, a common problem with many project management systems is that the visual representation of the project's underlying data tends to be comprehensive and complex.
In many project management systems, simple additions or changes to a project or task require extensive and time-consuming navigation and editing of data across a multitude of display screens.
Additionally, because the data of the project is displayed in charts with multiple timeline bars, there is no intuitive view of the overall data from a single view.
However, the graphical interface is static and does not present any of the underlying data in combination with the interface.
However, the data associated with the project is contained in a plurality of display windows and is not easily navigable or ascertained.
Finally, the present project management systems do not provide a quick, intuitive way for a user to manage, join, assign, or otherwise provide project management functions across an enterprise-wide network environment without having to add additional hardware or software at the server or client level.
Additionally, the systems rely on slow scripting from the server side to display poorly displayed Web pages that graphically do not enhance the viewing, editing or navigation of the data presented.

Method used


Image

  • Graphical user interface for project data
  • Graphical user interface for project data
  • Graphical user interface for project data

Examples


Embodiment Construction

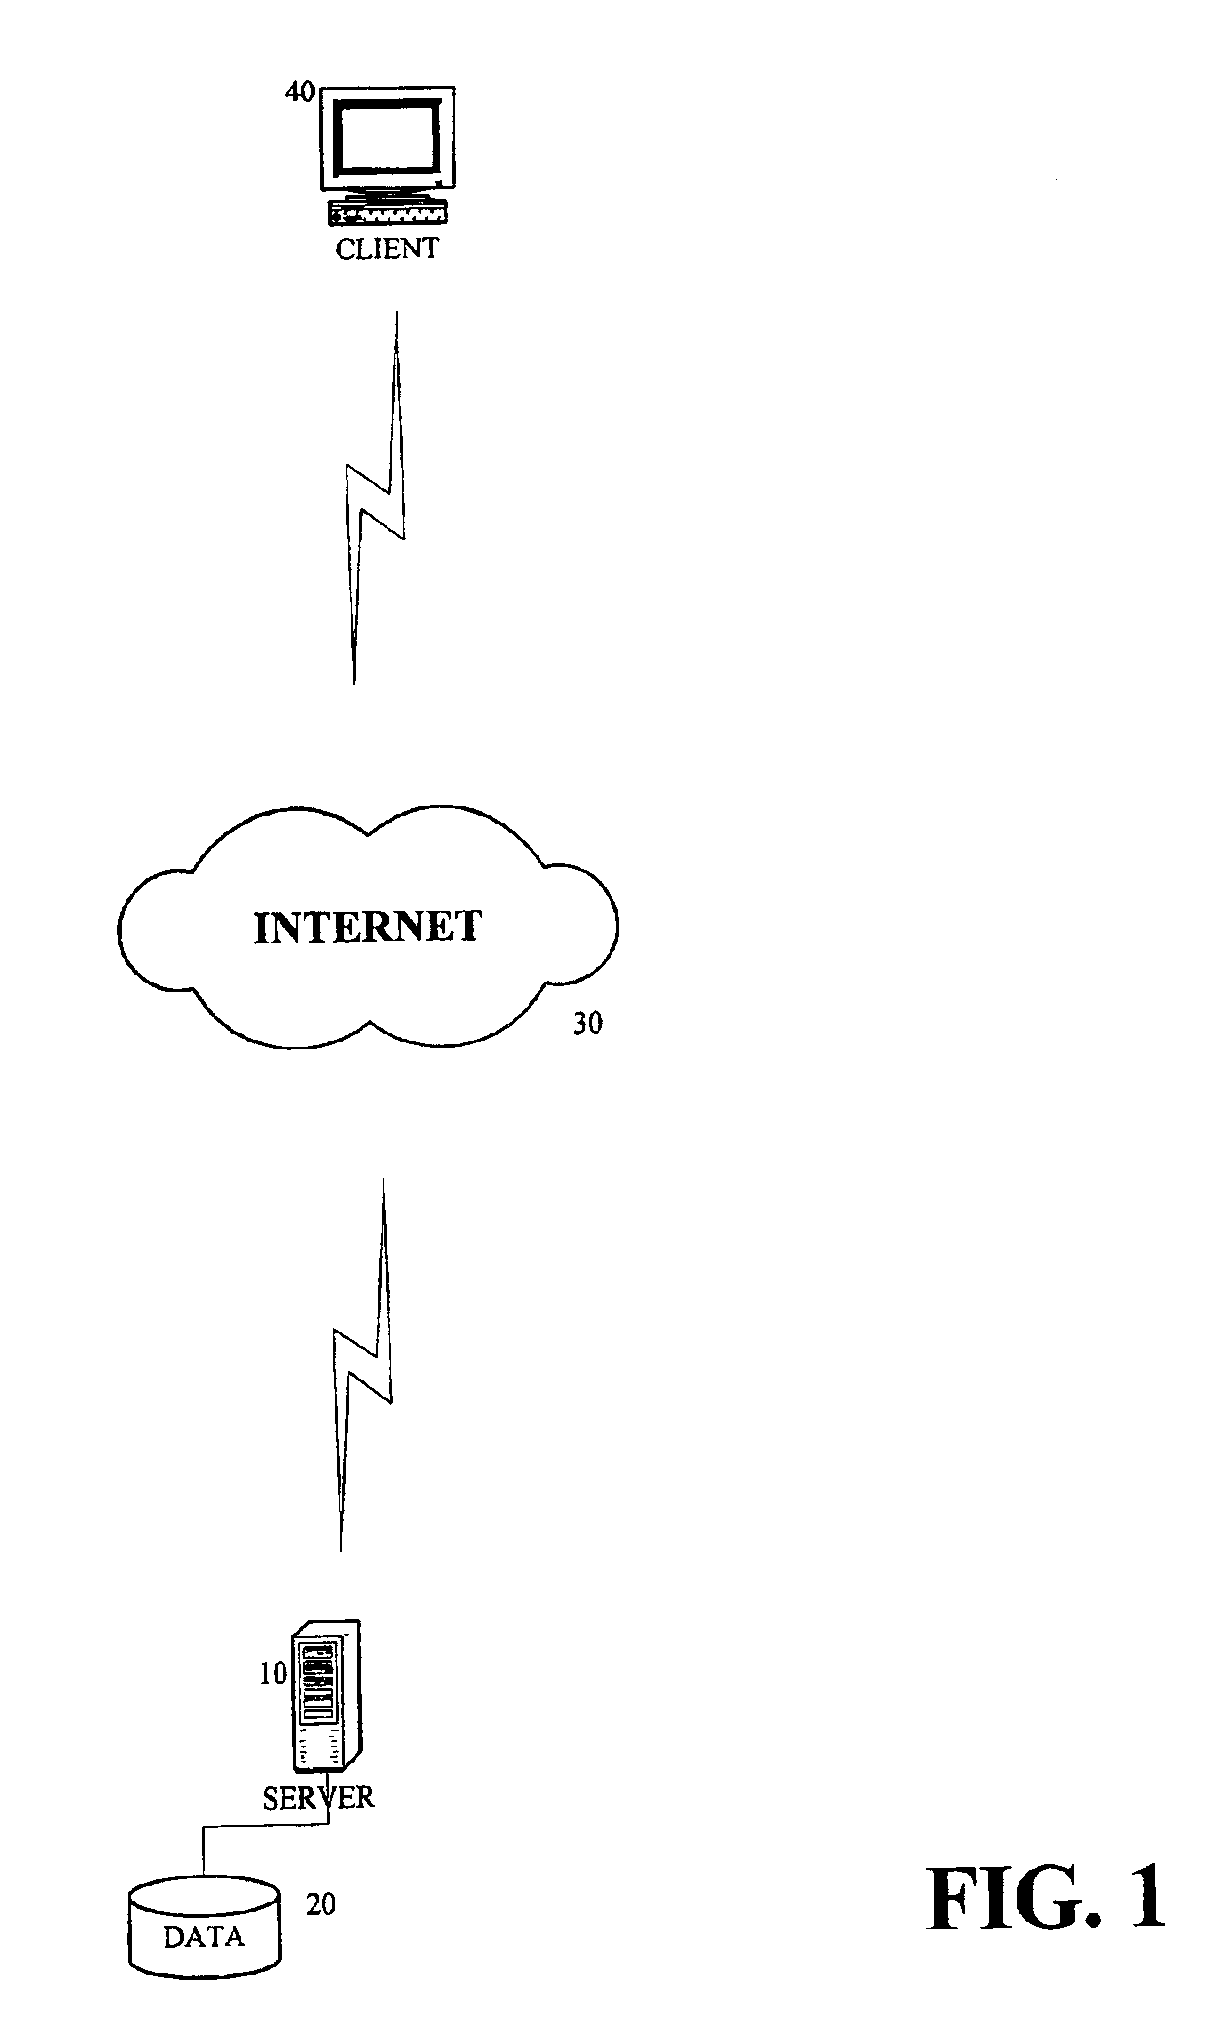
FIG. 1 is a block diagram depicting a preferred embodiment of the project management interface invention. Referring to FIG. 1, a server 10 with attached data memory 20 is connected via a network 30 to a client 40 that includes a display.

The server 10 is configured to send the project management interface via Java-enhanced HyperText Markup Language (“HTML”) Web pages to other computers over the network 30, including to the client 40. The Web page is sent to the client 30 so that it may be viewed under the client's 40 browser software. While HTML is the preferred format for transmitting information from the server to the client, it is certainly not the only format possible. Rather, the client and server may communicate using any of a variety of other languages and data formats. While the server 10 is preferably an Internet or “Web” server, it may alternatively be any type of hardware device or software code capable of being accessed over a network (including internet, intranet, LAN, c...


PUM


Abstract

A project management display method and system in which a user logs on to a server from a client computer over a network to display a graphical interface associated with a project. The graphical interface allows the user to view, edit and navigate project data. The graphical interface includes a graphical object that looks similar to a radar screen. The radar screen further includes one or more design objects that provide to the user indicators to those objects that are most important. The indicators change color or position to indicate to the user the urgency associated with a project or task. The graphical interface provides the user the ability to edit project data and have those edits reflected through the graphical interface. The graphical interface also provides the user the ability to navigate through the displayed project and the radar screen view is update accordingly.

Description

FIELD OF INVENTIONThis invention relates to an improved graphical user interface for displaying project status information.BACKGROUND OF THE INVENTIONProject management systems abound in many forms today. The most common project management systems and software are complicated and difficult to learn. Users must be familiar not only with general computer functionality but also the specific type of idiom related to project management. For example, to schedule and monitor tasks, a necessary skill associated with project management, a user must rely on the use of complicated charts to manage the duration and resources associated with the tasks of a project.Additionally, a common problem with many project management systems is that the visual representation of the project's underlying data tends to be comprehensive and complex. In many project management systems, simple additions or changes to a project or task require extensive and time-consuming navigation and editing of data across a m...

Claims


Application Information

Patent Timeline
Patent Type & Authority Patents(United States)
IPC IPC(8): G06F3/033G06Q10/00G06F3/048G06Q10/06
CPCG06F3/0481G06Q10/063118G06Q10/06G06F3/04847
Inventor MASSENGALE, RANDYMEURET, III, HENRY L.FLOTREE, DAVID M.KUHN, WILLIAM G.
Owner SPINOZA TECH
Why Eureka
Try Eureka