System and method for generating a visualized data representation preserving independent variable geometric relationships

a technology of independent variable and geometric relationship, applied in the field of data visualization, can solve problems such as confusion, difficulty in understanding and usability, and difficulty in mapping multi-dimensional information into a two- or three-dimensional space, and achieve the effect of preserving independent variable geometric relationship and preserving geometric relationship

Inactive Publication Date: 2005-05-03
NUIX NORTH AMERICA
View PDF12 Cites 79 Cited by
  • Summary
  • Abstract
  • Description
  • Claims
  • Application Information

AI Technical Summary

Benefits of technology

[0011]The present invention provides a system and method for reorienting a data representation containing clusters while preserving independent variable geometric relationships. Each cluster is located along a vector defined at an angle θ from a common axis x Each cluster has a radius r. The distance (magnitude) of the center ci of each cluster from a common origin and the radius r are independent variables relative to other clusters and the radius r of each cluster is an independent variable relative to the common origin. The clust

Problems solved by technology

Careful use of color, shape and temporal attributes can simulate multiple dimensions, but comprehension and usability become difficult as additional layers of modeling are artificially grafted into the finite bounds of display capabilities.
Thus, mapping multi-dimensional information into a two- or three-dimensional space presents a problem.
Compressing multi-dimensional information into three dimensions can mislead, for instance, the viewer through an erroneous interpretation of spatial relationships between individual display objects.
Other factors further complicate the interpretation and perception of visualized data, based on the Gestalt principles

Method used


Image

  • System and method for generating a visualized data representation preserving independent variable geometric relationships
  • System and method for generating a visualized data representation preserving independent variable geometric relationships
  • System and method for generating a visualized data representation preserving independent variable geometric relationships

Examples


Embodiment Construction

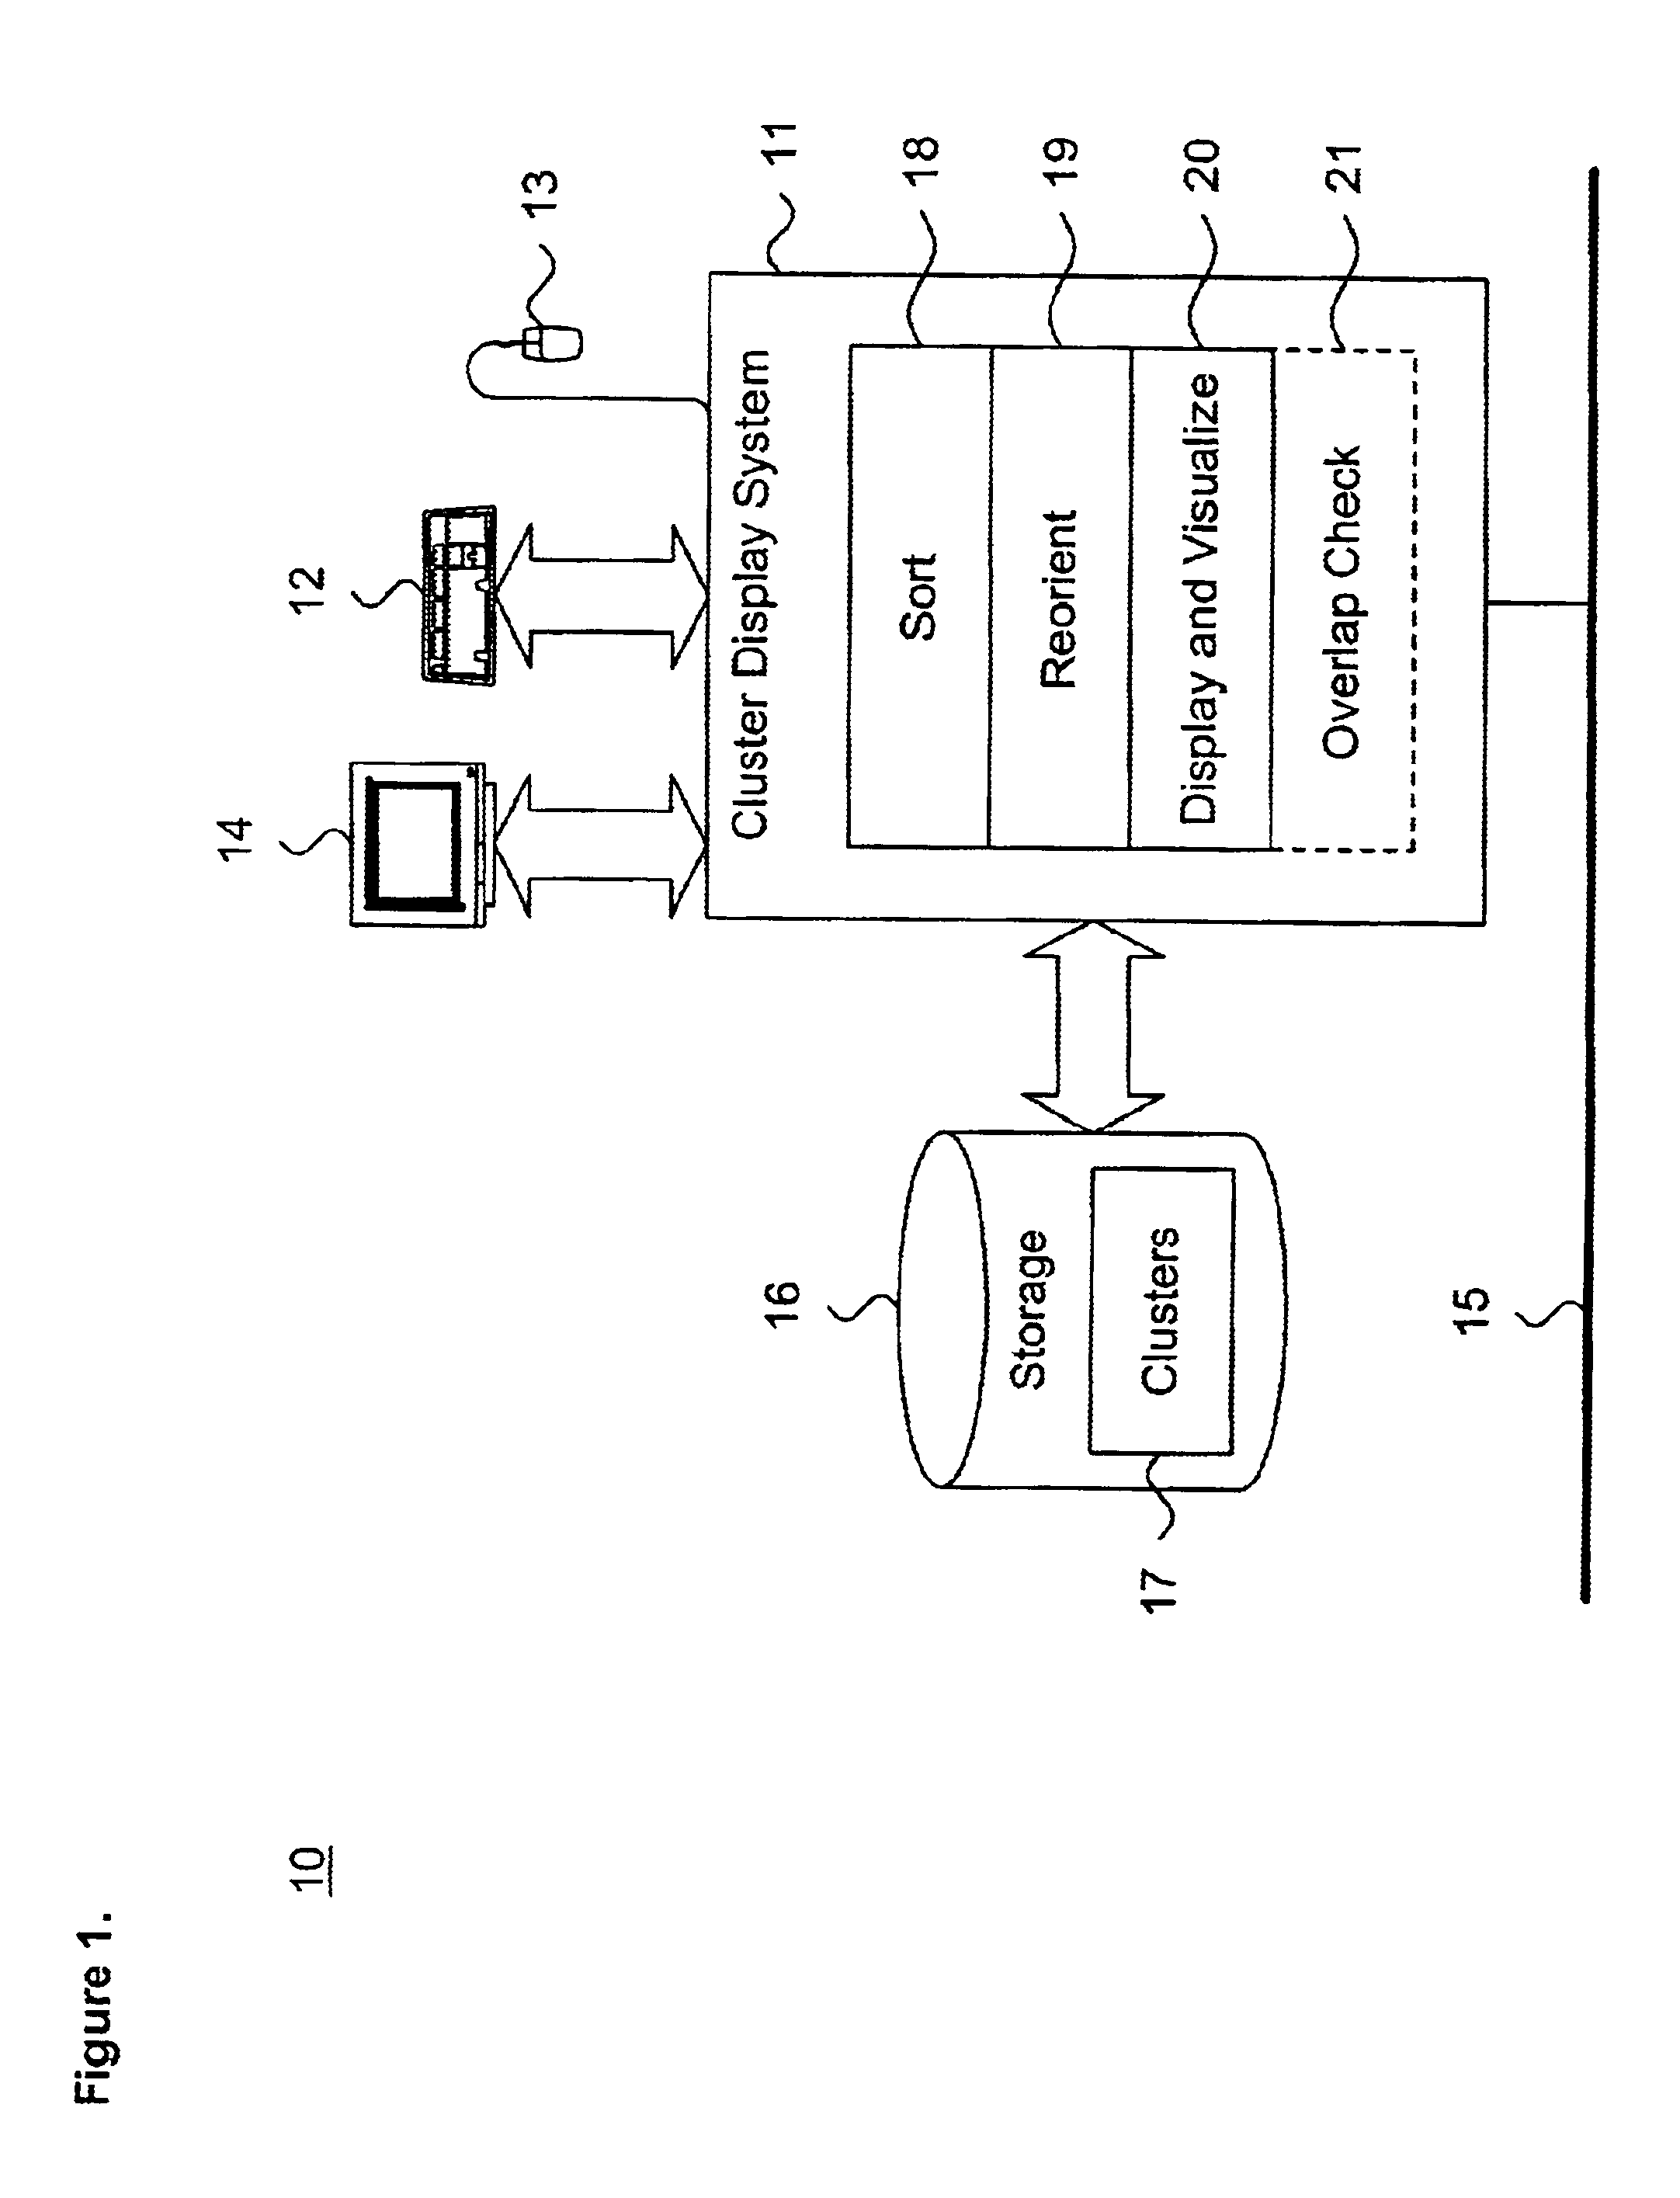
[0031]FIG. 1 is a block diagram 10 showing a system for generating a visualized data representation preserving independent variable geometric relationships, in accordance with the present invention. The system consists of a cluster display system 11, such as implemented on a general-purpose programmed digital computer. The cluster display system 11 is coupled to input devices, including a keyboard 12 and a pointing device 13, such as a mouse, and display 14, including a CRT, LCD display, and the like. As well, a printer (not shown) could function as an alternate display device. The cluster display system 11 includes a processor, memory and persistent storage, such as provided by a storage device 16, within which are stored clusters 17 representing visualized multi-dimensional data. The cluster display system 11 can be interconnected to other computer systems, including clients and servers, over a network 15, such as an intranetwork or internetwork, including the Internet, or various...


PUM


Abstract

A system and method for generating a visualized data representation preserving independent variable geometric relationships is described. A pair of convex clusters are selected. Each convex cluster is rendered on a display. Each convex cluster has a center of mass located at an original fixed distance from a common origin, and is oriented along a vector formed at a fixed angle from a common polar axis. A span is measured between the centers of mass of each convex cluster. For each convex cluster, a segment is measured from the center of mass of each convex shape to a point closest to the other convex shape along the span. A new fixed distance from the common origin for the center of mass for one of the convex clusters located along the vector for that convex cluster is evaluated if the span is less than the sum of the segments of the convex clusters. The pair of convex clusters are displayed rendered using at least the new fixed distance for the center of mass of the one convex cluster.

Description

FIELD OF THE INVENTION[0001]The present invention relates in general to data visualization and, in particular, to a system and method for generating a visualized data representation preserving independent variable geometric relationships.BACKGROUND OF THE INVENTION[0002]Computer-based data visualization involves the generation and presentation of idealized data on a physical output device, such as a cathode ray tube (CRT), liquid crystal diode (LCD) display, printer and the like. Computer systems visualize data through the use of graphical user interfaces (GUIs) which allow intuitive user interaction and high quality presentation of synthesized information.[0003]The importance of effective data visualization has grown in step with advances in computational resources. Faster processors and larger memory sizes have enabled the application of complex visualization techniques to operate in multi-dimensional concept space. As well, the interconnectivity provided by networks, including in...

Claims


Application Information

Patent Timeline
IPC IPC(8): G06T17/00
CPCG06T11/20G06T11/206G06T17/00
Inventor GALLIVAN, DAN
Owner NUIX NORTH AMERICA
Why Eureka
Try Eureka