System and method for visualizing repetitively structured Markov models

Active Publication Date: 2006-08-22
THE MATHWORKS INC
View PDF3 Cites 64 Cited by
  • Summary
  • Abstract
  • Description
  • Claims
  • Application Information

AI Technical Summary

Problems solved by technology

Unfortunately state diagrams do not represent an ideal method of conveying probability information from a Markov model to a user.
Where there are a large number of states in the system being modeled, the state diagram may become confusing.
Additionally, the state diagram may be

Method used


Image

  • System and method for visualizing repetitively structured Markov models
  • System and method for visualizing repetitively structured Markov models
  • System and method for visualizing repetitively structured Markov models

Examples


Embodiment Construction

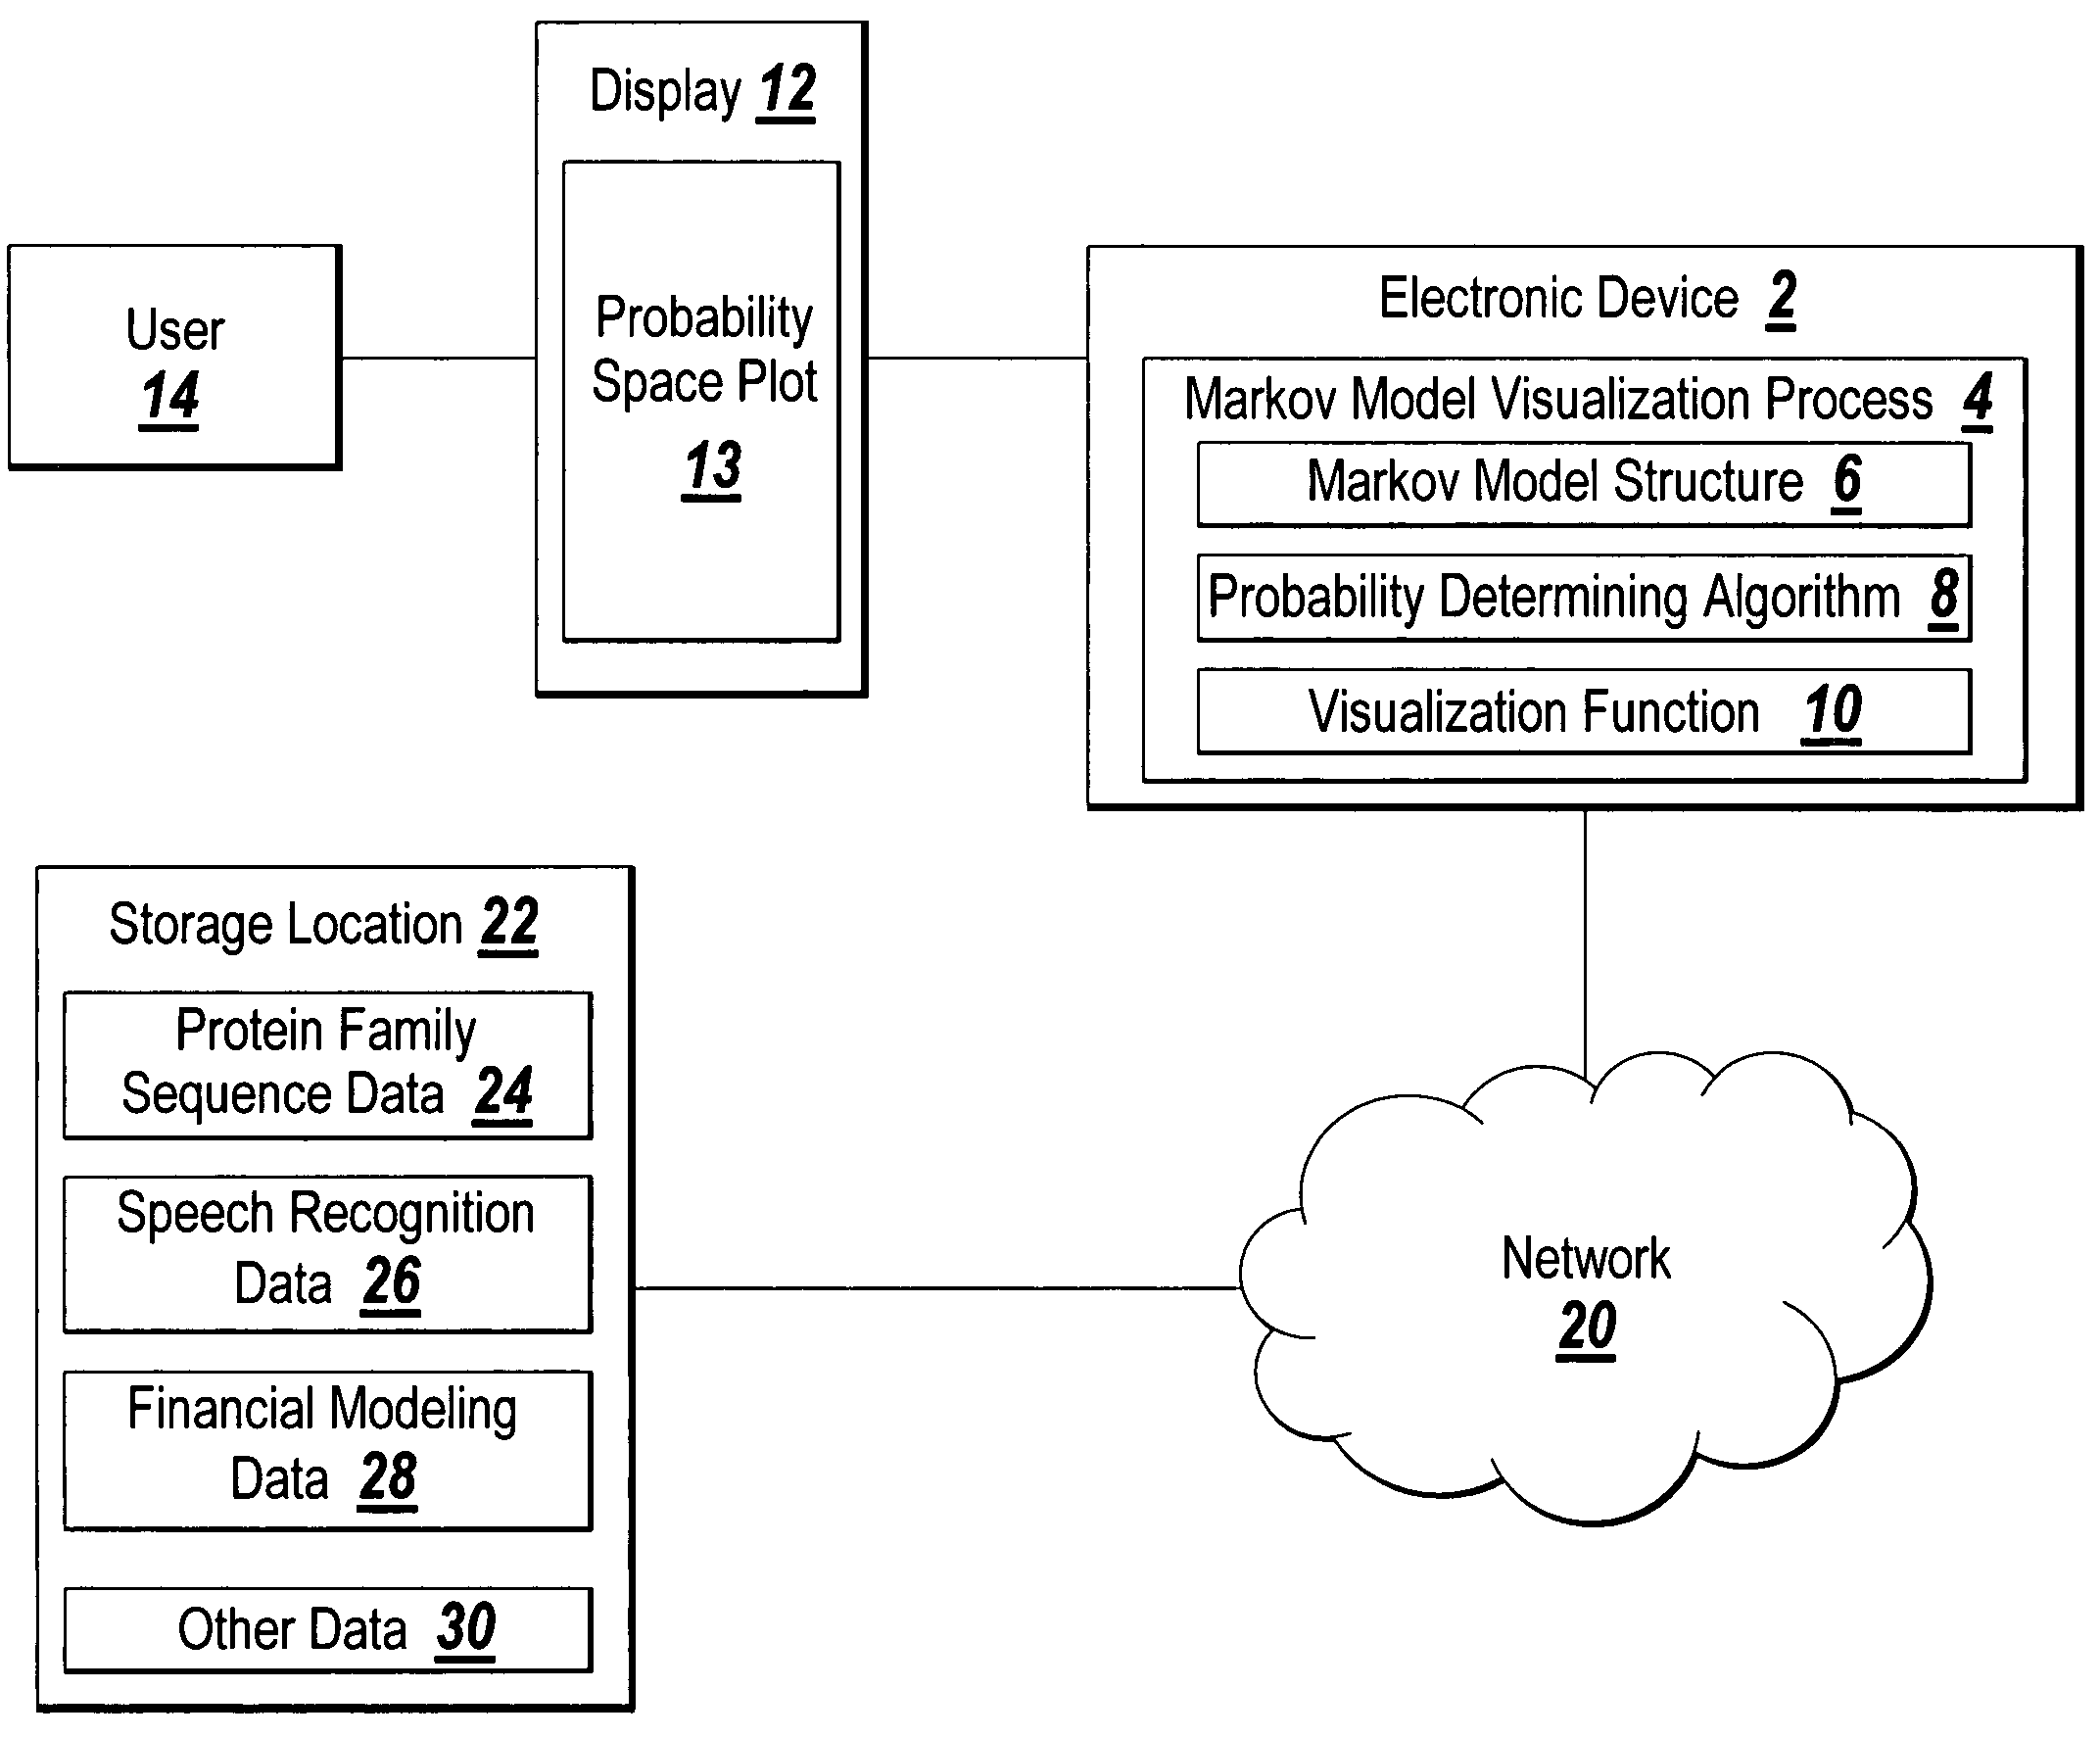
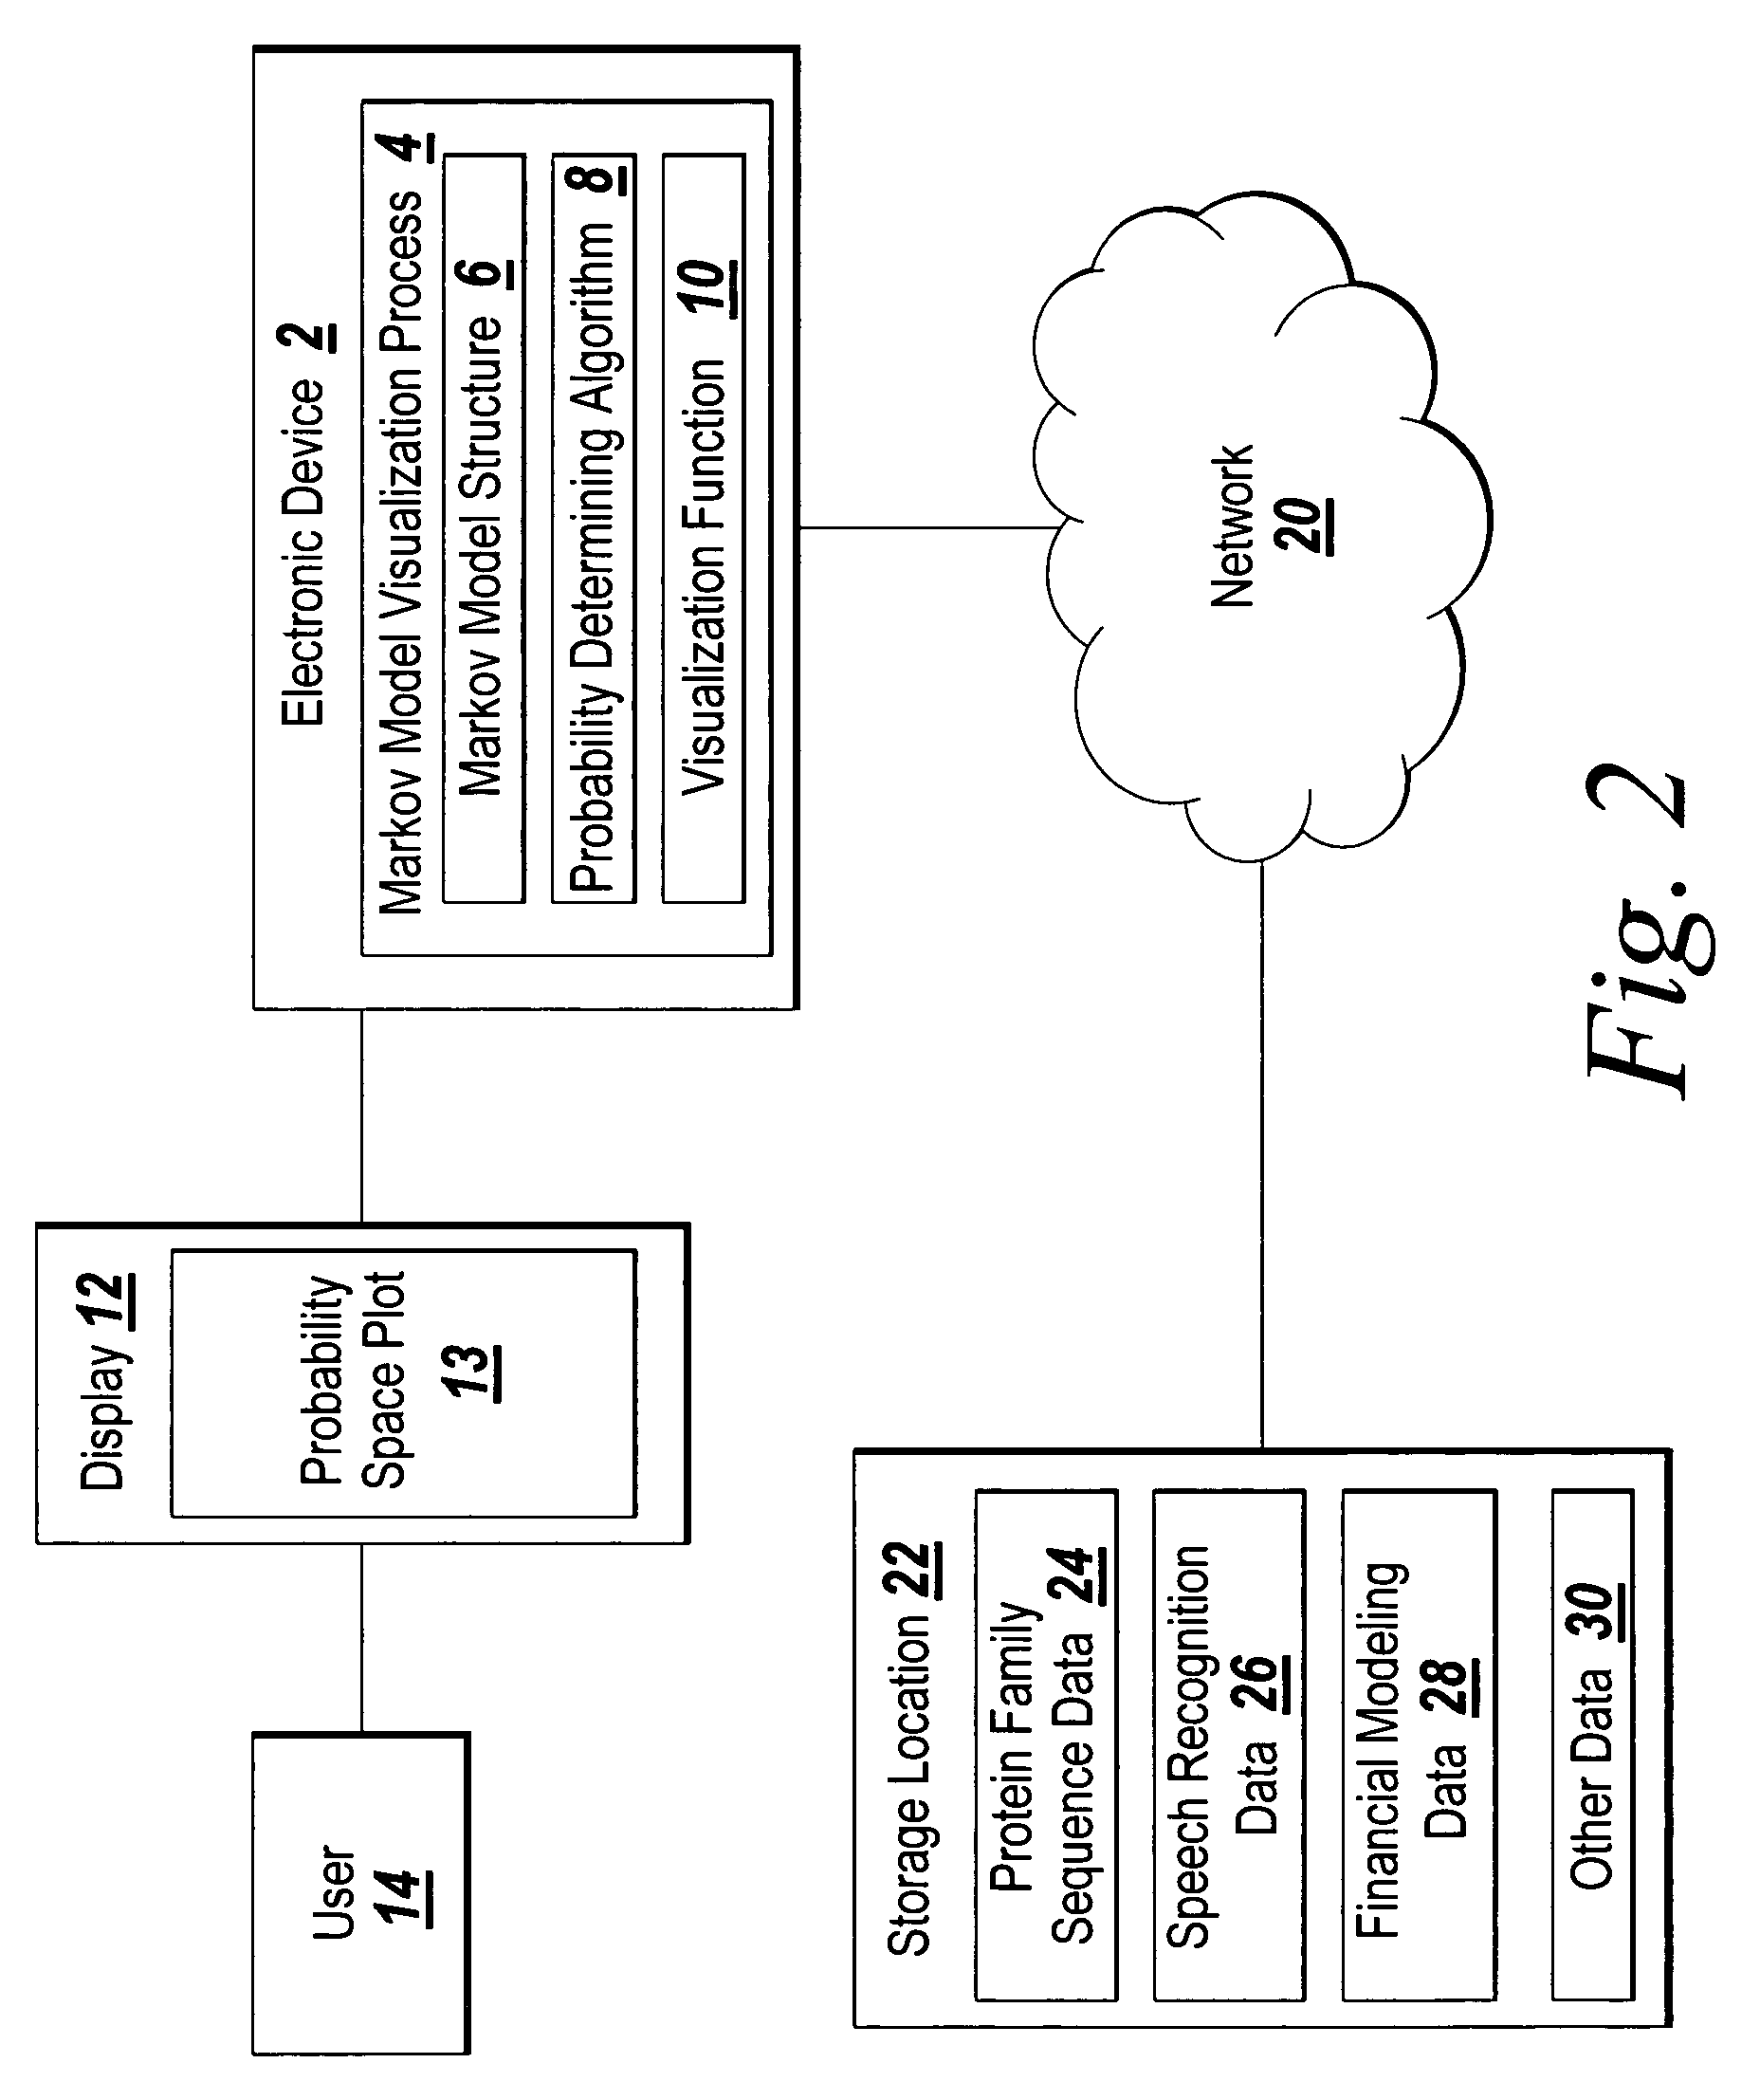
[0015]The illustrative embodiment of the present invention provides a plot for visualization of the probabilistic structure of a repetitive Markov model. The Markov model probability space plot graphically represents the probability space of a repetitively structured Markov model in a three-dimensional space. For example, model state may be displayed along the first dimension, output probability field may be displayed along the second dimension, and a probability measure (after proper scaling) may be displayed in the third dimension and represented with a color indicative of intensity so that the data forms a heat map. The output probability field may be either a symbol emission mass distribution function (MDF) at every state, or, a transition MDF probability at every state. The scaling of probabilities may be plain probabilities, log-probabilities or log-odds. Log-odds probabilities compute the ratio between the observed model probabilities and a background probability. The log-odd...


PUM


Abstract

A method of displaying the probabilities associated with a Markov model as a series of interactive plots is disclosed. Three dimensions of probability data associated with a Markov model are presented to a user in a concise manner. Heat maps are used to display probability data from a Markov model so that the user can identify and understand hidden patterns and information in the data such as state and emission transitions which are not possible to see with conventional state diagram plots.

Description

FIELD OF THE INVENTION[0001]The illustrative embodiment of the present invention relates generally to the modeling of systems using Markov models and more particularly to the display of probabilities associated with Markov models.BACKGROUND[0002]A Markov model is a common statistical tool for modeling structured processes or phenomena that include randomness in both the output and the state of the process. Such models are used in many fields including in computational biology for modeling of protein family sequences, in speech recognition and in financial modeling. Markov models are generally represented by state diagrams showing both the emission probabilities and the transition probabilities of the system being modeled. Emission probabilities show the probabilities of certain outputs. Transition probabilities are the probabilities of changing the state of the model. State diagrams are useful for visualizing the architecture of the model and for seeing how the model can transition ...

Claims


Application Information

Patent Timeline
IPC IPC(8): G06F11/30G06F19/00
CPCG06K9/6297G06K9/6253G06F18/40G06F18/295
Inventor ANDRADE-CETTO, LUCIO
Owner THE MATHWORKS INC
Why Eureka
Try Eureka