Nox gas sensor method and device
a nox gas and sensor technology, applied in the direction of liquid/fluent solid measurement, material electrochemical variables, instruments, etc., can solve the problems of measurement error, significant interference from residual oxygen, and easy to be affected by electronic noise commonly found in automobiles
- Summary
- Abstract
- Description
- Claims
- Application Information
AI Technical Summary
Benefits of technology
Problems solved by technology
Method used
Image
Examples
example 1
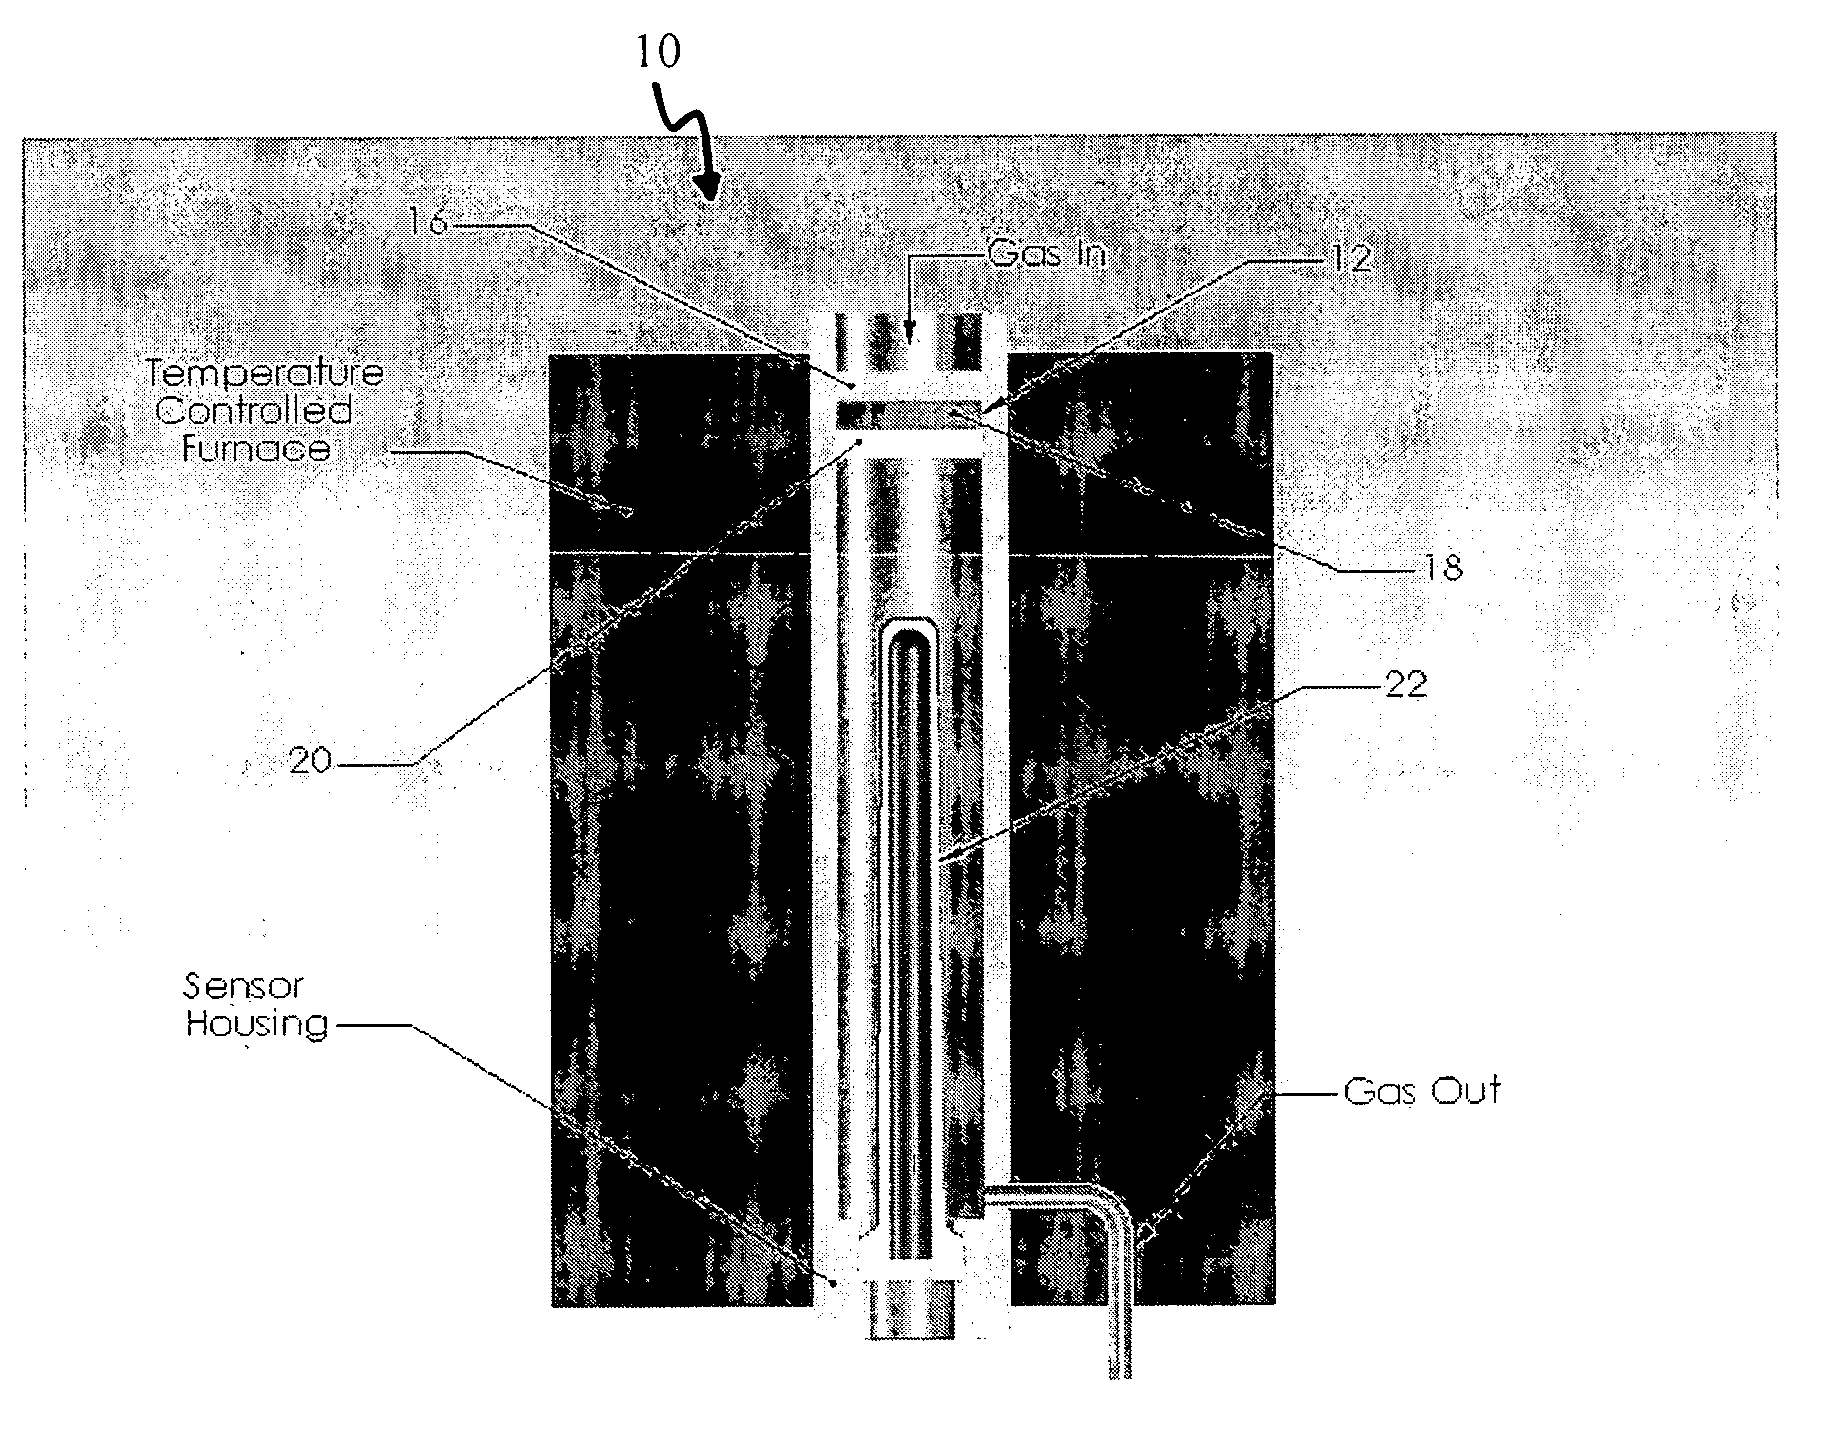
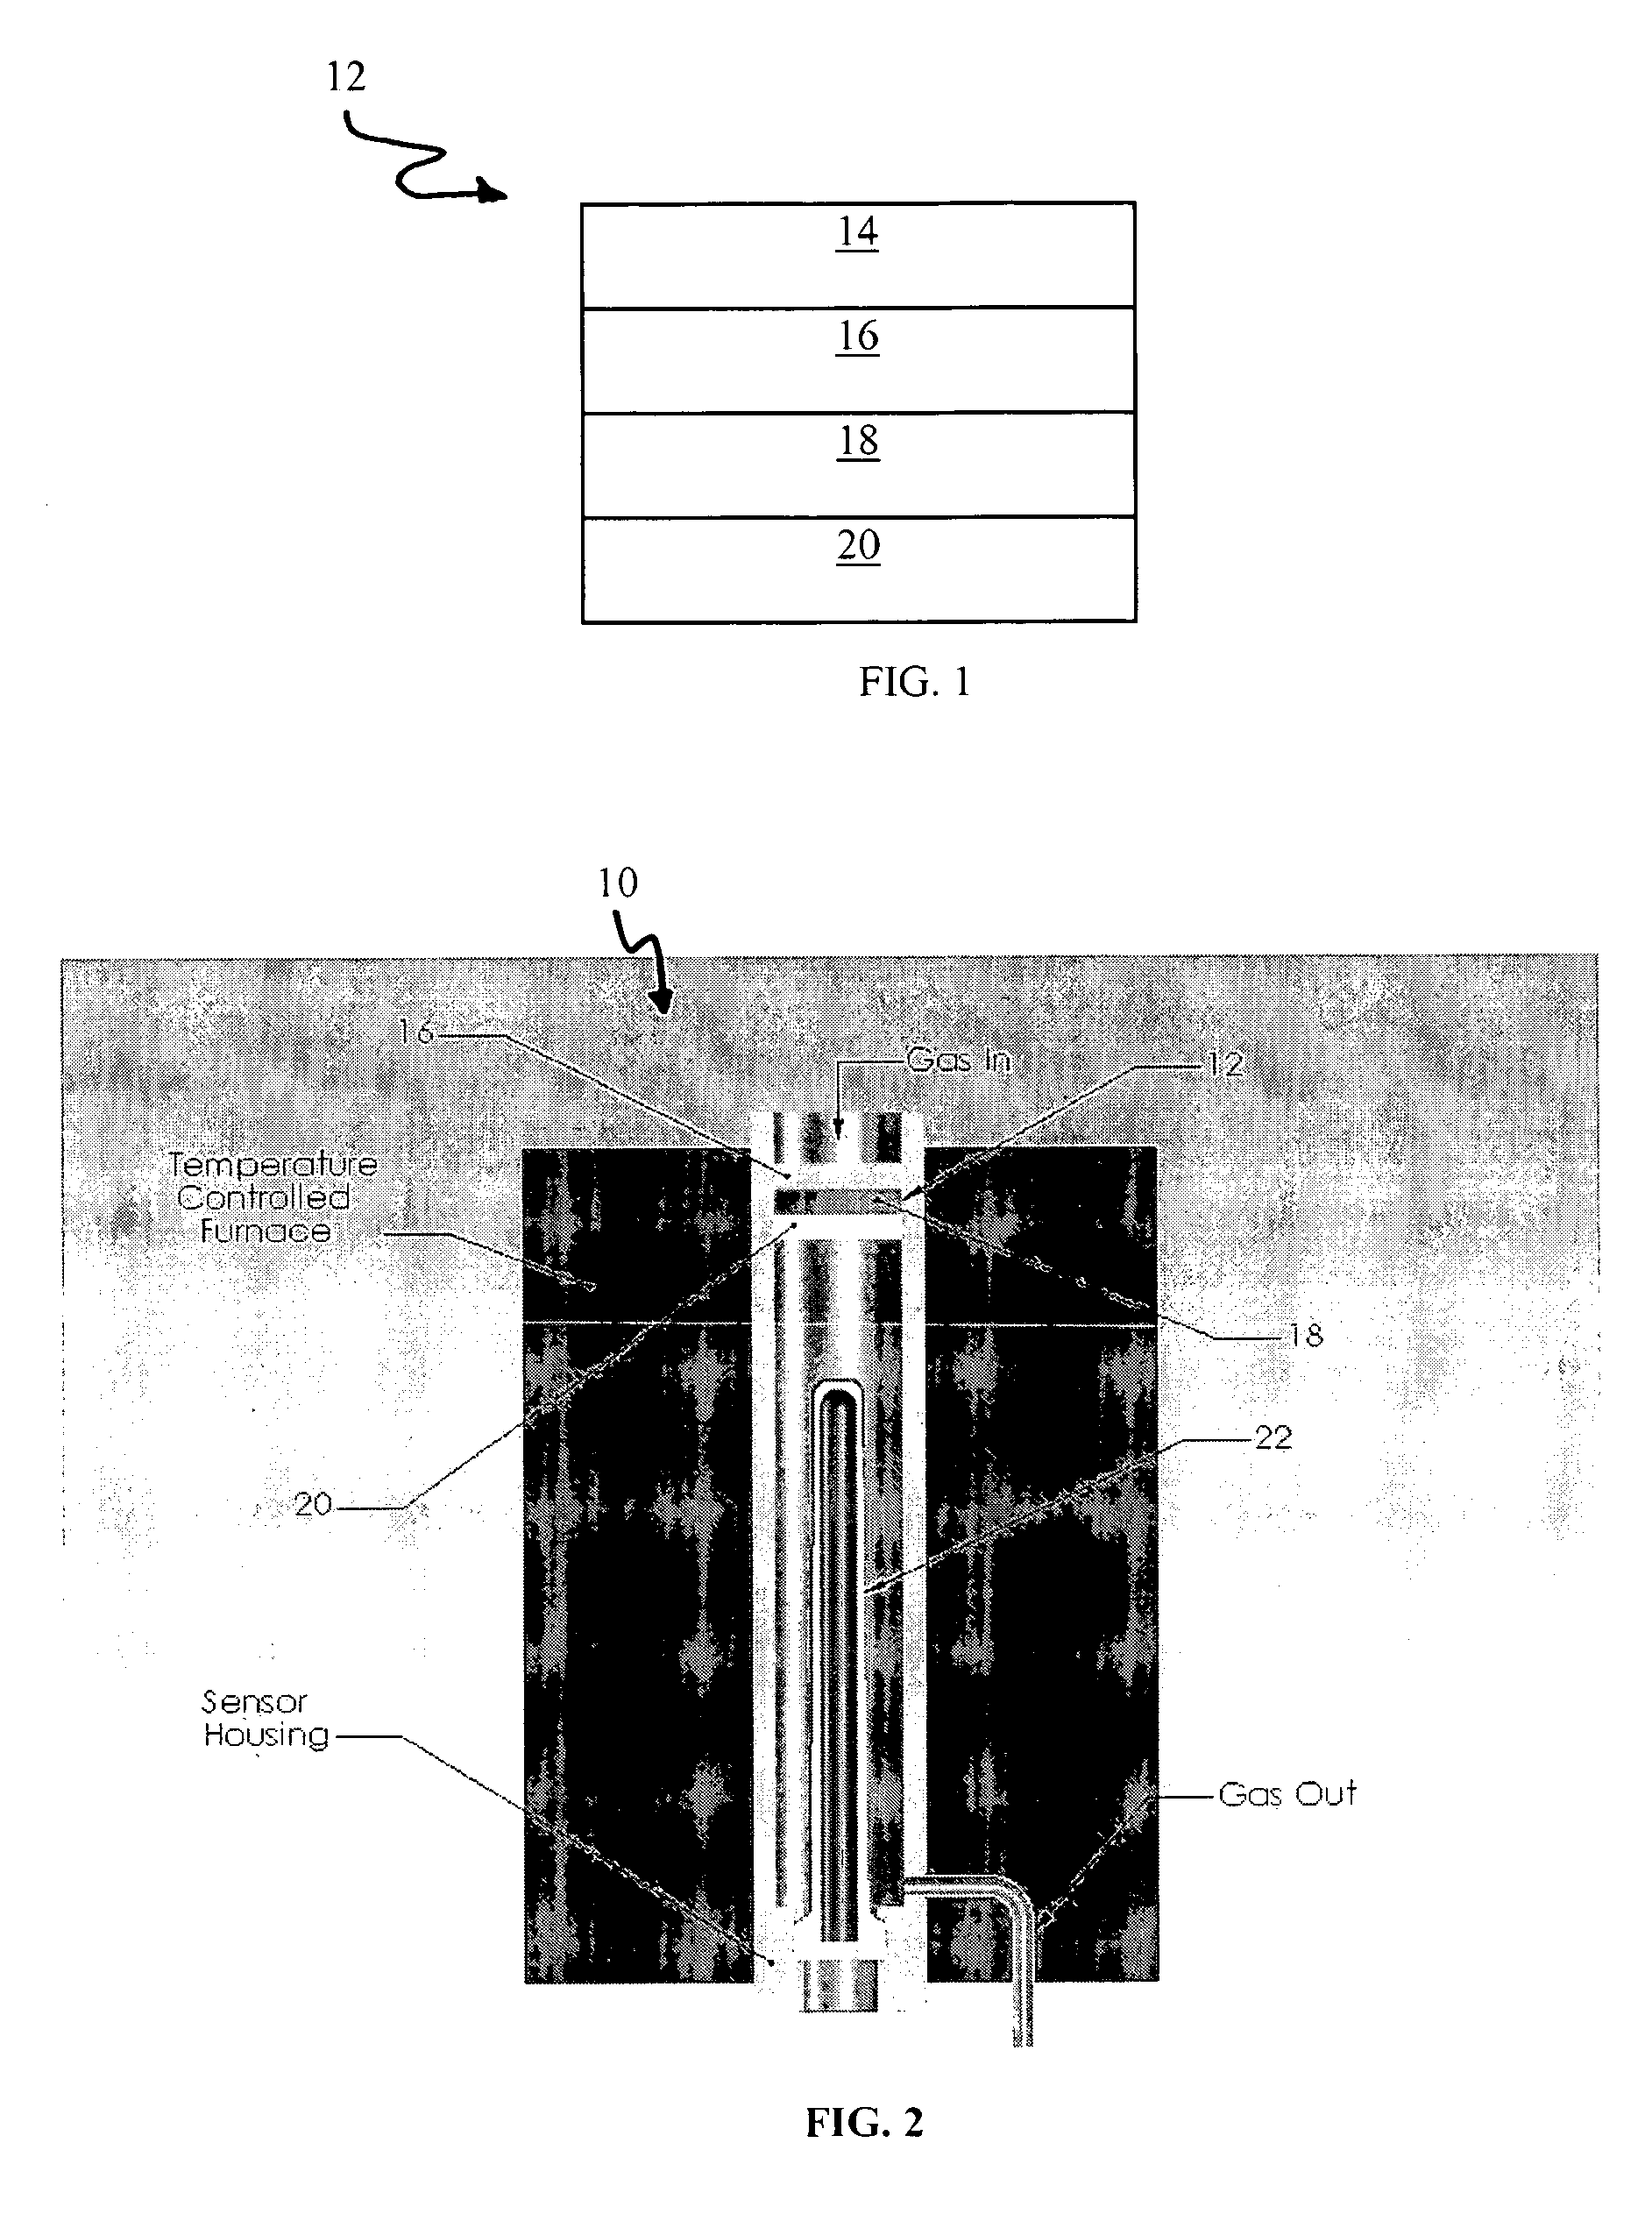
[0043]A NOx sensor22 having a structure of the kind shown in FIG. 2 was constructed of a tubular electrolyte body fabricated by the addition of a binder to a commercially available 8 mole % Y2O3 doped zirconia powder. The binder / powder mixture was dispensed into a tooling followed by isostatic pressing at 25,000 psi. The ceramic portion was machined to final dimensions and then sintered at 1475° C. for two (2) hours. Next, the ceramic electrolyte was coated with electrodes. The inside of the tube along with a stripe on the outside of the tube (current collector) were coated with a platinum paste electrode material followed by firing at 1000° C. for one (1) hour. Then, the tip of the tube was coated with a tungsten oxide / zirconia mixture that contacted the platinum stripe current collector so that electrical contact was made. The electrode coating was dried and fired at high temperature to promote good adhesion.
[0044]The input assembly 12 was fabricated by using a ⅜″ diameter stainle...
example 2
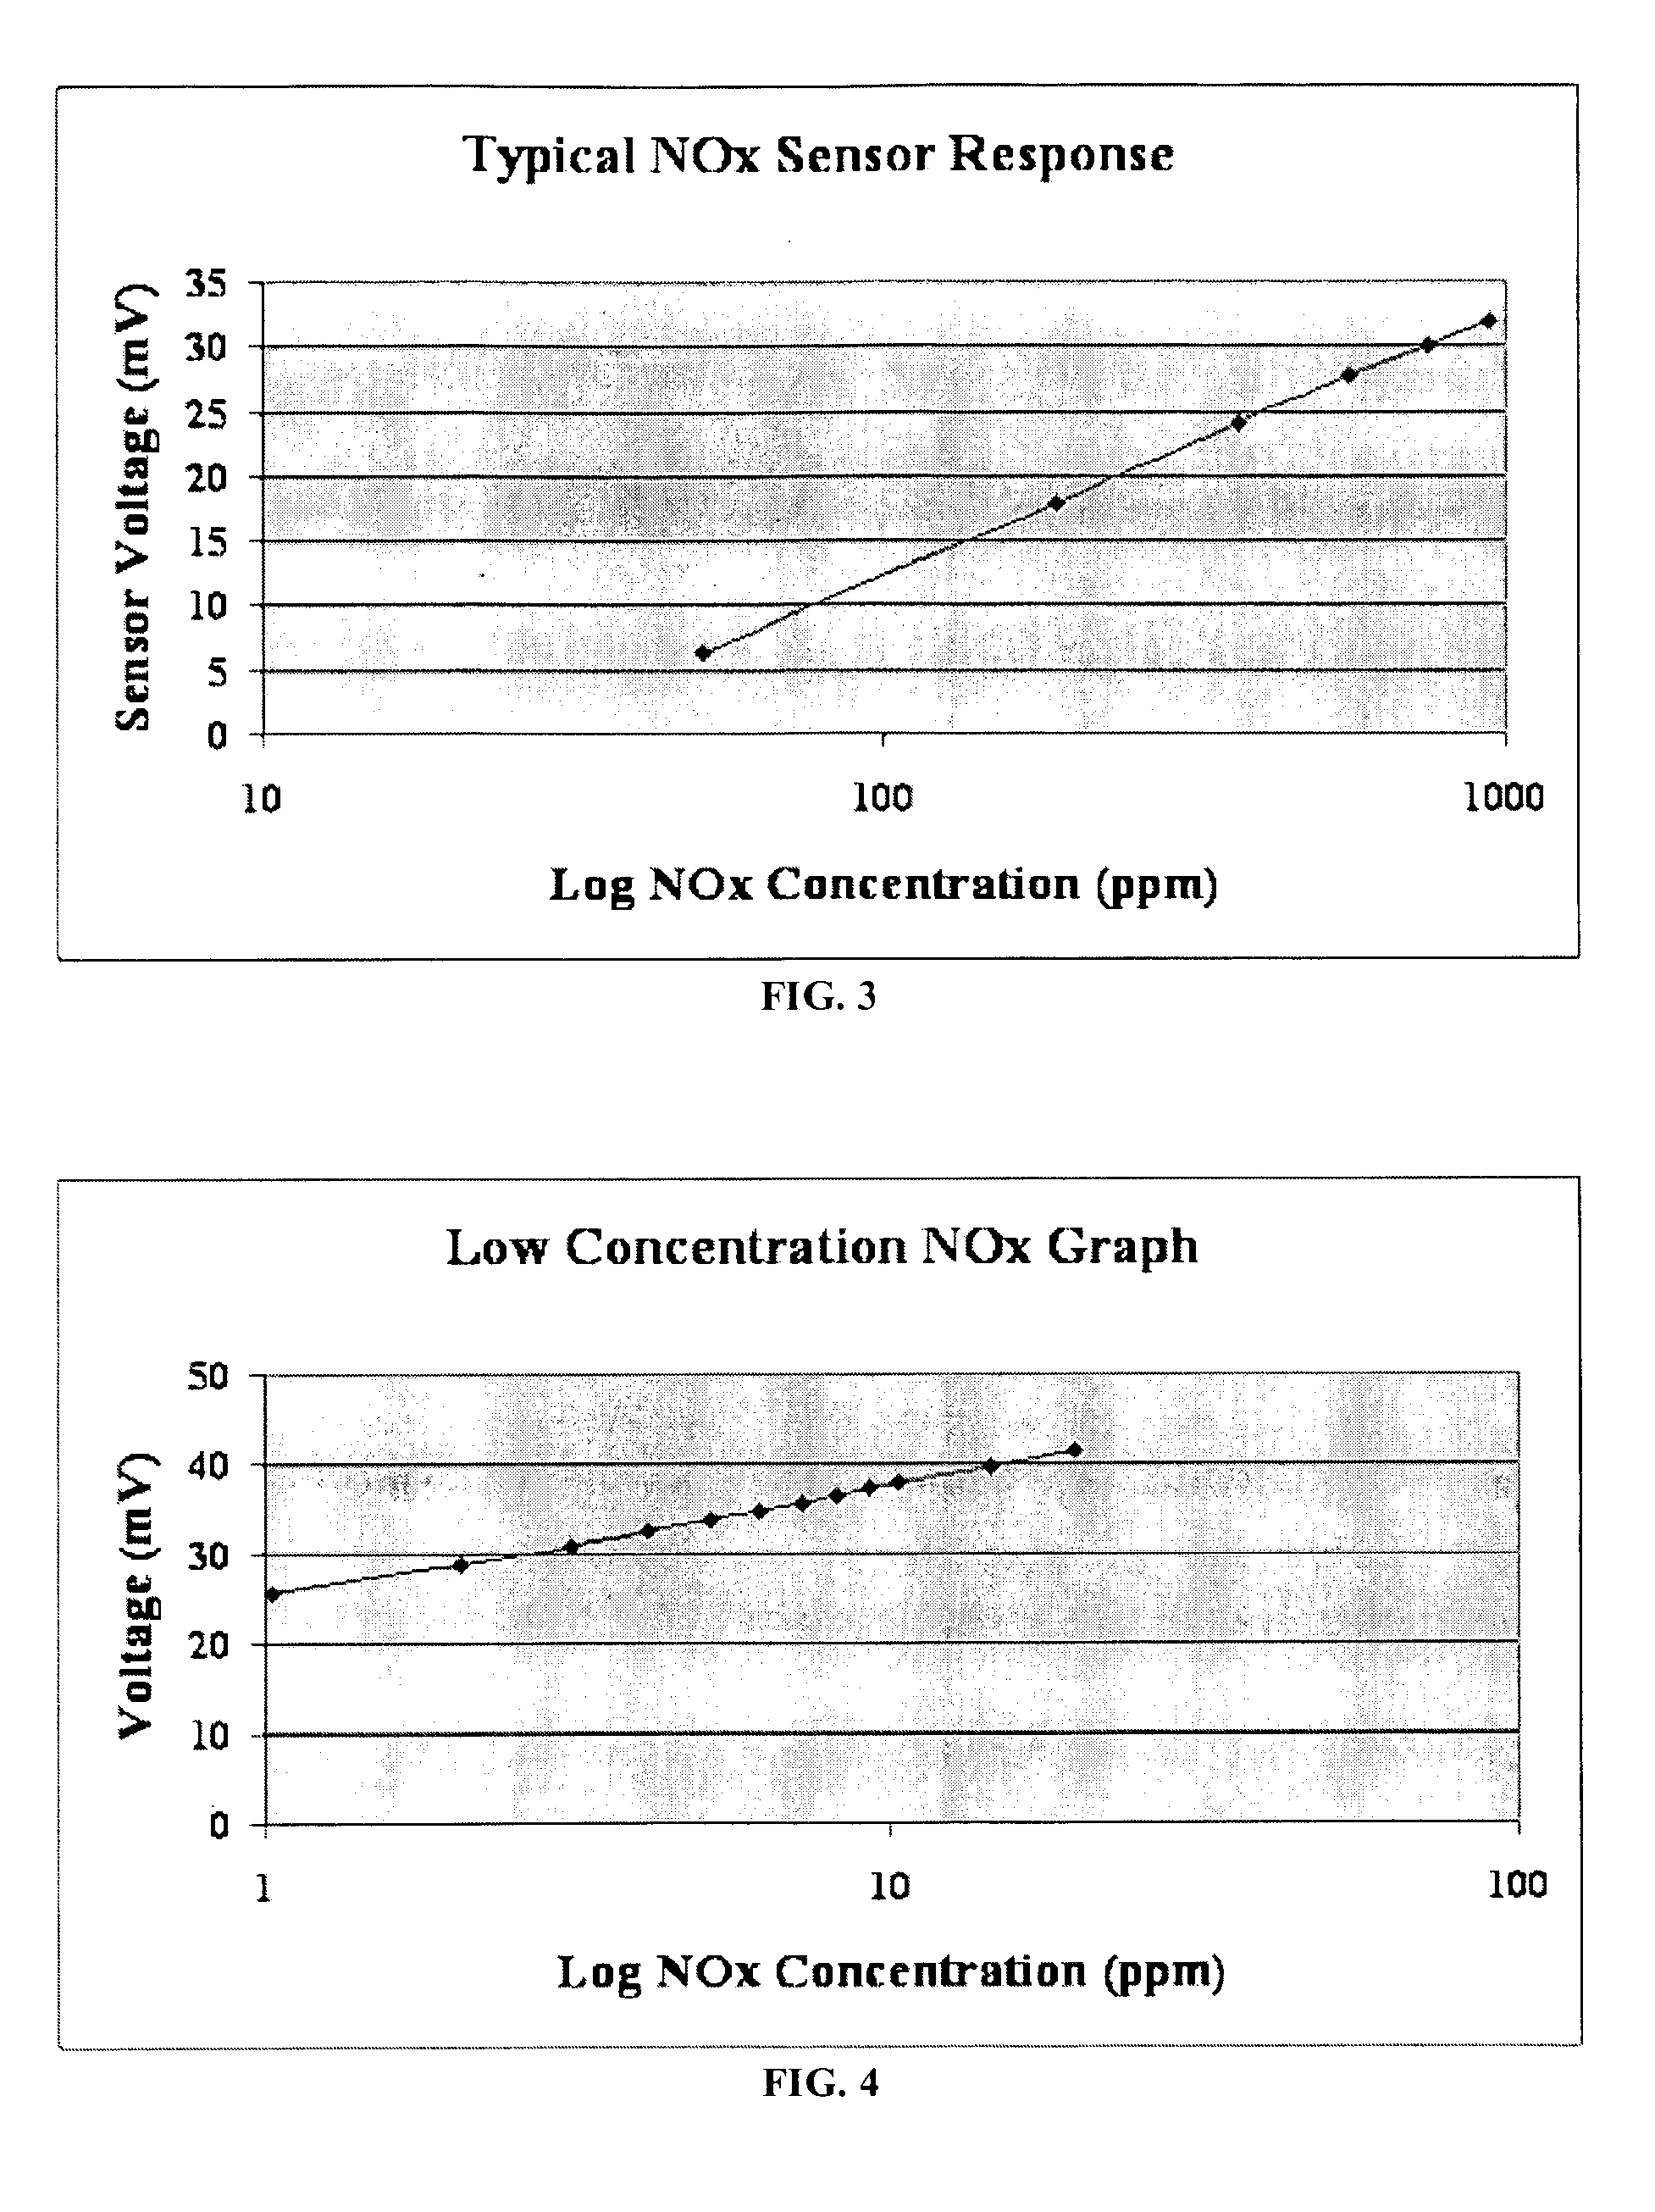
[0046]A NOx sensor fabricated as described in Example 1 was tested at low concentrations of NOx gases to demonstrate the low range capability of the present invention. Gases were mixed together using a four-channel mass flow controller system that enabled changing the NOx concentration in the gas stream and measuring the sensor voltage signal. A certified gas cylinder with a concentration of 20 ppm NO / balance nitrogen was used for this test. The concentration was varied by mixing this gas cylinder with gases from a nitrogen and oxygen cylinder. The concentration was varied in increments of 1 ppm from 1–20 ppm. A graph showing the voltage output signal as a function of NOx concentration is shown in FIG. 4.
example 3
[0047]The NOx sensor fabricated as described in Example 1 was also tested for sensor response time to demonstrate the apparatus' ability to function as part of a control system in a NOx removal device. Gases were mixed together using a four-channel mass flow controller system that enabled changing the NOx concentration in the gas stream and measuring the sensor voltage signal. The gas concentration was switched between 470 ppm and 940 ppm NOx at a flow rate of 500 cc / min. The voltage signal was monitored continuously using a data acquisition system with a sampling rate of three readings per second. The sensor response time is defined as a 90% step change of the total voltage signal when the concentration of the NOx gas is changed. A sensor response time curve is shown in FIG. 5 that indicates a sensor response time of 2.7 seconds when the NOx gas concentration is changed from 470 ppm to 940 ppm.
PUM
| Property | Measurement | Unit |
|---|---|---|
| vol. % | aaaaa | aaaaa |
| temperature | aaaaa | aaaaa |
| temperature | aaaaa | aaaaa |
Abstract
Description
Claims
Application Information
 - R&D
- Intellectual Property
- Life Sciences
- Materials
- Tech Scout
- Unparalleled Data Quality
- Higher Quality Content
- 60% Fewer Hallucinations
Browse by: Latest US Patents, China's latest patents, Technical Efficacy Thesaurus, Application Domain, Technology Topic, Popular Technical Reports.
© 2025 PatSnap. All rights reserved.Legal|Privacy policy|Modern Slavery Act Transparency Statement|Sitemap|About US| Contact US: help@patsnap.com


