
Automatic peak identification method

a peak identification and peak technology, applied in the field of analysis data, can solve problems such as spectral resolution decline, and achieve the effects of low computational intensity, minimal artifacts, and high resolution

Inactive Publication Date: 2007-05-15
COLLEGE OF WILLIAM & MARY
View PDF3 Cites 17 Cited by
  • Summary
  • Abstract
  • Description
  • Claims
  • Application Information

AI Technical Summary

Benefits of technology

[0007]This process yields a spectrum with high resolution and minimal artifacts. Furthermore, the process is not overly computational intensive, with low delay times required. A method that simply maximizes the likelihood function is likely to generate artifacts, while a method that only tests the hypothesis that a peak is present, without the subsequent maximization of the likelihood function, will yield a spectrum with decreased resolution.

Problems solved by technology

A method that simply maximizes the likelihood function is likely to generate artifacts, while a method that only tests the hypothesis that a peak is present, without the subsequent maximization of the likelihood function, will yield a spectrum with decreased resolution.

Method used


Image

  • Automatic peak identification method
  • Automatic peak identification method
  • Automatic peak identification method

Examples


Embodiment Construction

[0012]The following symbols are accorded the following meanings:[0013]N total number of data points in the window[0014]sj=s(tj) j=1 . . . N observed signal prior to any processing[0015]xj=x(tj) ideal wavelet shape[0016]ηj=η(tj) noise[0017]ση2=ηηT noise co-variance

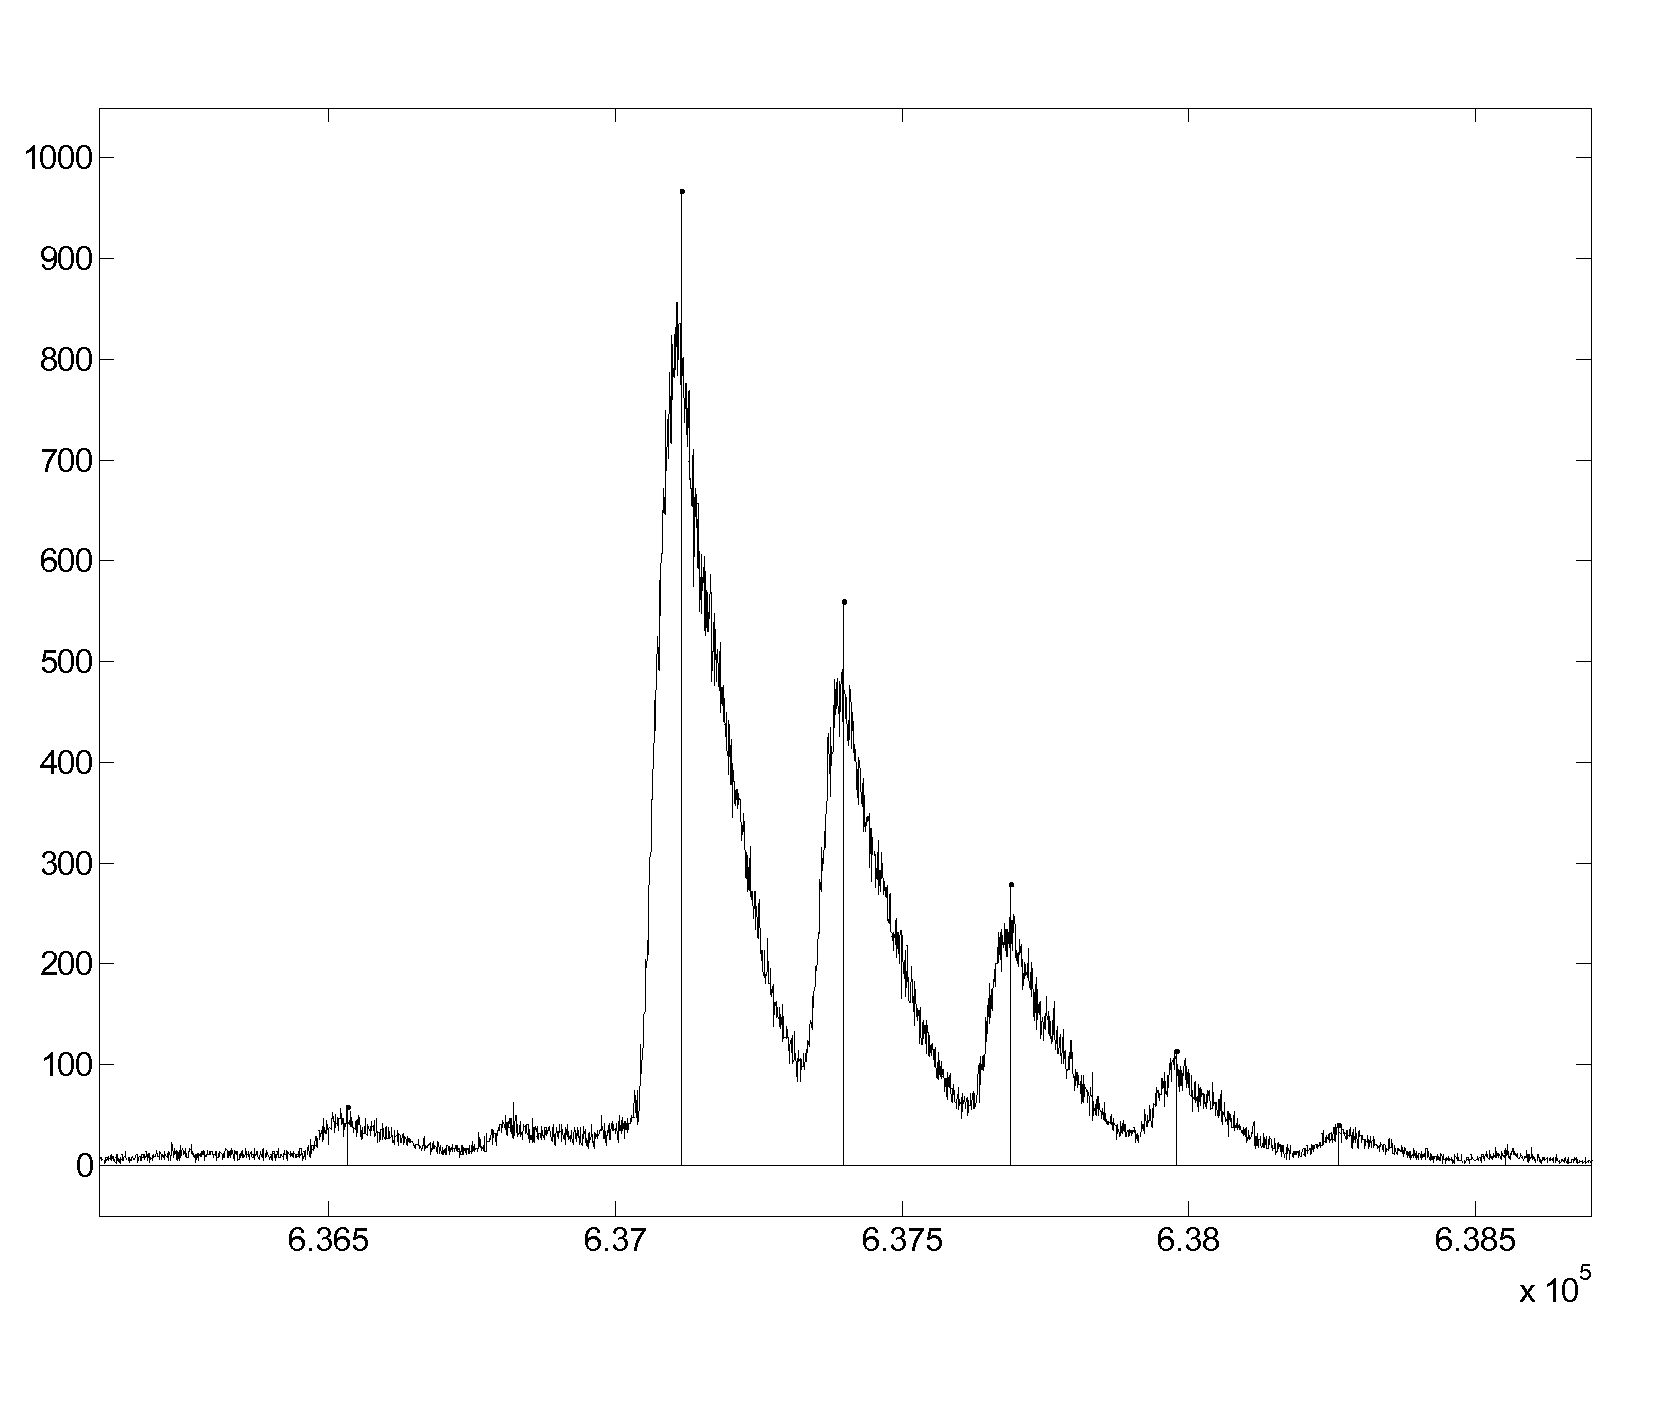
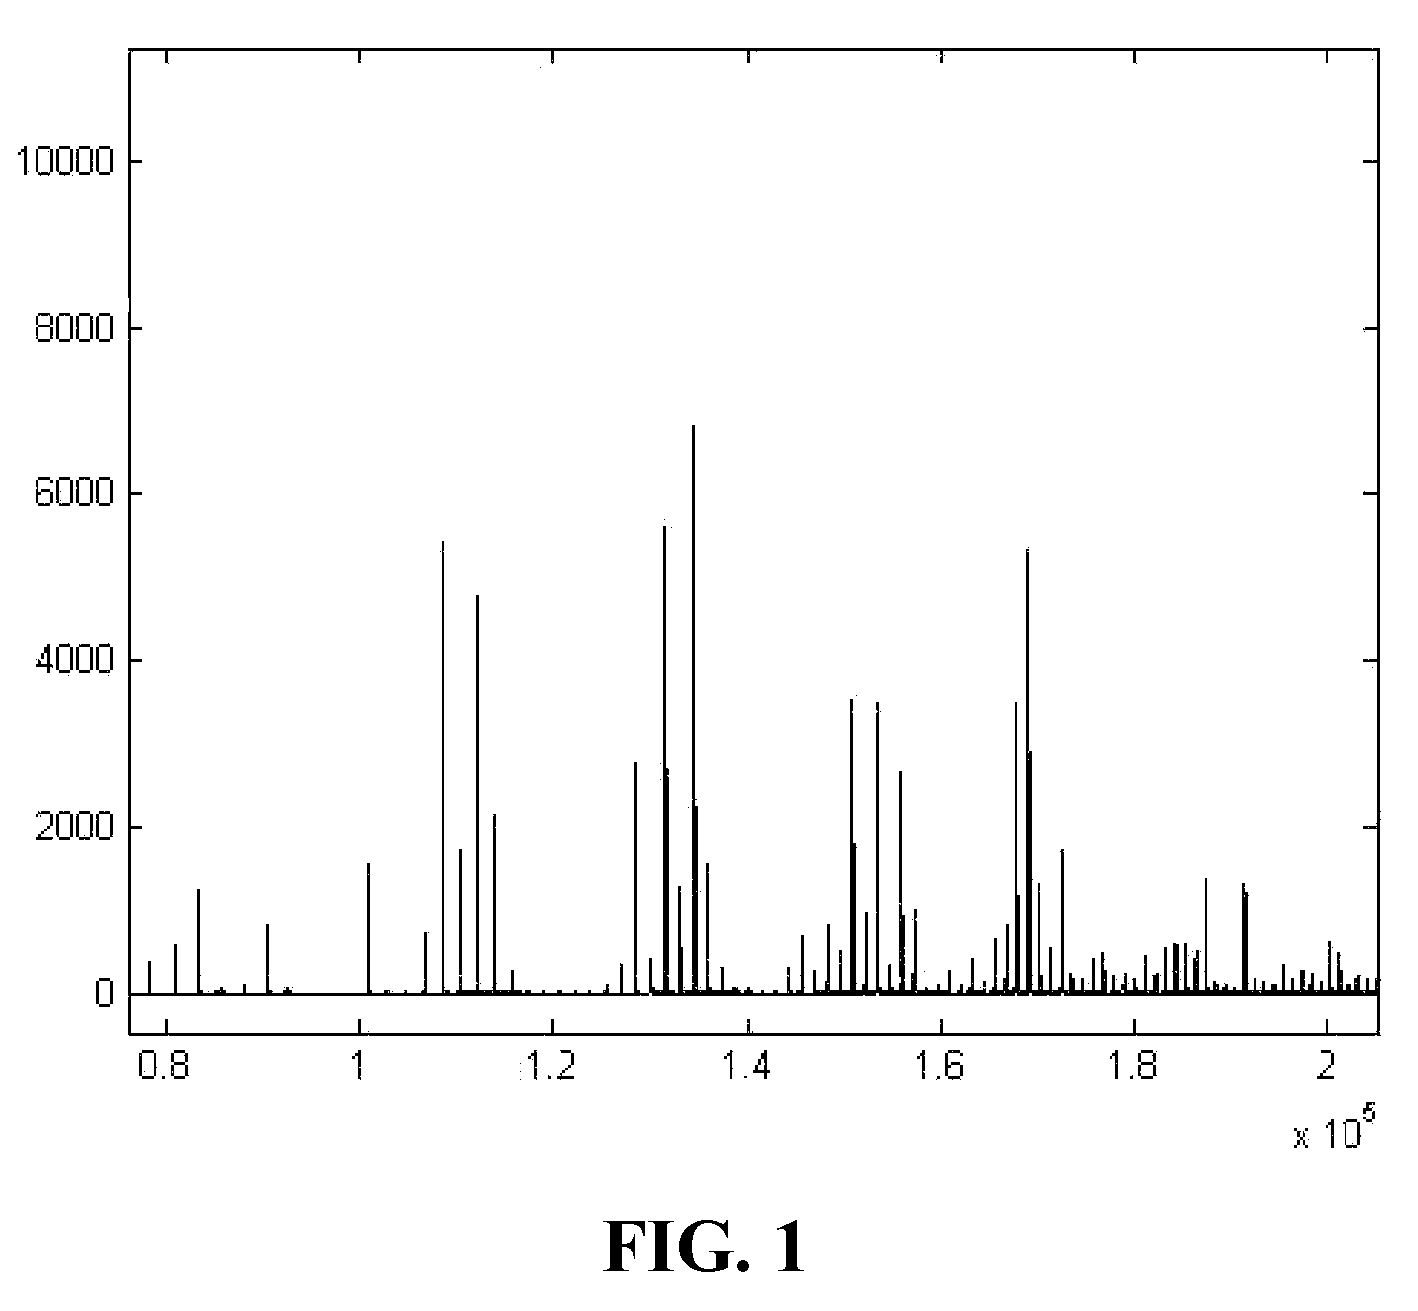
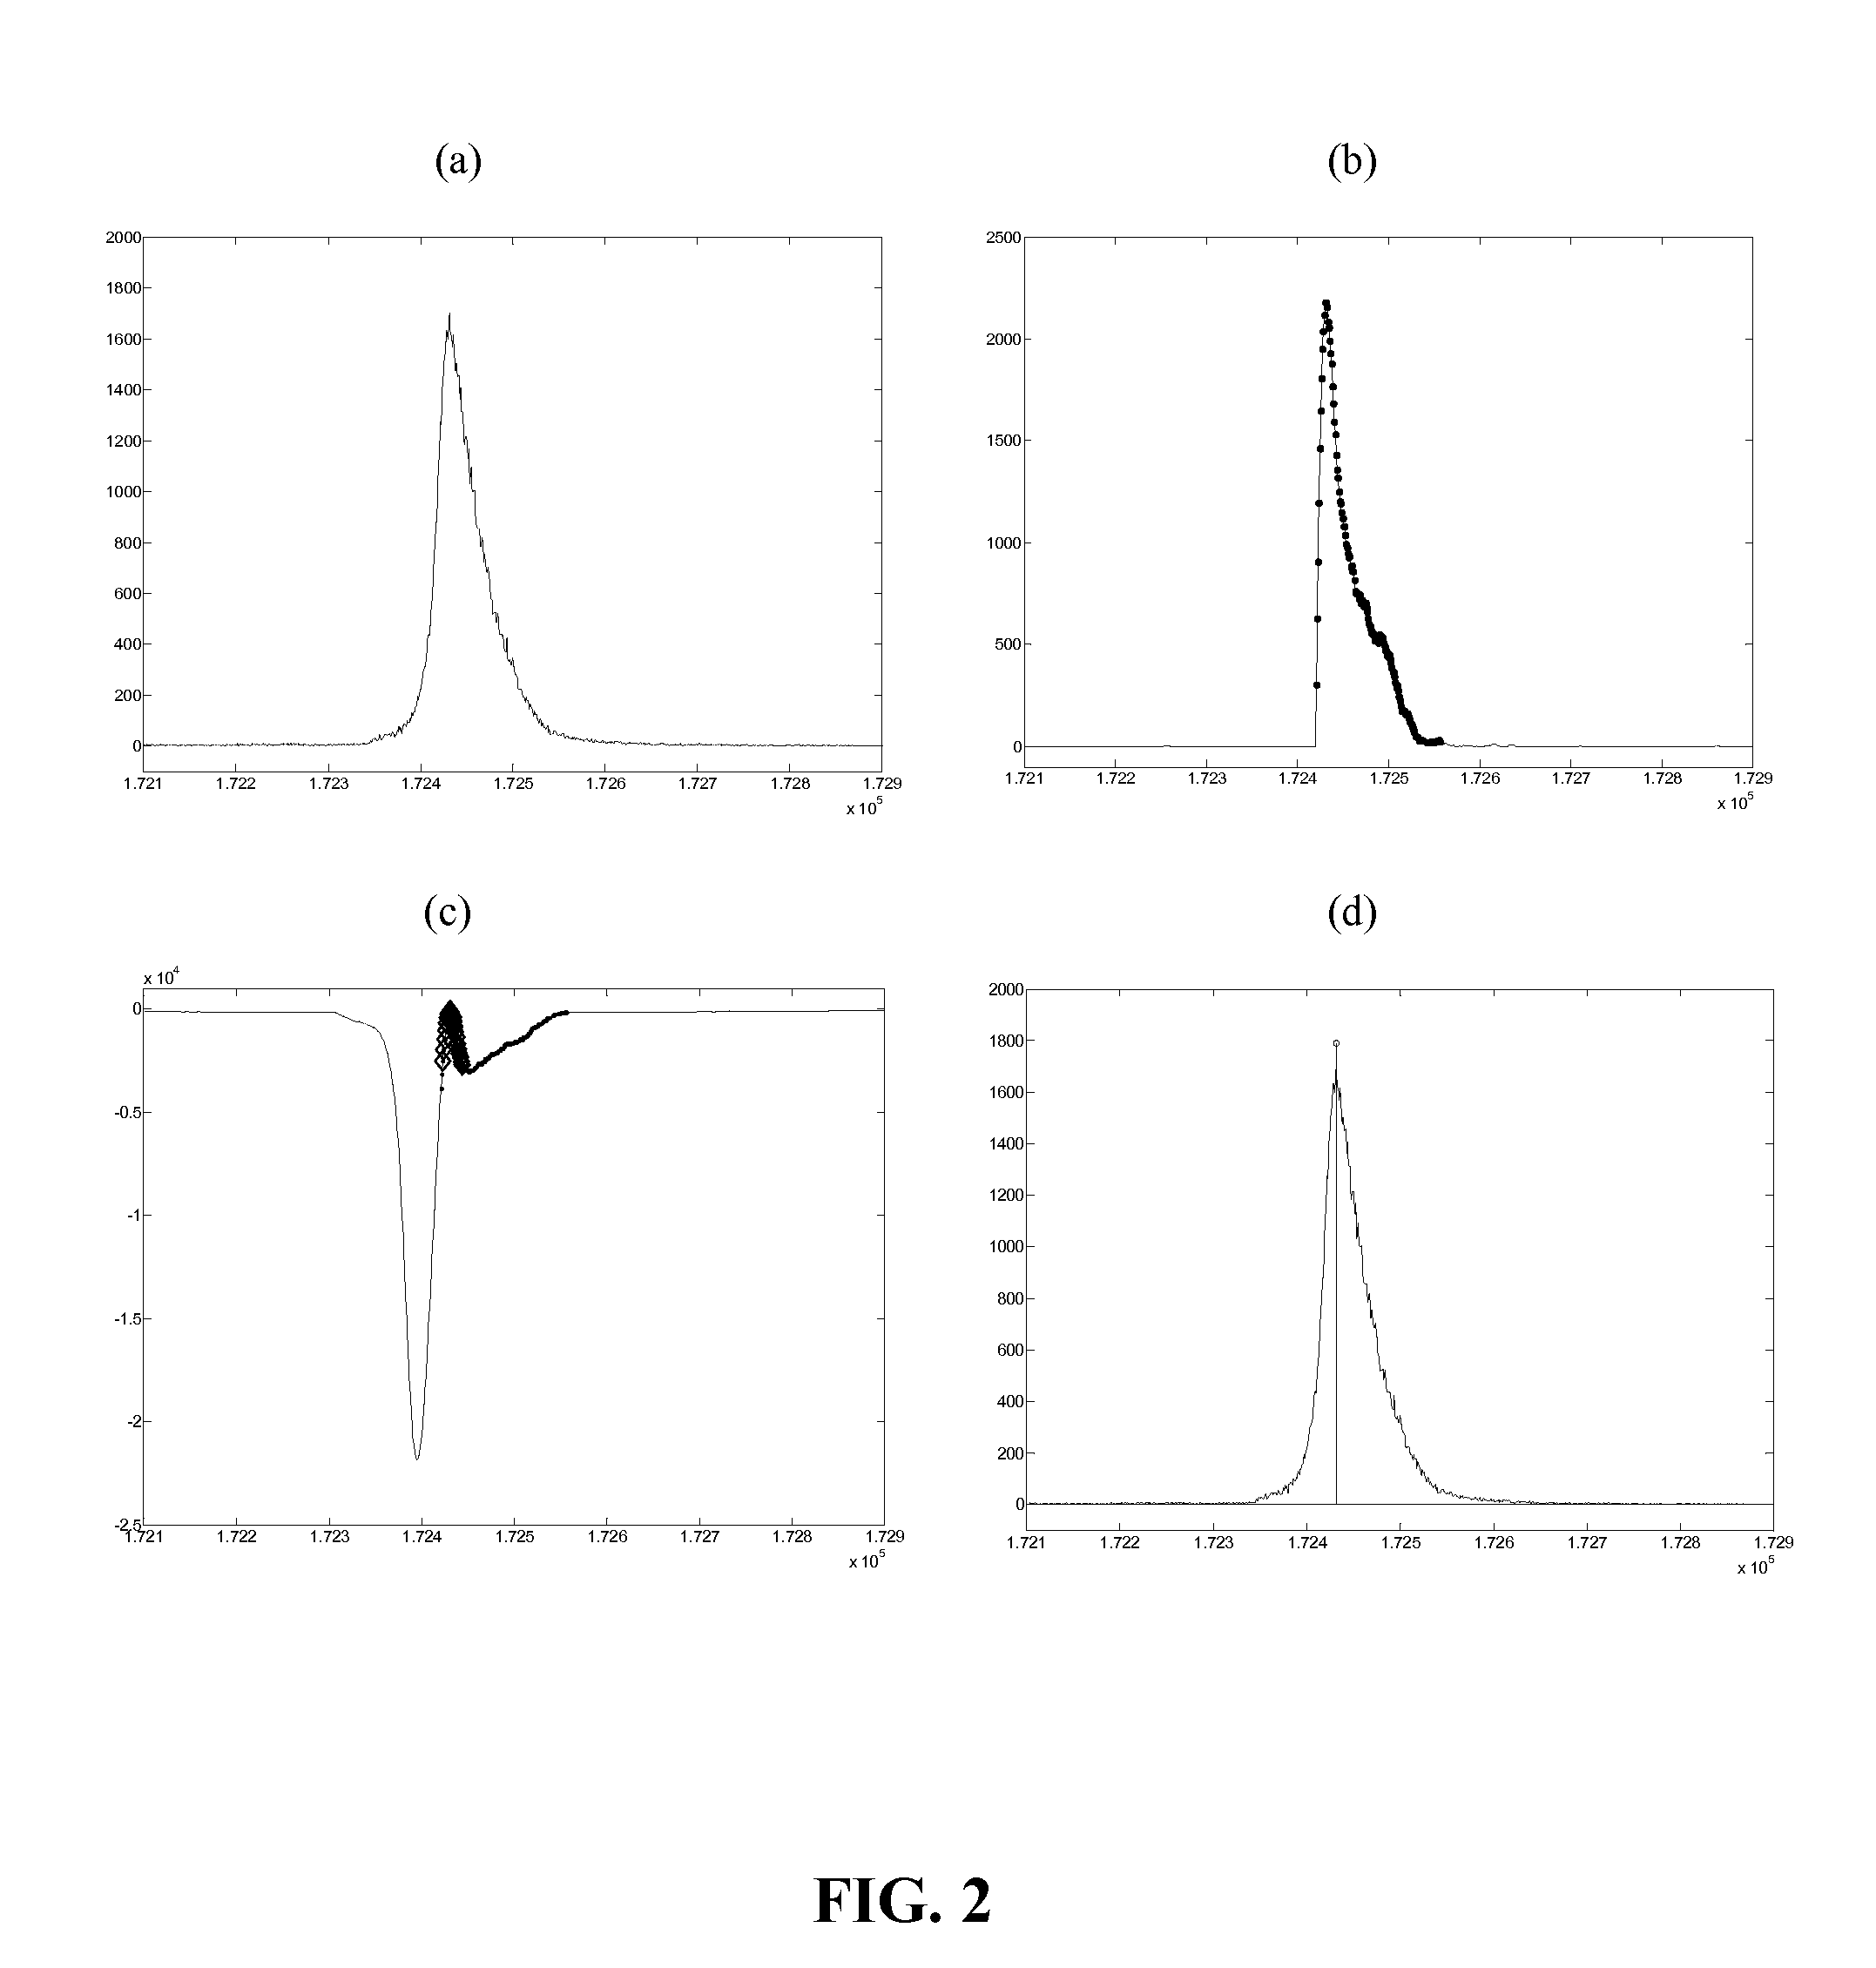
[0018]Herein we describe the use of Bayesian methods to automatically identify peaks in data sets. We start with a brief overview of the logic. The first step is to compare the hypotheses that there are a given number of peaks (i.e., 0, 1, 2, . . . n) in the observation window. If a peak is present, we then estimate its position and amplitude via parameter fitting.

[0019]After this summary of the logic, we develop algebras for two simple cases where Gaussian or Poisson noise is involved. Both of these cases are simple enough that all results can be arrived at in closed form. We first present how to derive a matched filter for a known peak shape that is embedded in additive white (Gaussian) noise of unknown amplitude. We then...


PUM


Abstract

The invention described herein details a protocol to improve analysis and peak identification in spectroscopic data. Bayesian methods are used to automatically identify peaks in data sets. After identifying peak shapes, the method tests the hypothesis that a given number of peaks is found within any given data window. If a peak is identified within a given window, then the likelihood function is maximized in order to estimate peak position and amplitude. This process yields a spectrum with high resolution and minimal artifacts. The method described herein is particularly useful for identifying peaks in data sets obtained from spectroscopy.

Description

CROSS-REFERENCE TO RELATED APPLICATIONS[0001]The present application claims priority from U.S. Provisional Application Ser. No. 60 / 664,010, filed Mar. 22, 2005.STATEMENT REGARDING FEDERALLY SPONSORED RESEARCH OR DEVELOPMENT[0002]This invention was made with government support under Grant No. 5R44 CA101479-03 awarded by NIH. The government has certain rights in the invention.BACKGROUND OF THE INVENTION[0003]The invention is related to the field of analyzing data which includes multiple peak data and, in particular, pertains to an automatic method for analyzing data which includes multiple peak data resulting in high resolution estimates.[0004]Work in chromatography, spectroscopy, engineering, pharmacology, and other fields frequently requires analysis of data sets exhibiting multiple peaks. Analysis of multi-peak data is particularly difficult when peaks overlap, or when data are noisy. Peak finding algorithms of many types are used to identify and interpret peaks and peak positions....

Claims


Application Information

Patent Timeline
Patent Type & Authority Patents(United States)
IPC IPC(8): G06F15/00G01J3/40
CPCG06K9/0053G06F18/00G06F2218/10
Inventor TRACY, EUGENE RCHEN, HAIJIANCOOKE, WILLIAM E
Owner COLLEGE OF WILLIAM & MARY
Learn More