
Monitoring and representing complex signals

a complex signal and signal technology, applied in the field of monitoring and analyzing complex signals, can solve the problems of difficult separation of these signals, inability to fully realistically represent the underlying signal source, and well-studied signals

Inactive Publication Date: 2007-08-07
SALK INST FOR BIOLOGICAL STUDIES
View PDF4 Cites 136 Cited by
  • Summary
  • Abstract
  • Description
  • Claims
  • Application Information

AI Technical Summary

Benefits of technology

[0015]In this way, the present invention enables improved methods and systems for analyzing complex signals and for separating component signals from a mixture of signals.

Problems solved by technology

However, separating independent signals that are part of a mixture of signals is a well-studied, but challenging area of signal processing.
For example, since its discovery in the 1920's, the study of electroencephalographic (EEG) data recorded from the human scalp has been frustrated by the fact that each scalp electrode receives the sum of electrical activities taking place in many different parts of the brain, and that separation of these signals is difficult to perform.
Although infomax ICA has been used to analyze EEG signals, it relies on several idealized assumptions about the underlying signal sources that may not be completely realistic.
In some operational settings, these idealized assumptions may limit the ability to adequately capture underlying complex spatio-temporal dynamics.

Method used


Image

  • Monitoring and representing complex signals
  • Monitoring and representing complex signals
  • Monitoring and representing complex signals

Examples


Embodiment Construction

[0047]Embodiments of the invention will now be described with reference to the accompanying Figures, wherein like numerals refer to like elements throughout. The terminology used in the description presented herein is not intended to be interpreted in any limited or restrictive manner, simply because it is being utilized in conjunction with a detailed description of certain specific embodiments of the invention. Furthermore, embodiments of the invention may include several novel features, no single one of which is solely responsible for its desirable attributes or which is essential to practicing the inventions herein described.

[0048]According to one embodiment, the invention comprises specialized processing methods, termed herein “complex ICA” or “complex independent component analysis” for determining independent signals from a mixture of signals, thus isolating a signal or a signal component from the mixture of signals. Typically, the mixture of signals is received from a plurali...


PUM


Abstract

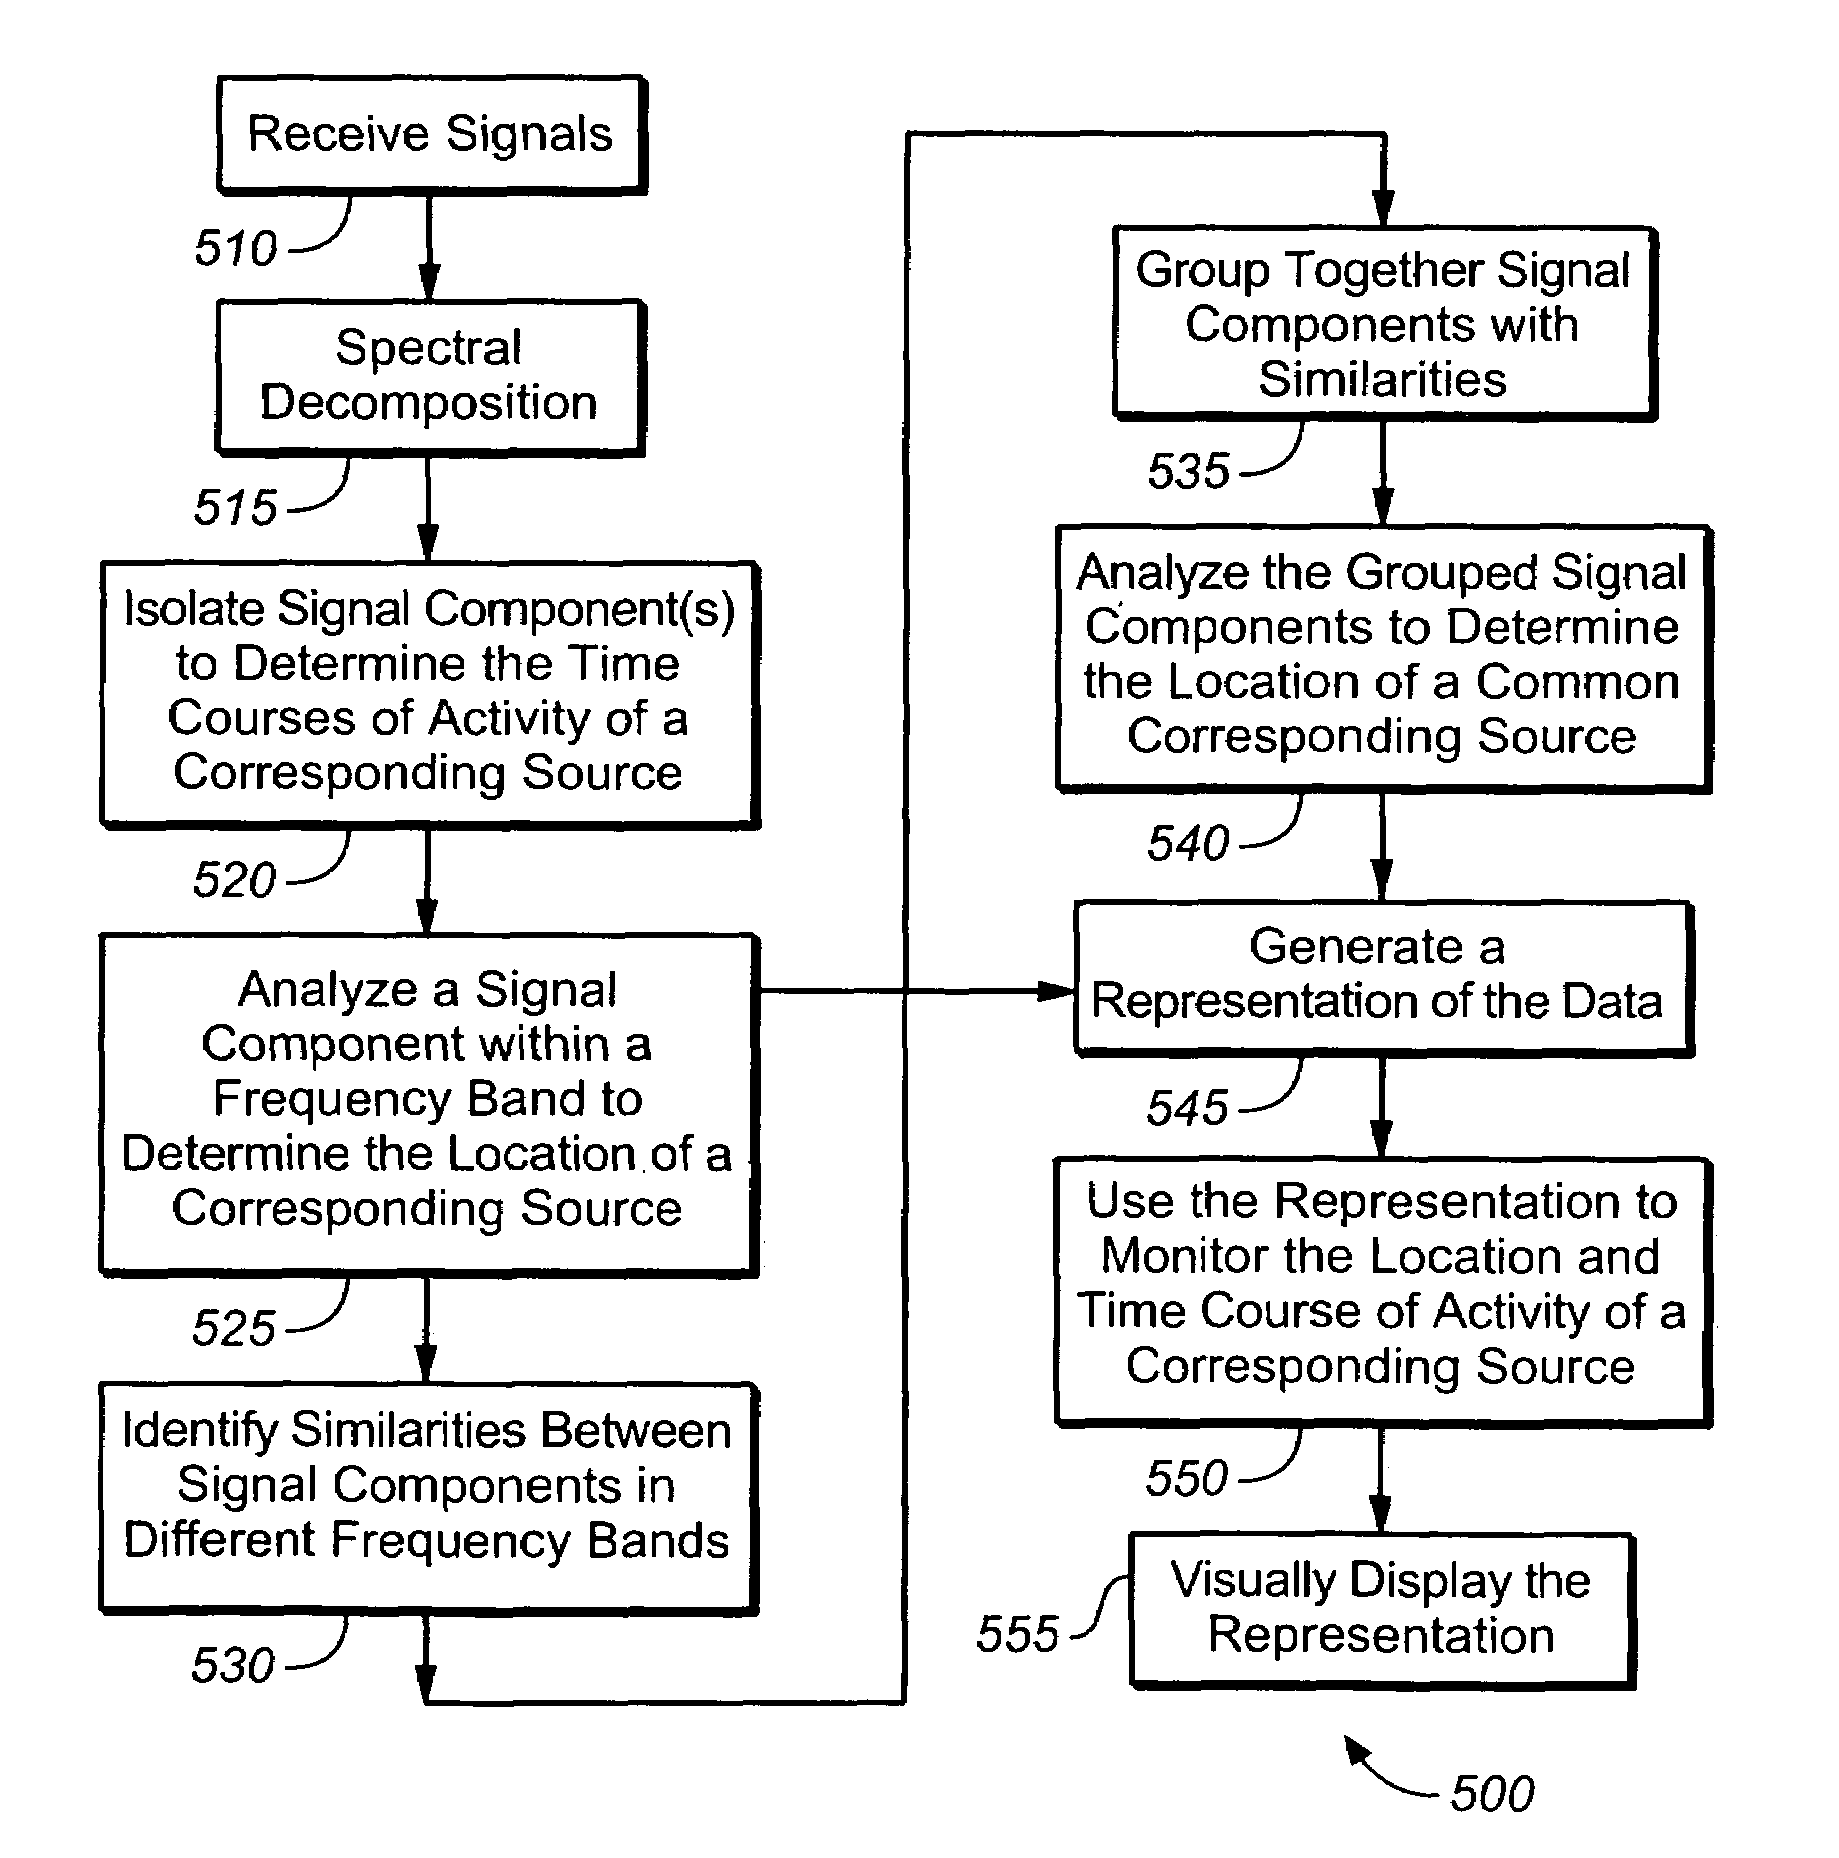
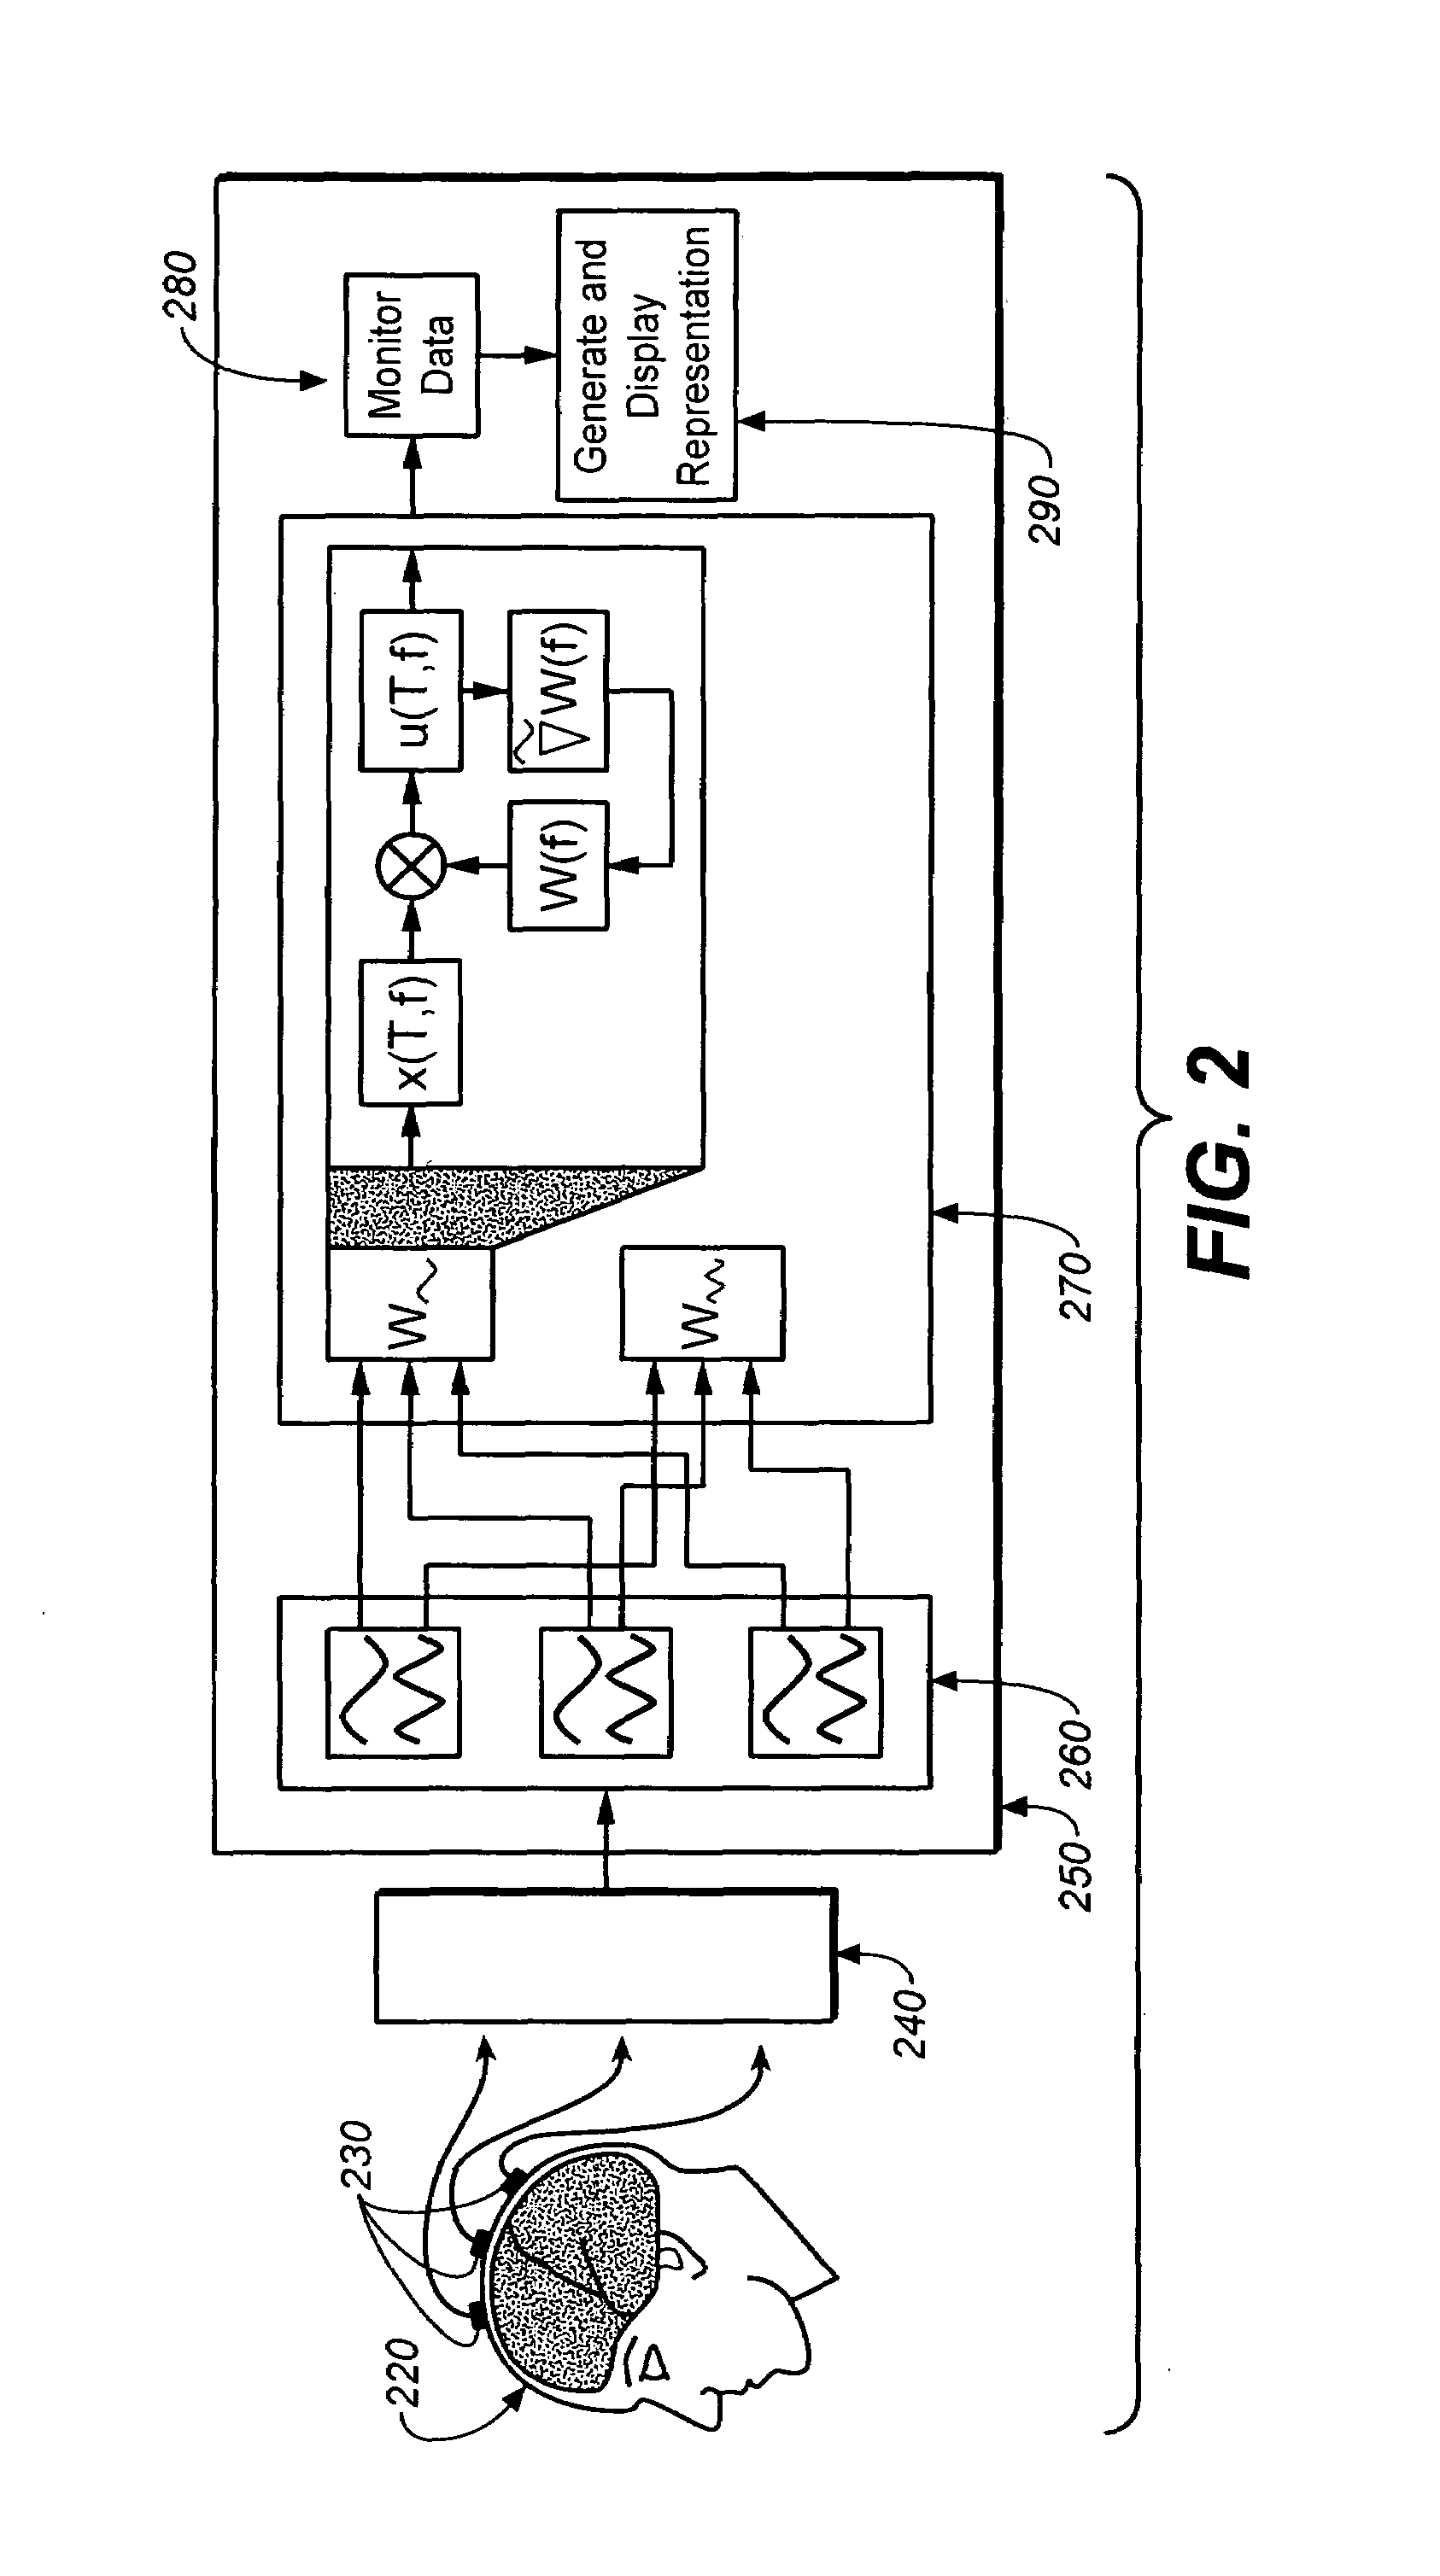
A method of displaying signals containing a spatial and a temporal aspect, where multiple signals are received by multiple sensors. The received signals are decomposed into separate signal components within one or more distinct frequency bands. Signal components are isolated within each frequency band based on differences between the signal components within the same frequency band, and the signal components are displayed. The signal components may be analyzed to determine a time course of activity and a location of the associated source. Representations of the source may also be generated and displayed to aid in monitoring the signals.

Description

CROSS-REFERENCE TO RELATED APPLICATIONS[0001]This application claims the benefit of provisional application 60 / 459,930, filed Mar. 31, 2003, and incorporated herein in its entirety by reference.GOVERNMENTAL INTEREST[0002]This invention was made with support under grant number 1R01MH / RR61619-01 from the National Institutes of Health. The Government may have rights in this invention.BACKGROUND OF THE INVENTION[0003]1. Field of the Invention[0004]This invention relates to monitoring and analyzing complex signals, and in particular, to separating and displaying the independent signal components of complex signals from a signal source.[0005]2. Description of the Related Art[0006]There are many reasons why it is useful to separate specific signals from a mixture of signals. For example, one may wish to separate a single speaker from a mixture of sound signals. In another instance, a physician may wish to isolate and study a single signal from an organ from other signals generated by the s...

Claims


Application Information

Patent Timeline
Patent Type & Authority Patents(United States)
IPC IPC(8): G01R23/00A61B5/374G06K9/00G06K9/62
CPCA61B5/048G06K9/0057G06K9/624A61B5/726A61B5/374G06F2218/22G06F18/2134
Inventor MAKEIG, SCOTTANEMULLER, JORN
Owner SALK INST FOR BIOLOGICAL STUDIES
Learn More