Visualization and analysis of user clickpaths

a user and clickpath technology, applied in the field of visualizing and analysing user clickpaths, can solve the problems of incomplete solution and rudimentary analysis of user navigation on the web

Active Publication Date: 2007-10-02
OPEN TEXT SA ULC
View PDF77 Cites 259 Cited by
  • Summary
  • Abstract
  • Description
  • Claims
  • Application Information

AI Technical Summary

Problems solved by technology

Yet, despite the proliferation of web sites, analysis of user navigation on the web has remained rudimentary.
The mystery as to “where customers are going” and “what causes a purchase” is especially problematic for commercial sites, which face a desperate battle to improve browser-to-buyer conversion rates, increase revenue from transactions, and deliver meaningful content before the user departs.
Therefore, making sense of user clickstreams has become a key problem area for data mining.
Clickstream analysis or what some have termed “Web usage mining” presents a series of difficulties ranging from the manipulation of unprecedented amounts of data (hundreds of times the volume of off-line sources), to analysis techniques, and finally visualization.
Some results have been reported, but the work does not provide a complete solution to the problem.
Although the idea of using graphing to represent clicktrails has been recognized in previous work, it has not been attempted on a large scale, it has not utilized significance testing to determine which addresses and relationships should be visible on the graph, nor has it combined this with graph layout optimization.
Graphing clicktrails from large sites presents a range of challenges that the prior art has not addressed.

Method used


Image

  • Visualization and analysis of user clickpaths
  • Visualization and analysis of user clickpaths
  • Visualization and analysis of user clickpaths

Examples


example 1

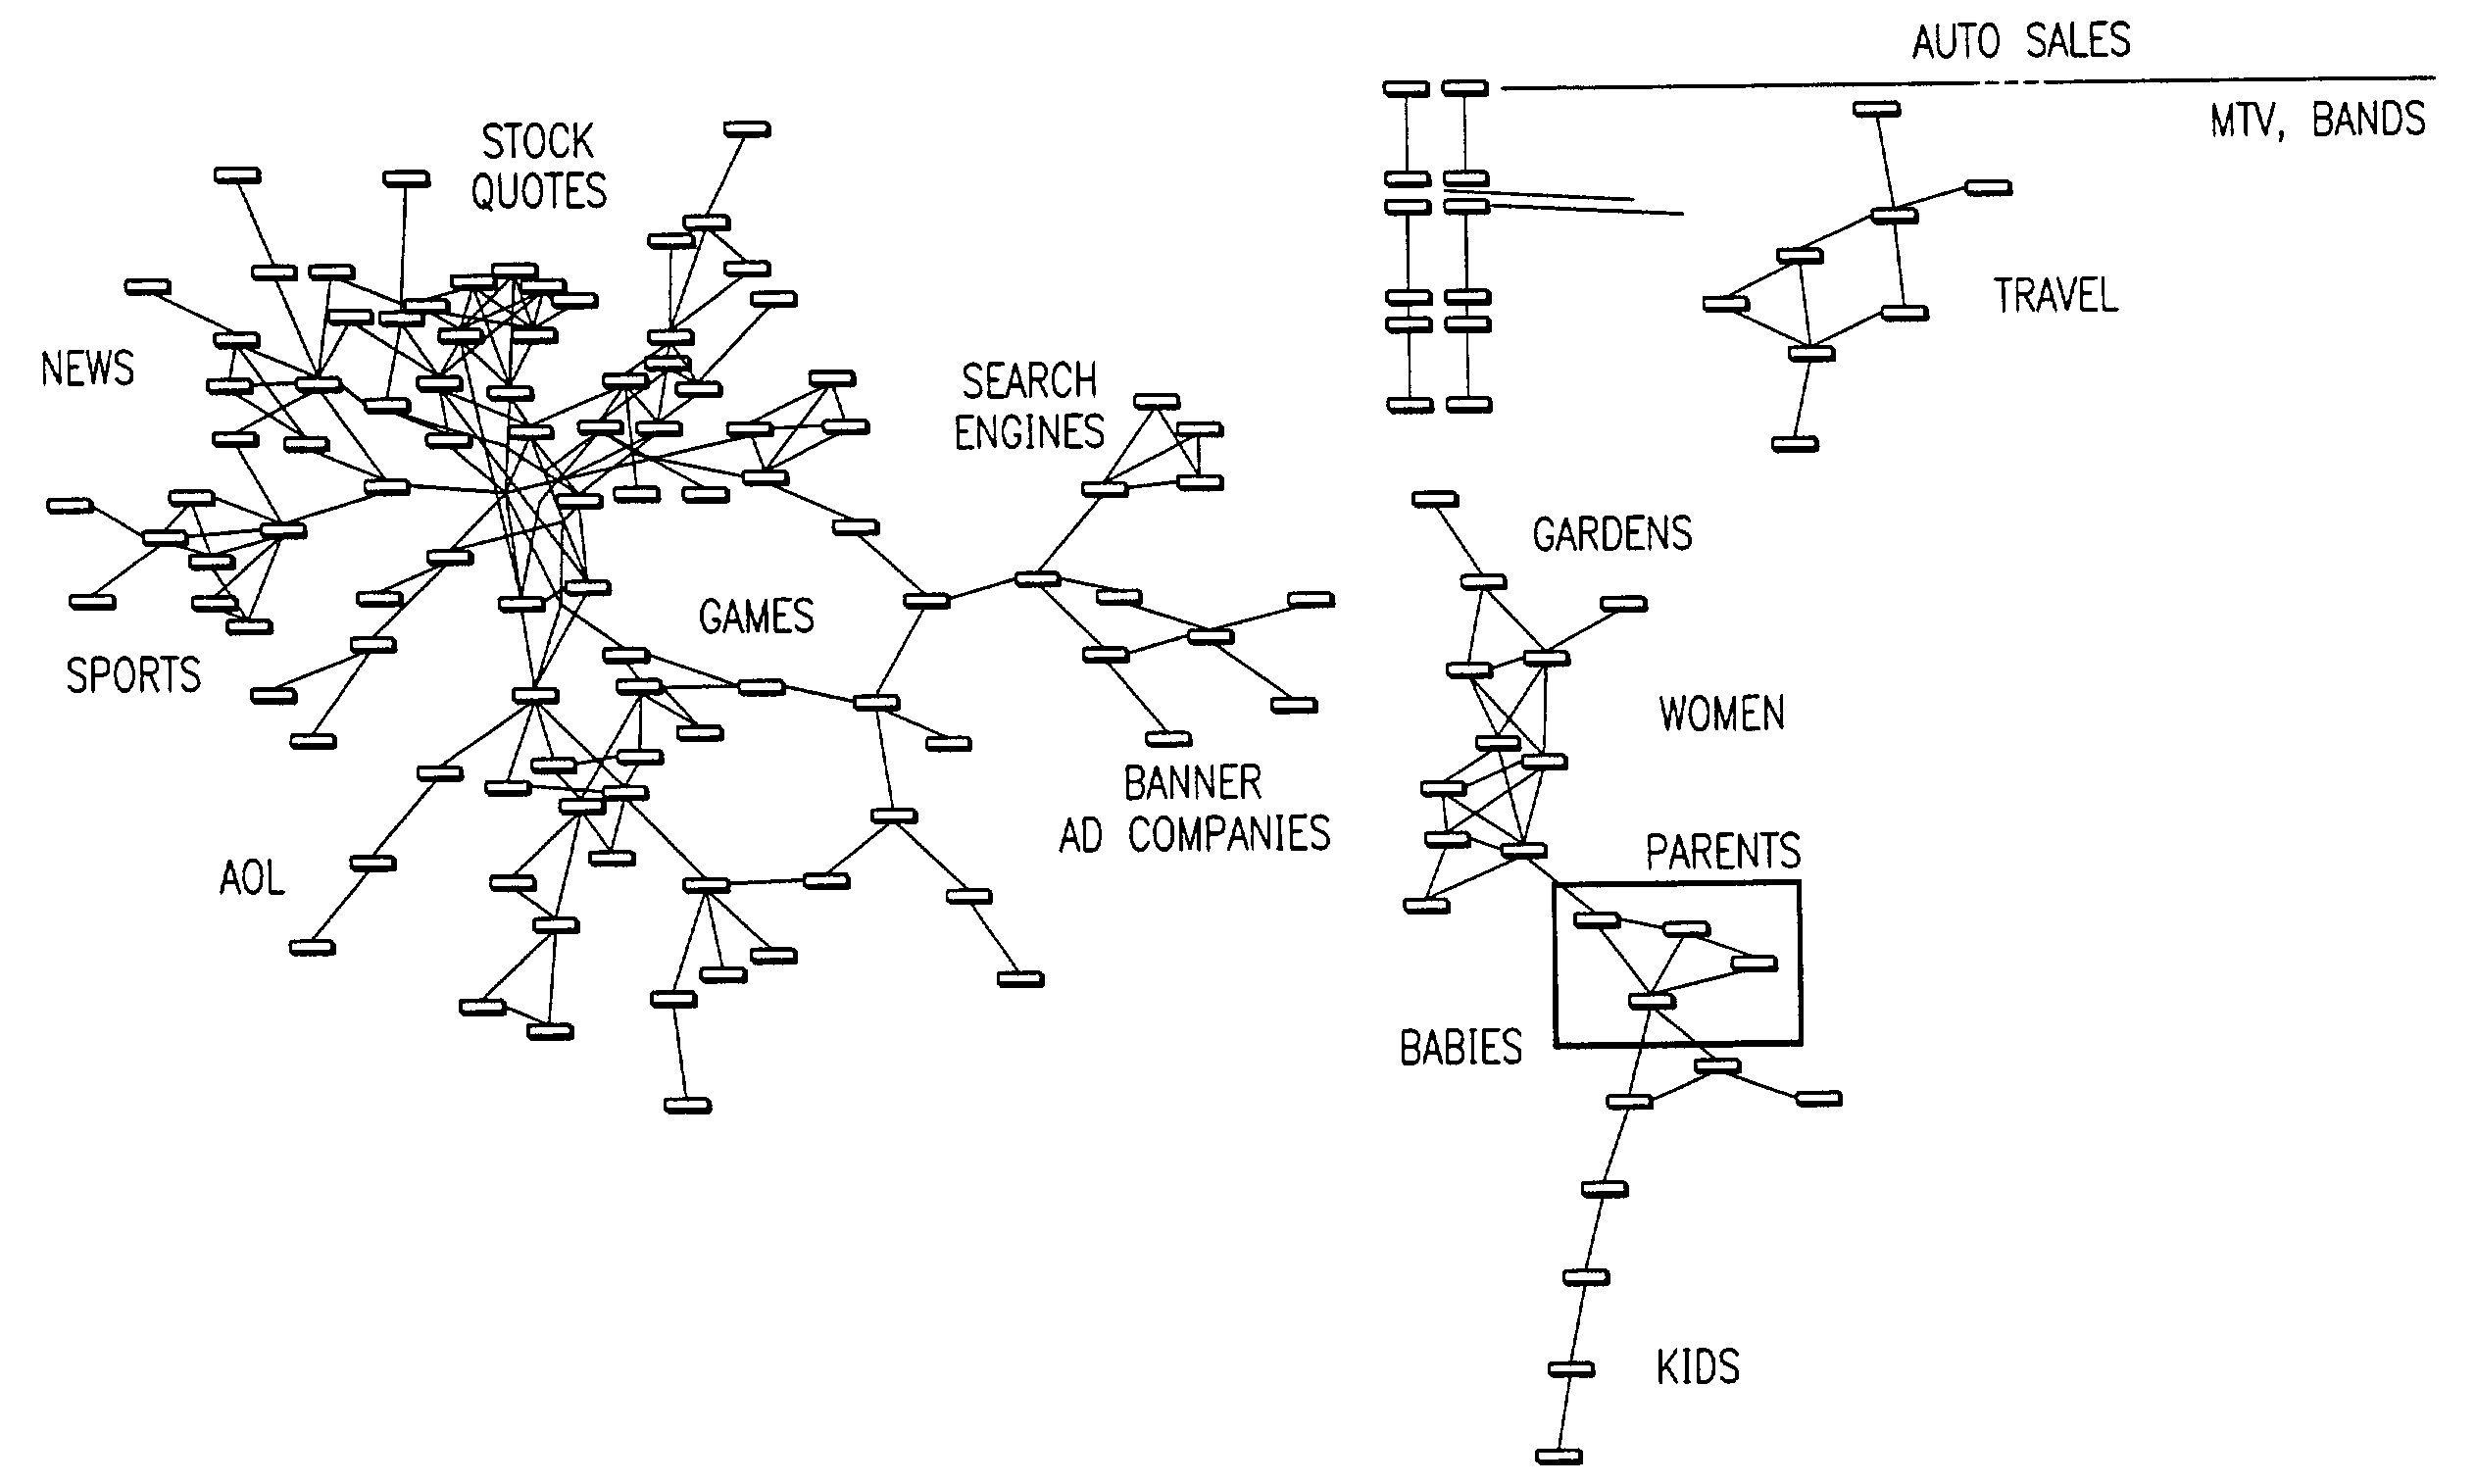
[0102]A first example may use clickstream data (one month, approximately 720 sites and 720 million network site address requests) provided by an advertising company. Using non-temporal affinities, a map of the resulting patterns of navigation across the World Wide Web (or network) can be constructed. Data used in generating FIG. 7 can be restricted to the highest 500 lifts, and network site addresses having more than 100,000 requests per month. As the weak links drop away, a fascinating graph may be produced.

[0103]The graph may be partitioned into several regions with similar content as seen in FIG. 9. In the left-hand portion of the graph, a large group of connected network addresses are orientated around News, Sports, AOL, Games, Stock quotes, and Search engines. In the right-hand portion, a variety of isolated groups, including a Travel group, Music, Auto sales, French language, and Parenting / Kids group may be seen.

[0104]FIG. 10 includes an enlarged view of the parenting area. Th...

example 2

[0108]A second example of a graph is shown in FIG. 11. FIG. 11 shows a network site partitioned into roughly seven regions. These may be labeled Auction, Frequent Buyers' Club, Free offers, Clearance sale network addresses, Inventory addresses, Search addresses, and Basket add / delete / order addresses. The Clearance hub and Searching addresses are closely associated with the Inventory addresses. A star-shaped area is obtained and has the main clearance sale network address at the center, and clearance-sale-category addresses fanning out in a circle around this main network address. Below this is the Inventory hub. Each of these regions may be investigated in more detail.

[0109]Within the Search addresses, a triangle indicates a recurrent link, which can occur by activating a “refresh” button on a browser. The next site a user visits after a search is often another search. The names of the products may be misleading or illogically indexed from an average user's point of view if successi...


PUM


Abstract

Methods and data processing system readable media have been created to graph user clickstream data over a network or at a network site to yield meaningful and visually esthetic information. In one set of embodiments, the method can comprise (i) performing a significance test on data from a network log and generating significance results. The method can also comprise (ii) determining which of network addresses and clicktrails between network addresses meet a traffic flow criterion. The data that meet a significance criterion, traffic criterion, or both can form (iii) graphable addresses and relationships. The method can further comprise (iv) generating statistics about the graphable addresses and relationships. The method can still further comprise (v) generating a graph based on the statistics about the graphable addresses and relationships, and (vi) changing any or all of the traffic flow, significance criterion, and statistics being computed, and regenerating the graph.

Description

RELATED APPLICATIONS[0001]This application claims priority under 35 U.S.C. § 119(e) to U.S. Provisional Patent Application Nos. 60 / 308,075, entitled “Visualization and Analysis of User Clickpaths” by Kitts filed Jul. 26, 2001, and 60 / 226,798, entitled “Method and System for Graphically Representing Customer Affinities” by Kitts, filed Aug. 21, 2000, and claims priority under 35 U.S.C. § 120 to U.S. patent application Ser. No. 09 / 934,415, entitled “A System and Method For Graphically Analyzing Product Interactions” by Kitts, filed Aug. 21, 2001, which claims priority from U.S. Provisional Patent Application No. 60 / 226,798, entitled “Method and System for Graphically Representing Customer Affinities” by Kitts, filed Aug. 21, 2000. This application is also related to U.S. patent application Ser. No. 10 / 202,742, entitled “Network Real Estate Analysis” by Kitts, filed July 25, 2002. All applications listed in this paragraph are assigned to the current assignee hereof and are incorporated...

Claims


Application Information

Patent Timeline
Patent Type & Authority Patents(United States)
IPC IPC(8): G06F15/173B03B1/00
CPCH04L67/22H04L67/535
Inventor KITTS, BRENDAN J.
Owner OPEN TEXT SA ULC
Why Eureka
Try Eureka