

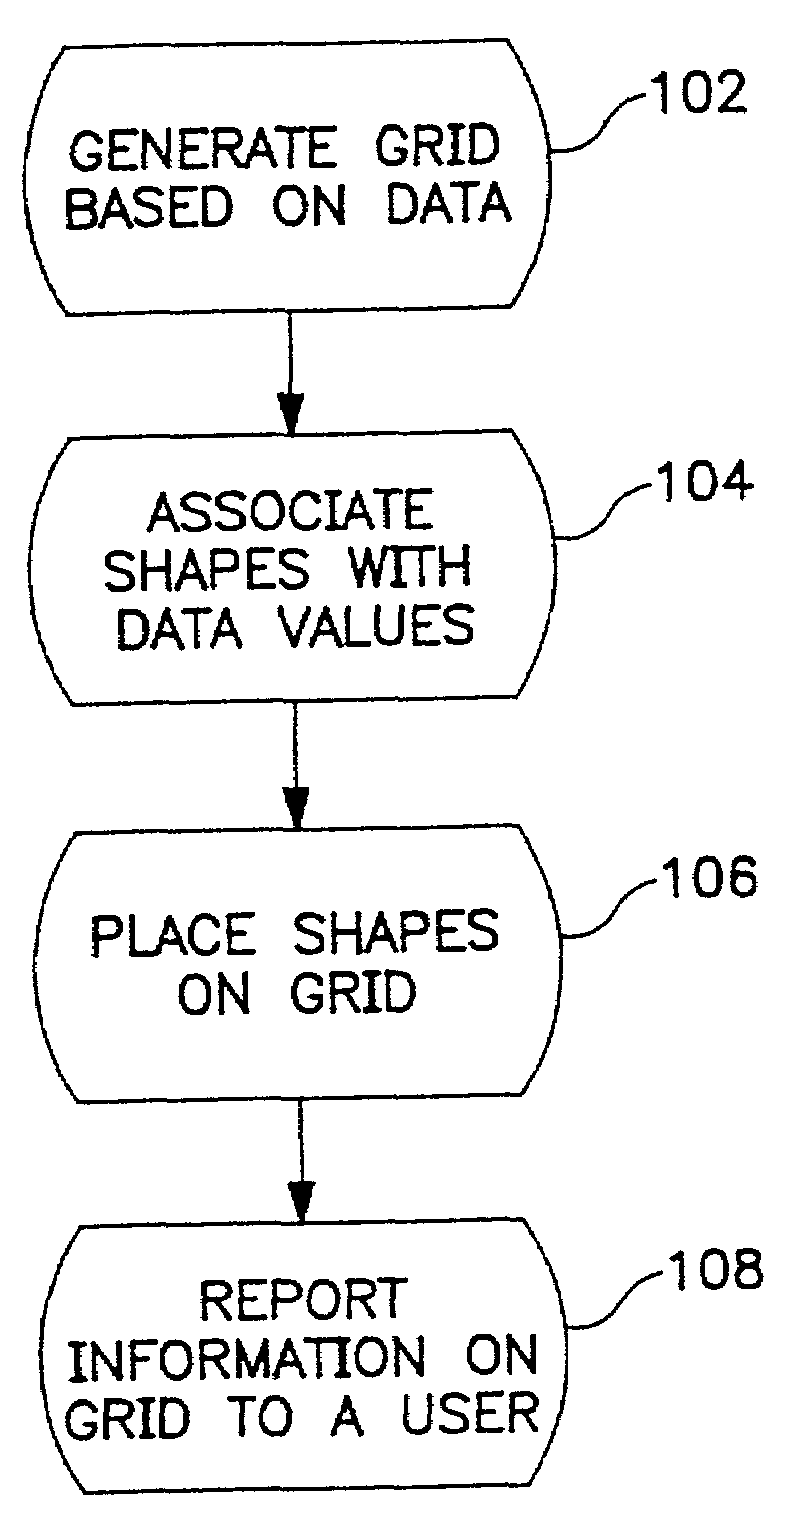
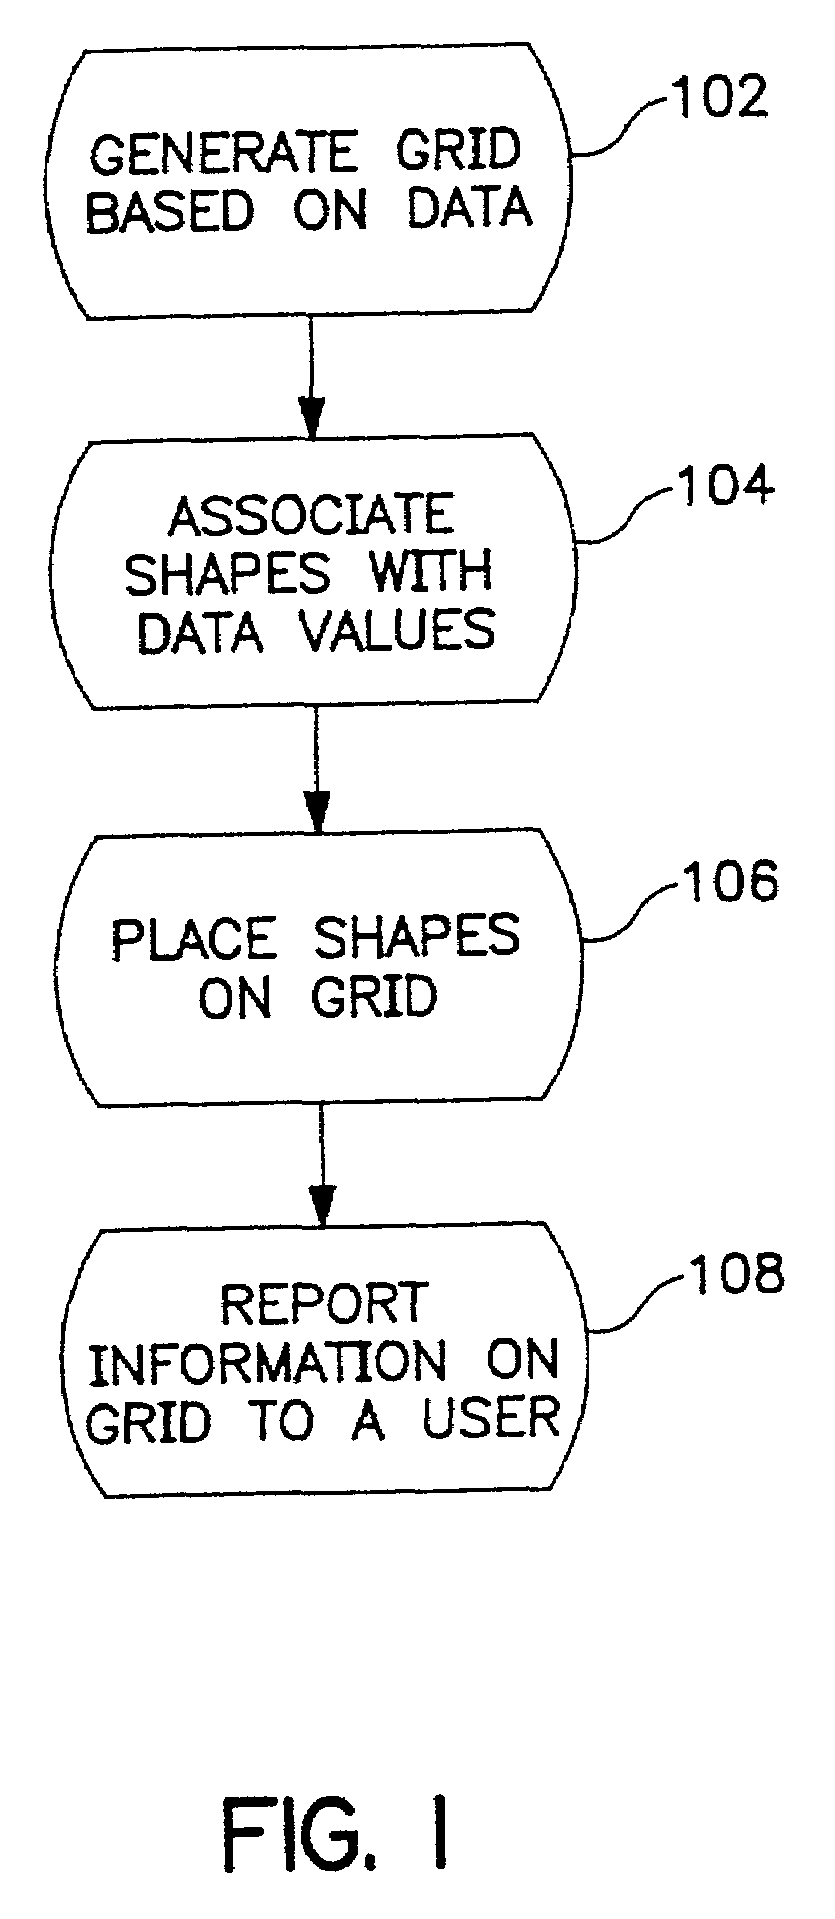
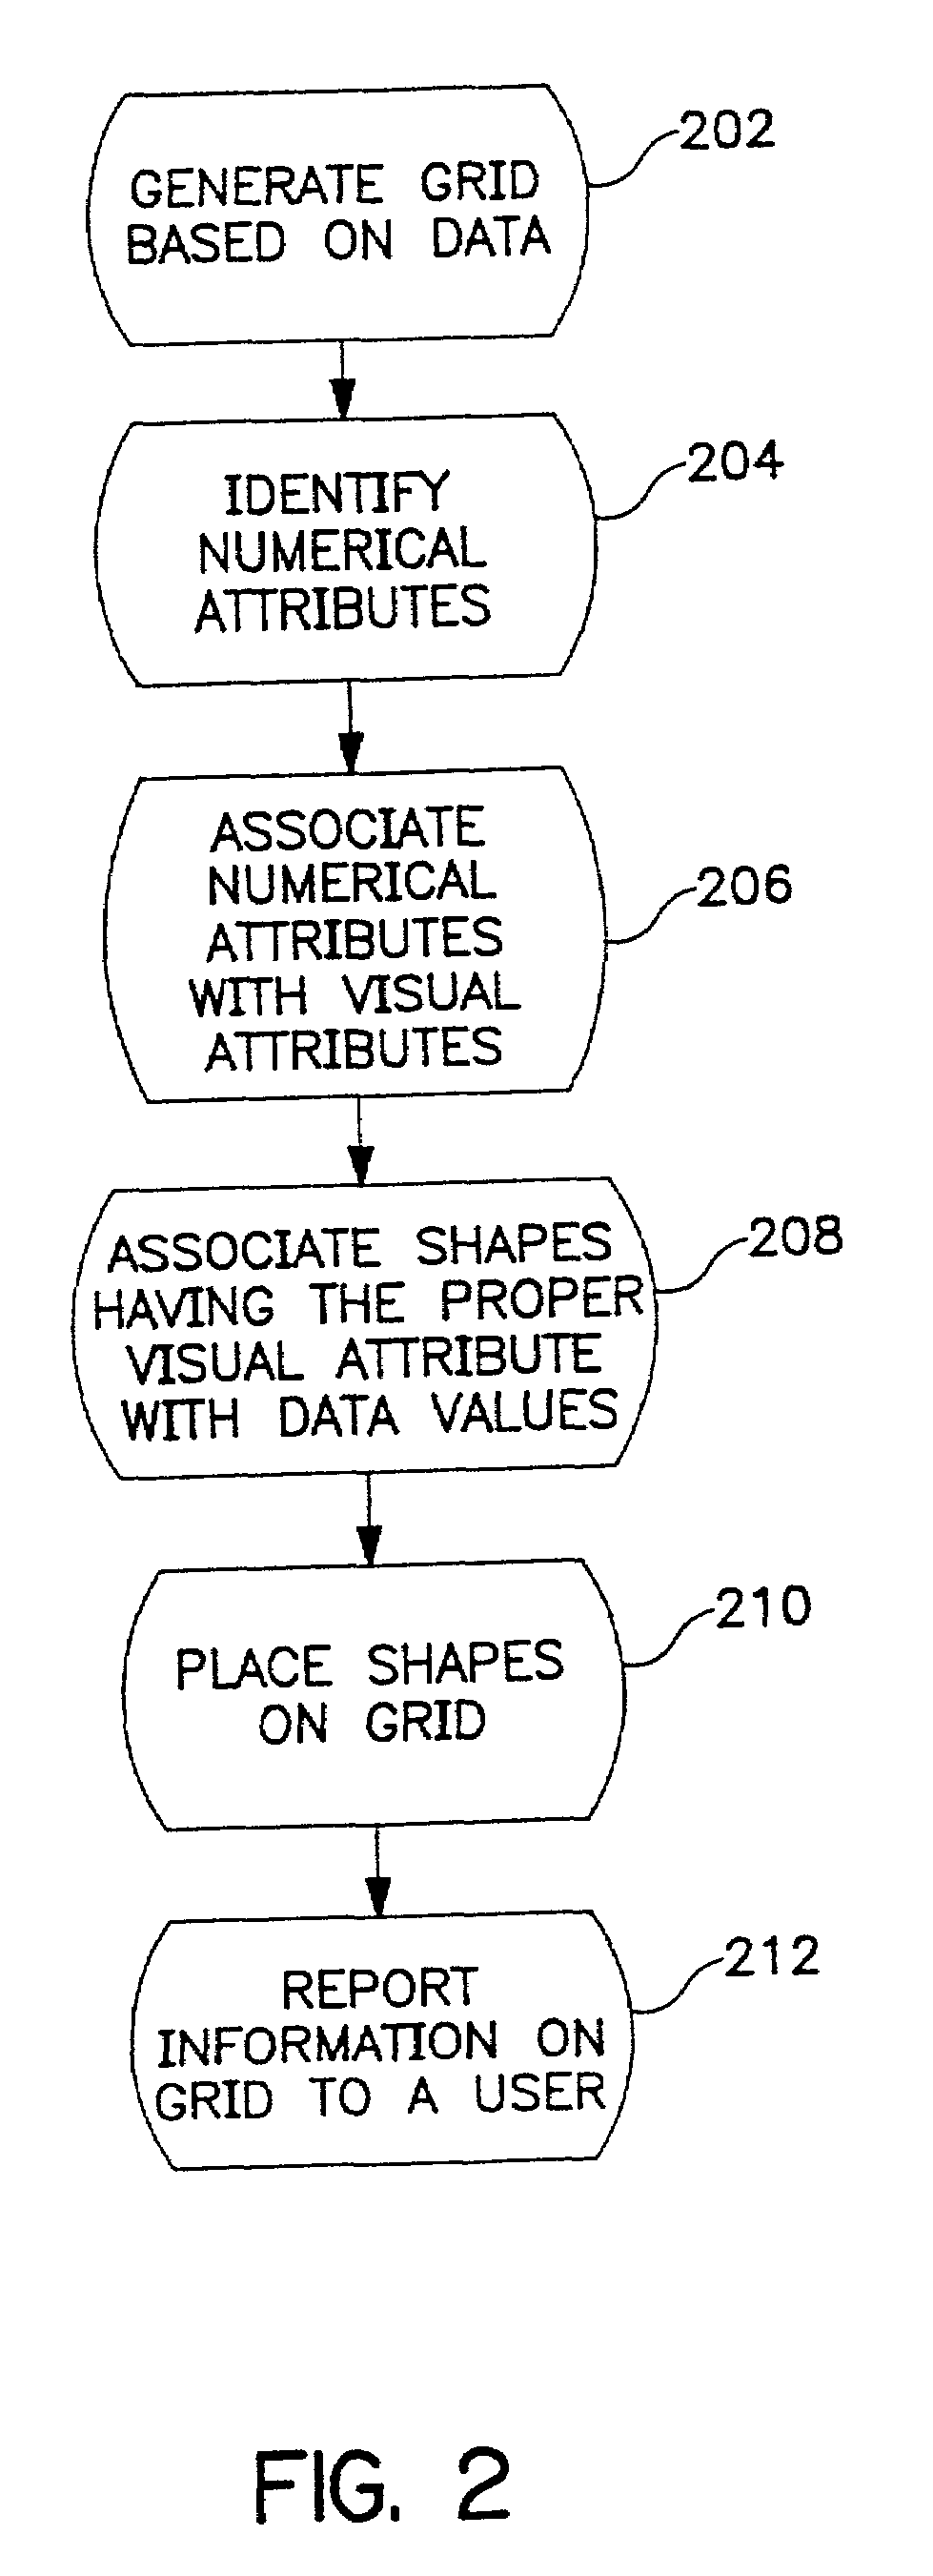
Method for visualizing data
- Summary
- Abstract
- Description
- Claims
- Application Information
AI Technical Summary
Benefits of technology
Problems solved by technology
Method used
Image

Examples
example
[0038]The following example is included to more clearly demonstrate the overall nature of the invention: a method for visualization of numerical matrices. The entries of the matrices may include multi-dimensional, linear, and / or non-linear numerical expressions. This example is exemplary, not restrictive, of the invention.
[0039]Matrices are useful constructs both in theoretical and applied mathematical analysis. Specifically, in the field of dynamical systems matrices are useful in the course of both “steady-state” (time independent) and “dynamic” (time dependent) analysis. Both steady-state and dynamic analyses may be performed in relation to dynamic systems arising in the fields of electrical, hydraulic, thermal, and mechanical engineering.
[0040]Kirchoff's Current Law (KCL) is a specific example from circuit analysis. KCL is a conservative law which states that the sum of the currents “entering” and “exiting” a node in an electrical network equals zero. A node is defined as the ju...
PUM
 Abstract
Description
Claims
Application Information