Dynamic control of graphic representations of data

a technology of dynamic control and data, applied in the field of display of graphical information, can solve the problems of data scaling, data scaling, data legibility, etc., and achieve the effect of maintaining legibility and data legibility

Active Publication Date: 2008-05-06
THE MATHWORKS INC
View PDF6 Cites 28 Cited by
  • Summary
  • Abstract
  • Description
  • Claims
  • Application Information

AI Technical Summary

Benefits of technology

[0006]There is a need for control of a graphical display of one or more series of data to provide for ease of viewing of the data and optional comparison among multiple series of data. The present invention is directed toward further solutions to address this need. The present invention may be useful in the design of any type of graphical display of data in which the display involves at least one axis.

Problems solved by technology

When multiple series of data are to be displayed on the same graph, scaling can become more difficult.
Improper scaling of the data can hide variations in the data.
The need to fit all the data onto the same graph, while maintaining legibility of the data, can become difficult with many data series.
However, these graphical displays can be difficult to read and to create.
Typically, these plots cannot be interactively manipulated.
Once created, the same parameter file is often used for similar data, as the effort required to change the parameter file is substantial.

Method used


Image

  • Dynamic control of graphic representations of data
  • Dynamic control of graphic representations of data
  • Dynamic control of graphic representations of data

Examples


Embodiment Construction

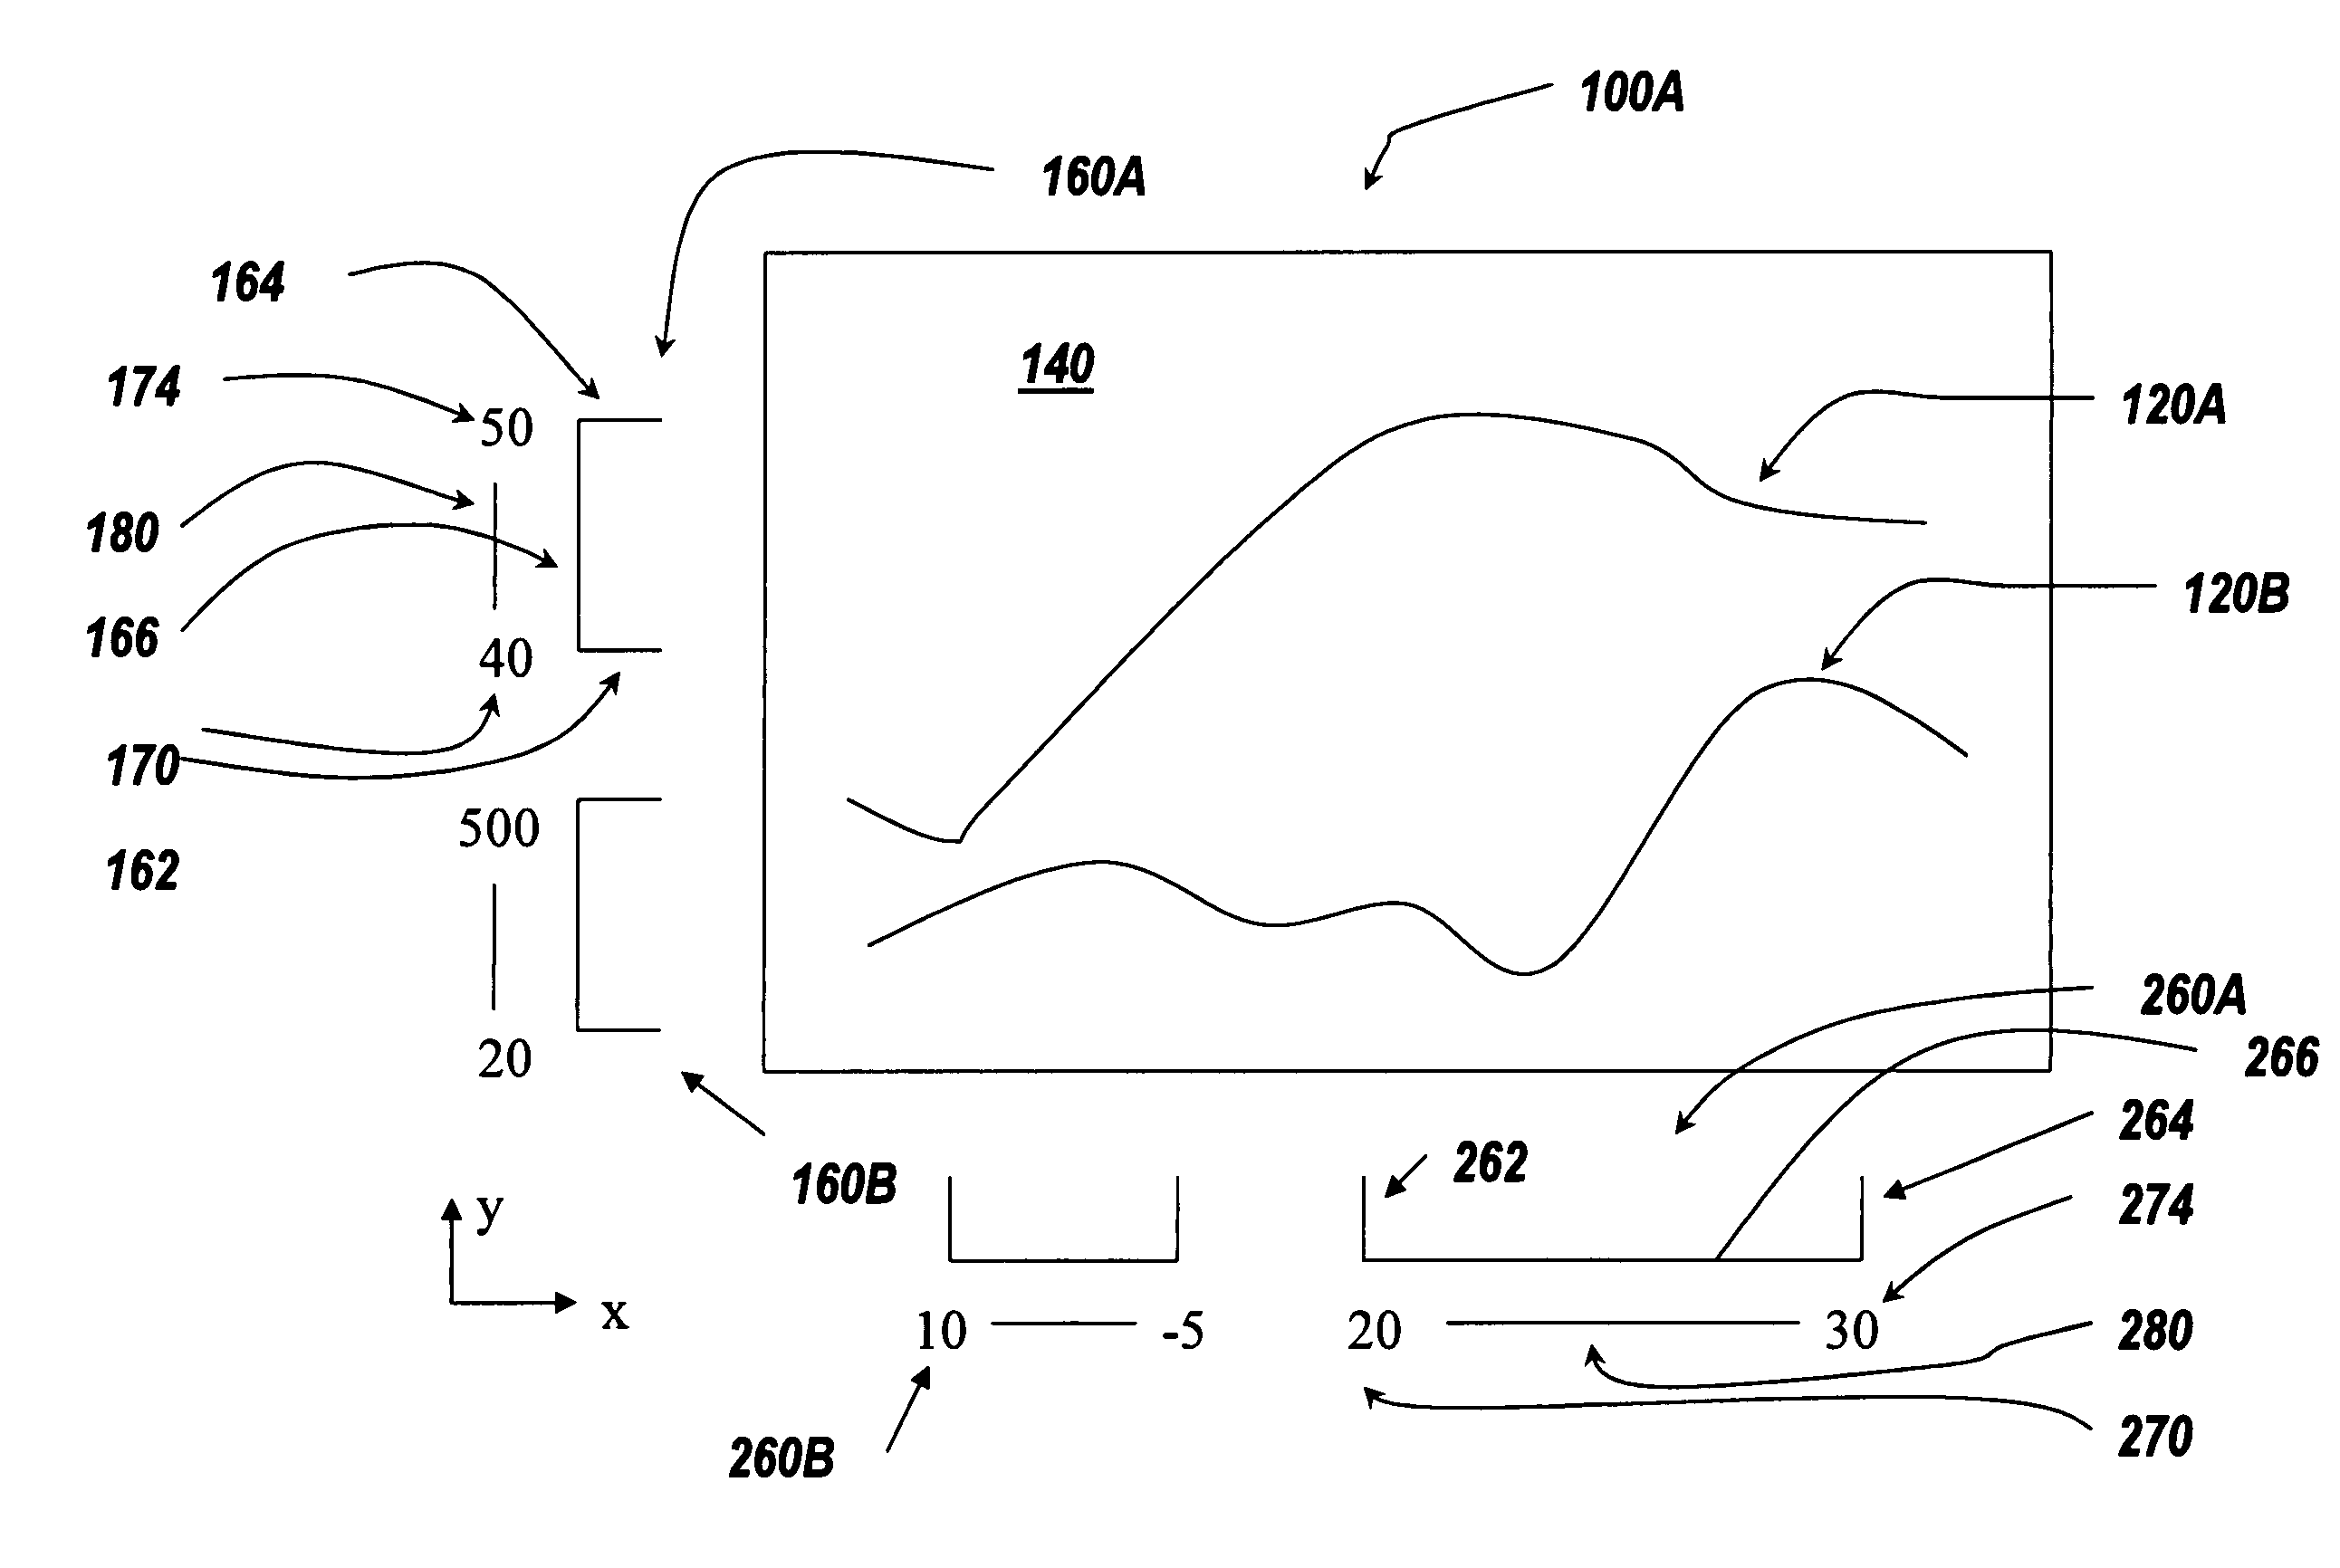
[0021]An embodiment of the invention provides a graphical display to let users interactively (i.e. dynamically) rescale the display of data to provide a desired display of the data. The present invention can be particularly useful when simultaneously analyzing multiple series of data to determine trends and / or relationships within or among the series of data.

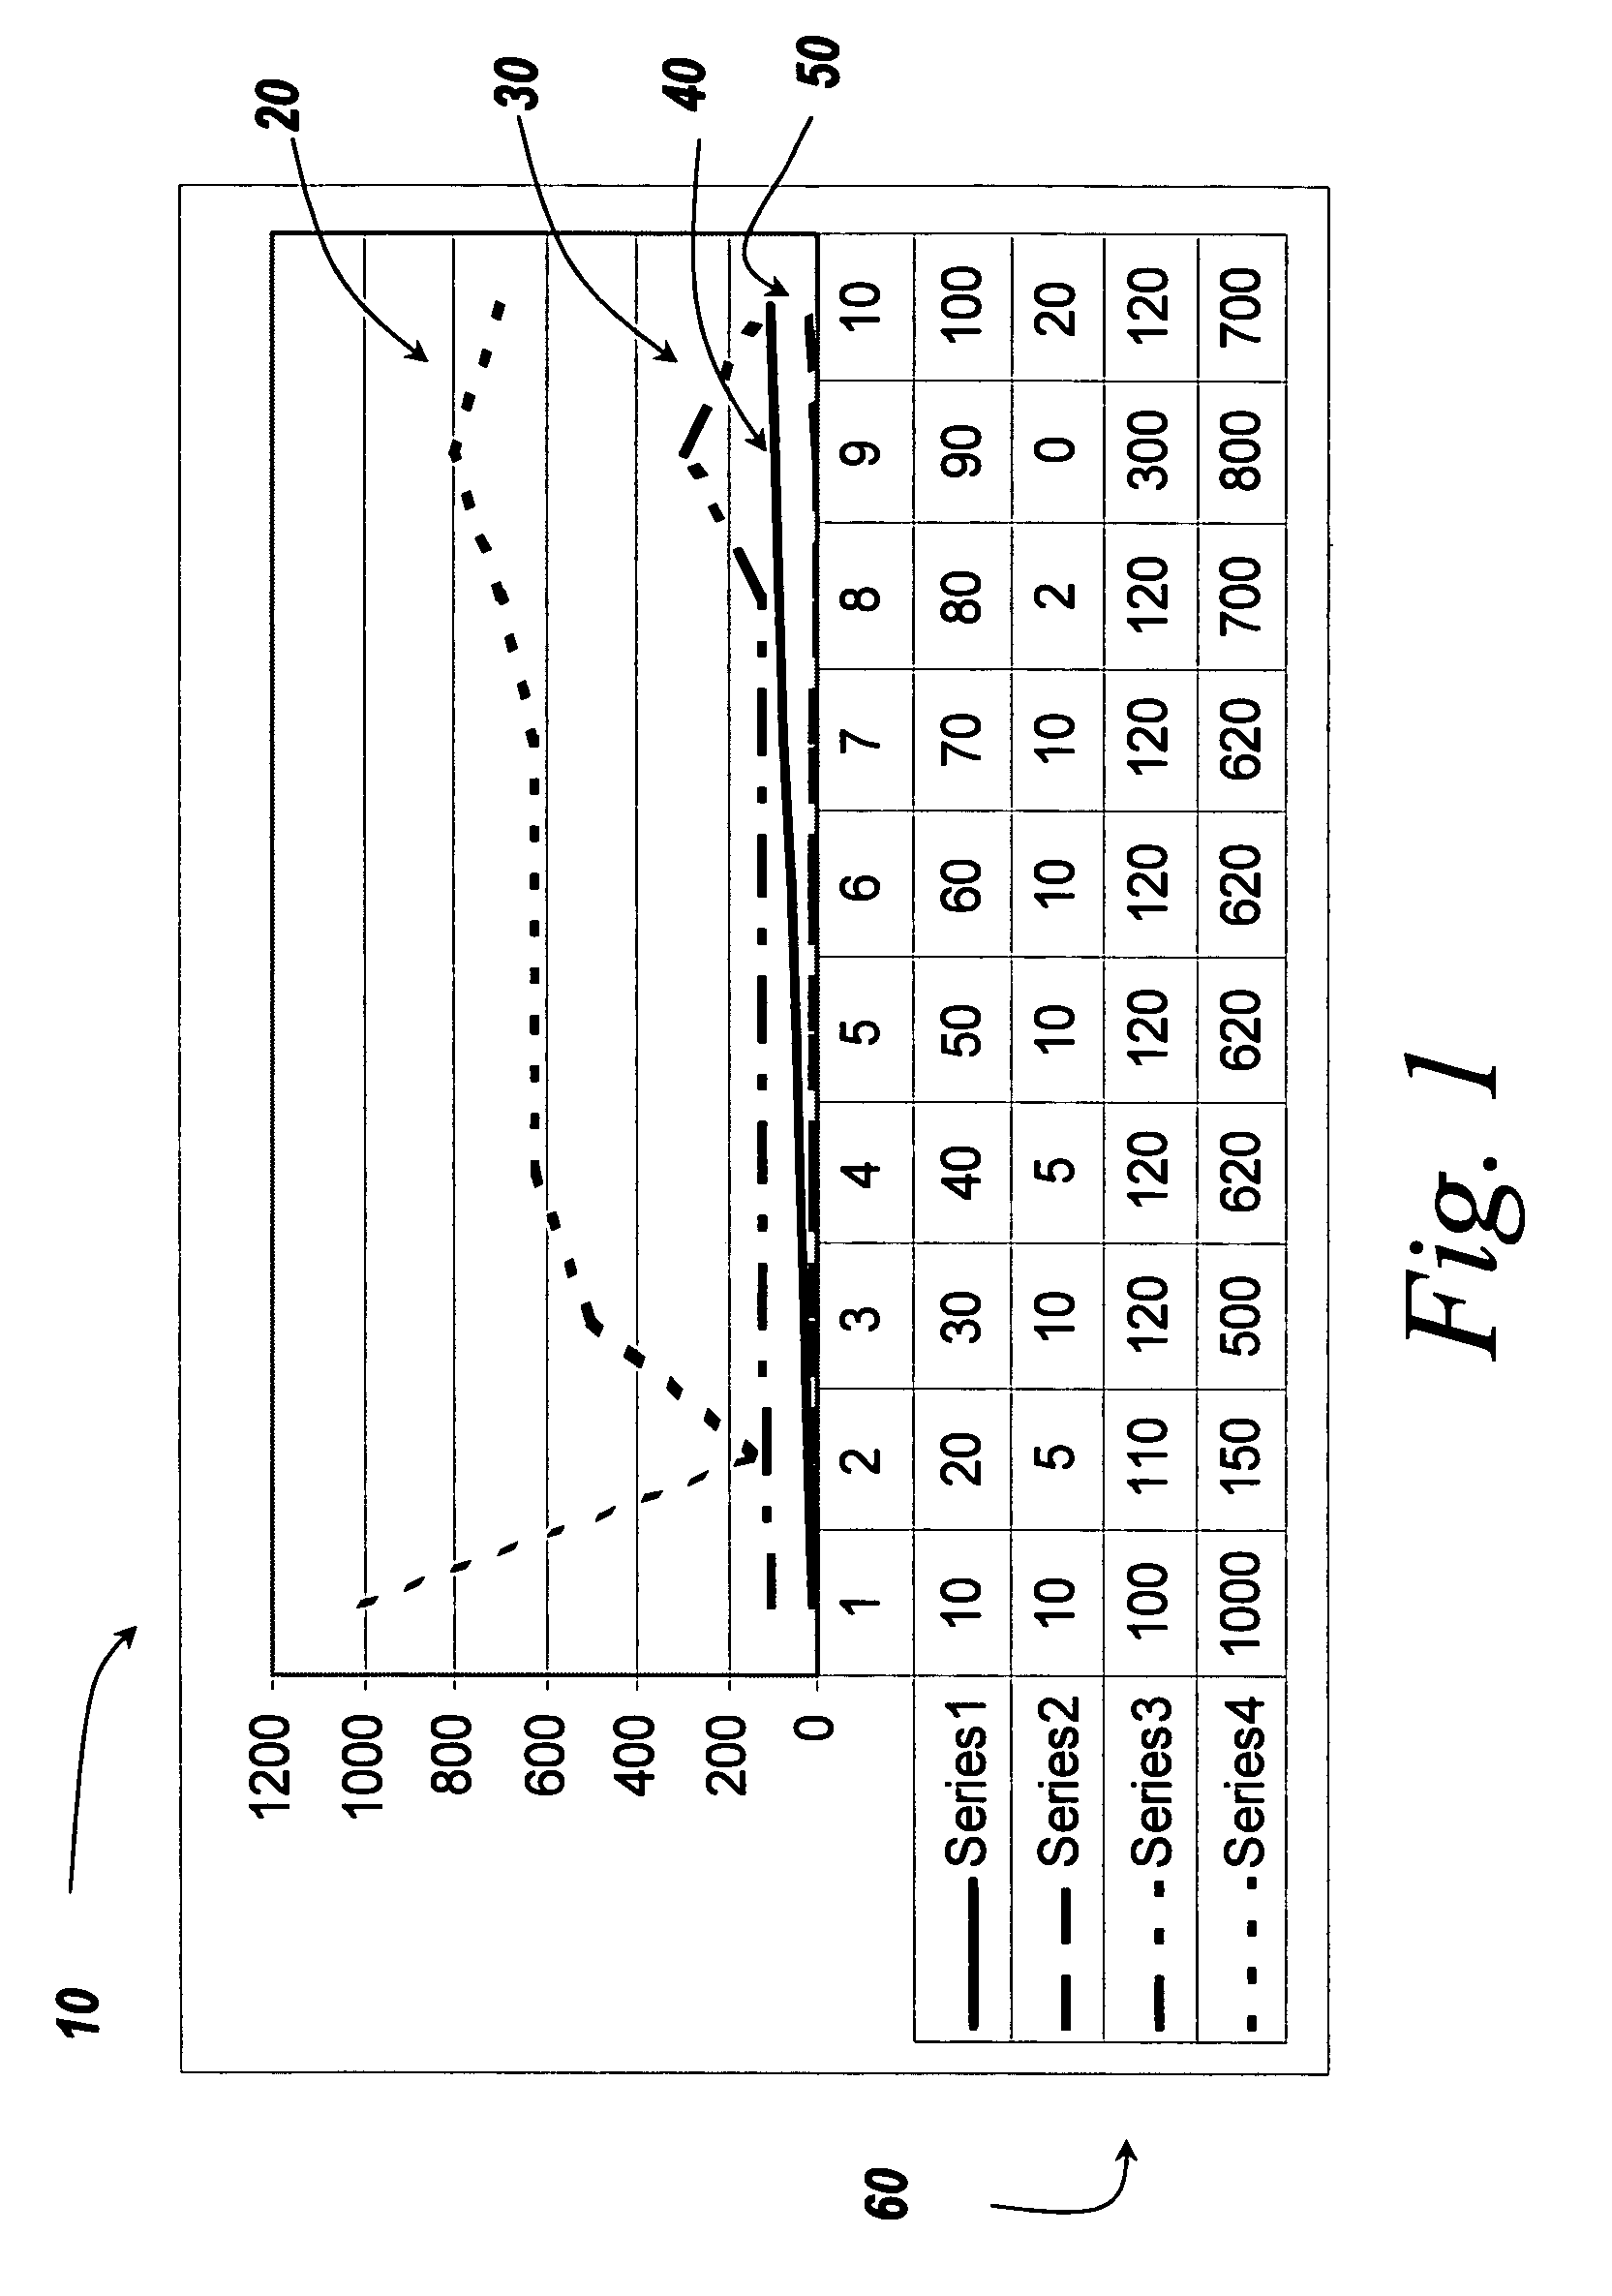
[0022]With reference to FIG. 1, the display of multiple series of data is difficult when the Y scale of these signals varies wildly from signal to signal. According to the display 10 of FIG. 1, four series of data are shown by a first, second, third and fourth line 20, 30, 40, 50. A data table 60 indicates the data corresponding to the lines 20, 30, 40, 50. In the present example, each of the series of data represent time-varying signals. If all the signals are put on the same axes or if multiple axes are used on the same page, detail is lost. For example, the variation in many of the data series is difficult to see in the displ...


PUM


Abstract

The present invention provides user selections to control of one or more graphical representations of data in a graphical display. User selections can include parts of the graphical display, such as tick marks, offset bars scale values, combination bars and/or the graphical representations themselves. Repositioning and resealing of the graphical representations may be performed without rescaling of the underlying data. Multiple series of data may be viewed and quickly moved and/or rescaled to determine trends and/or relationship between and/or among the series of data.

Description

RELATED APPLICATIONS[0001]The present application claims priority to a U.S. provisional application, Patent Application No. 60 / 569,272, filed May 6, 2004, the contents of which are incorporated herein by reference.FIELD OF THE INVENTION[0002]The present invention relates to the display of graphical information. Specifically, a graphical display of one or more series of data may be interactively rescaled to aid in graphical interpretation of the data.BACKGROUND OF THE INVENTION[0003]Graphical display of data can aid in interpretation of the data and detection of trends or relationships among series of data. Typically, scaling of the data is necessary in order to properly display data in a graph. When multiple series of data are to be displayed on the same graph, scaling can become more difficult. Improper scaling of the data can hide variations in the data. Also, positioning of the data series can aid in ease of comparison among series of data. The need to fit all the data onto the s...

Claims


Application Information

Patent Timeline
Patent Type & Authority Patents(United States)
IPC IPC(8): G06T11/20
CPCG06T11/206
Inventor HULL, DOUG
Owner THE MATHWORKS INC
Why Eureka
Try Eureka