Eureka AIR delivers breakthrough ideas for toughest innovation challenges, trusted by R&D personnel around the world.

Method and system for spot pricing via clustering based demand estimation

a demand estimation and clustering technology, applied in the field of methods and systems for determining the price of commodities on the spot market, can solve the problems of forfeiting the idea of price-demand, inaccurately defining the proper curve, and inconsistent demand curves, so as to achieve less noise

Active Publication Date: 2008-10-14
PROS
View PDF12 Cites 40 Cited by
  • Summary
  • Abstract
  • Description
  • Claims
  • Application Information

AI Technical Summary

Benefits of technology

[0011]The method and system work well because only that data relevant to the market state condition is used. In some instances, older data may be more relevant compared to substantially newer data. The method and system help to generate a price-demand curve that is more accurate to tomorrow's (or the next time period's) spot market for the commodity and have less noise.

Problems solved by technology

While price-demand concepts are easy to understand, accurately defining the proper curve has been a problem.
Due to the noise, many companies have effectively forfeited the idea of a price-demand curve and use something else.
Another problem is that demand curves are not consistent over time.
When a multi-dimensional problem is limited to considerations in only two dimensions, the problem will typically not be accurately solved.
Simple filtering does not completely address the problem, and therefore, may not accurately define the proper price-demand curve.
The inability to define accurately a price-demand curve for spot market sales of a commodity means that many companies may not be selling their goods or services at the right price in a manner consistent with the companies″goals.
In some industries, the profit margins are low and using any price other than the price optimized for profit may make the difference between generating a profit or turning a loss.

Method used


Image

  • Method and system for spot pricing via clustering based demand estimation
  • Method and system for spot pricing via clustering based demand estimation
  • Method and system for spot pricing via clustering based demand estimation

Examples


Embodiment Construction

[0026]Reference is now made in detail to the exemplary embodiments of the invention, examples of which are illustrated in the accompanying drawings. Wherever possible, the same reference numbers will be used throughout the drawings to refer to the same or like parts (elements).

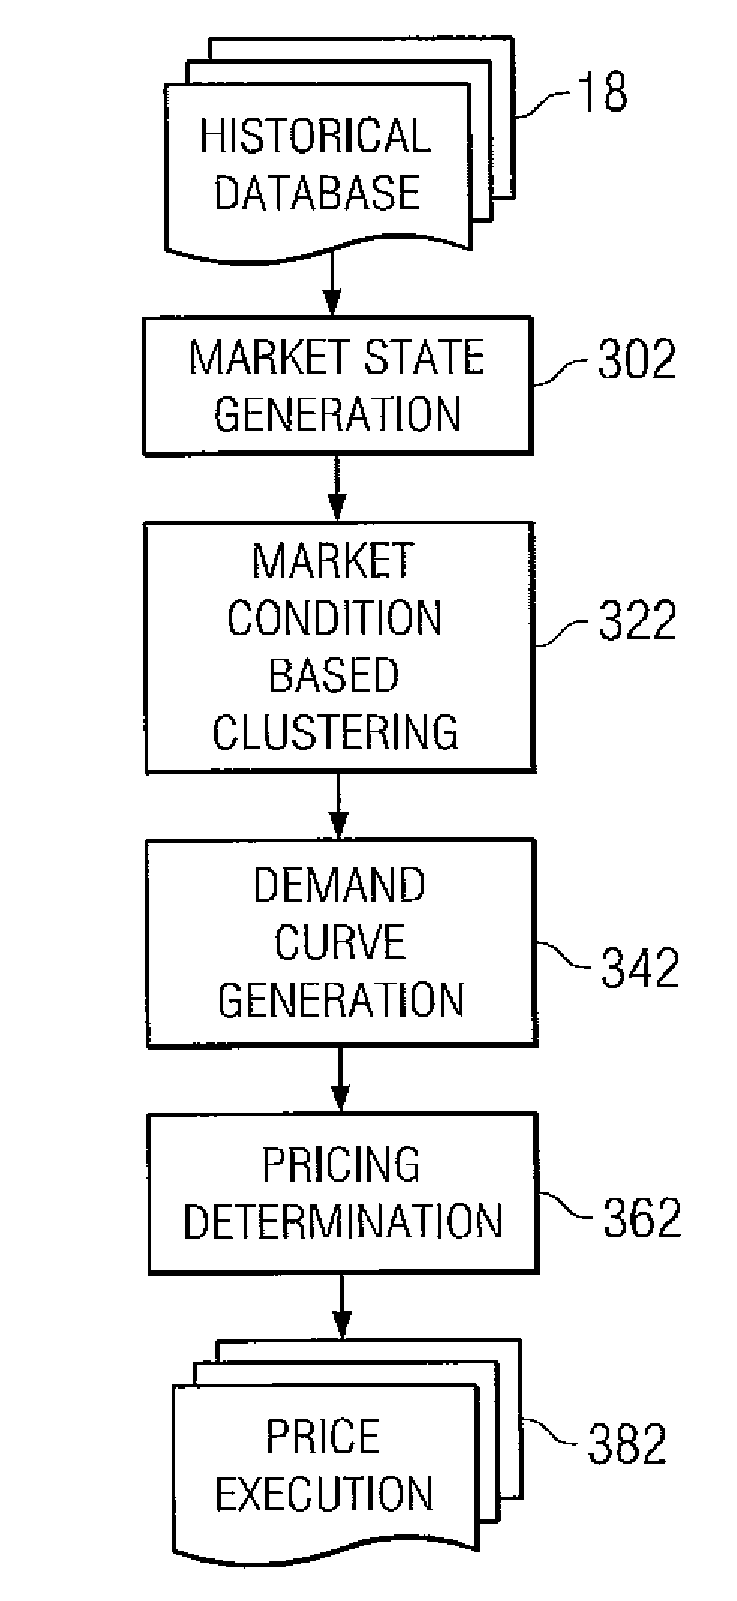
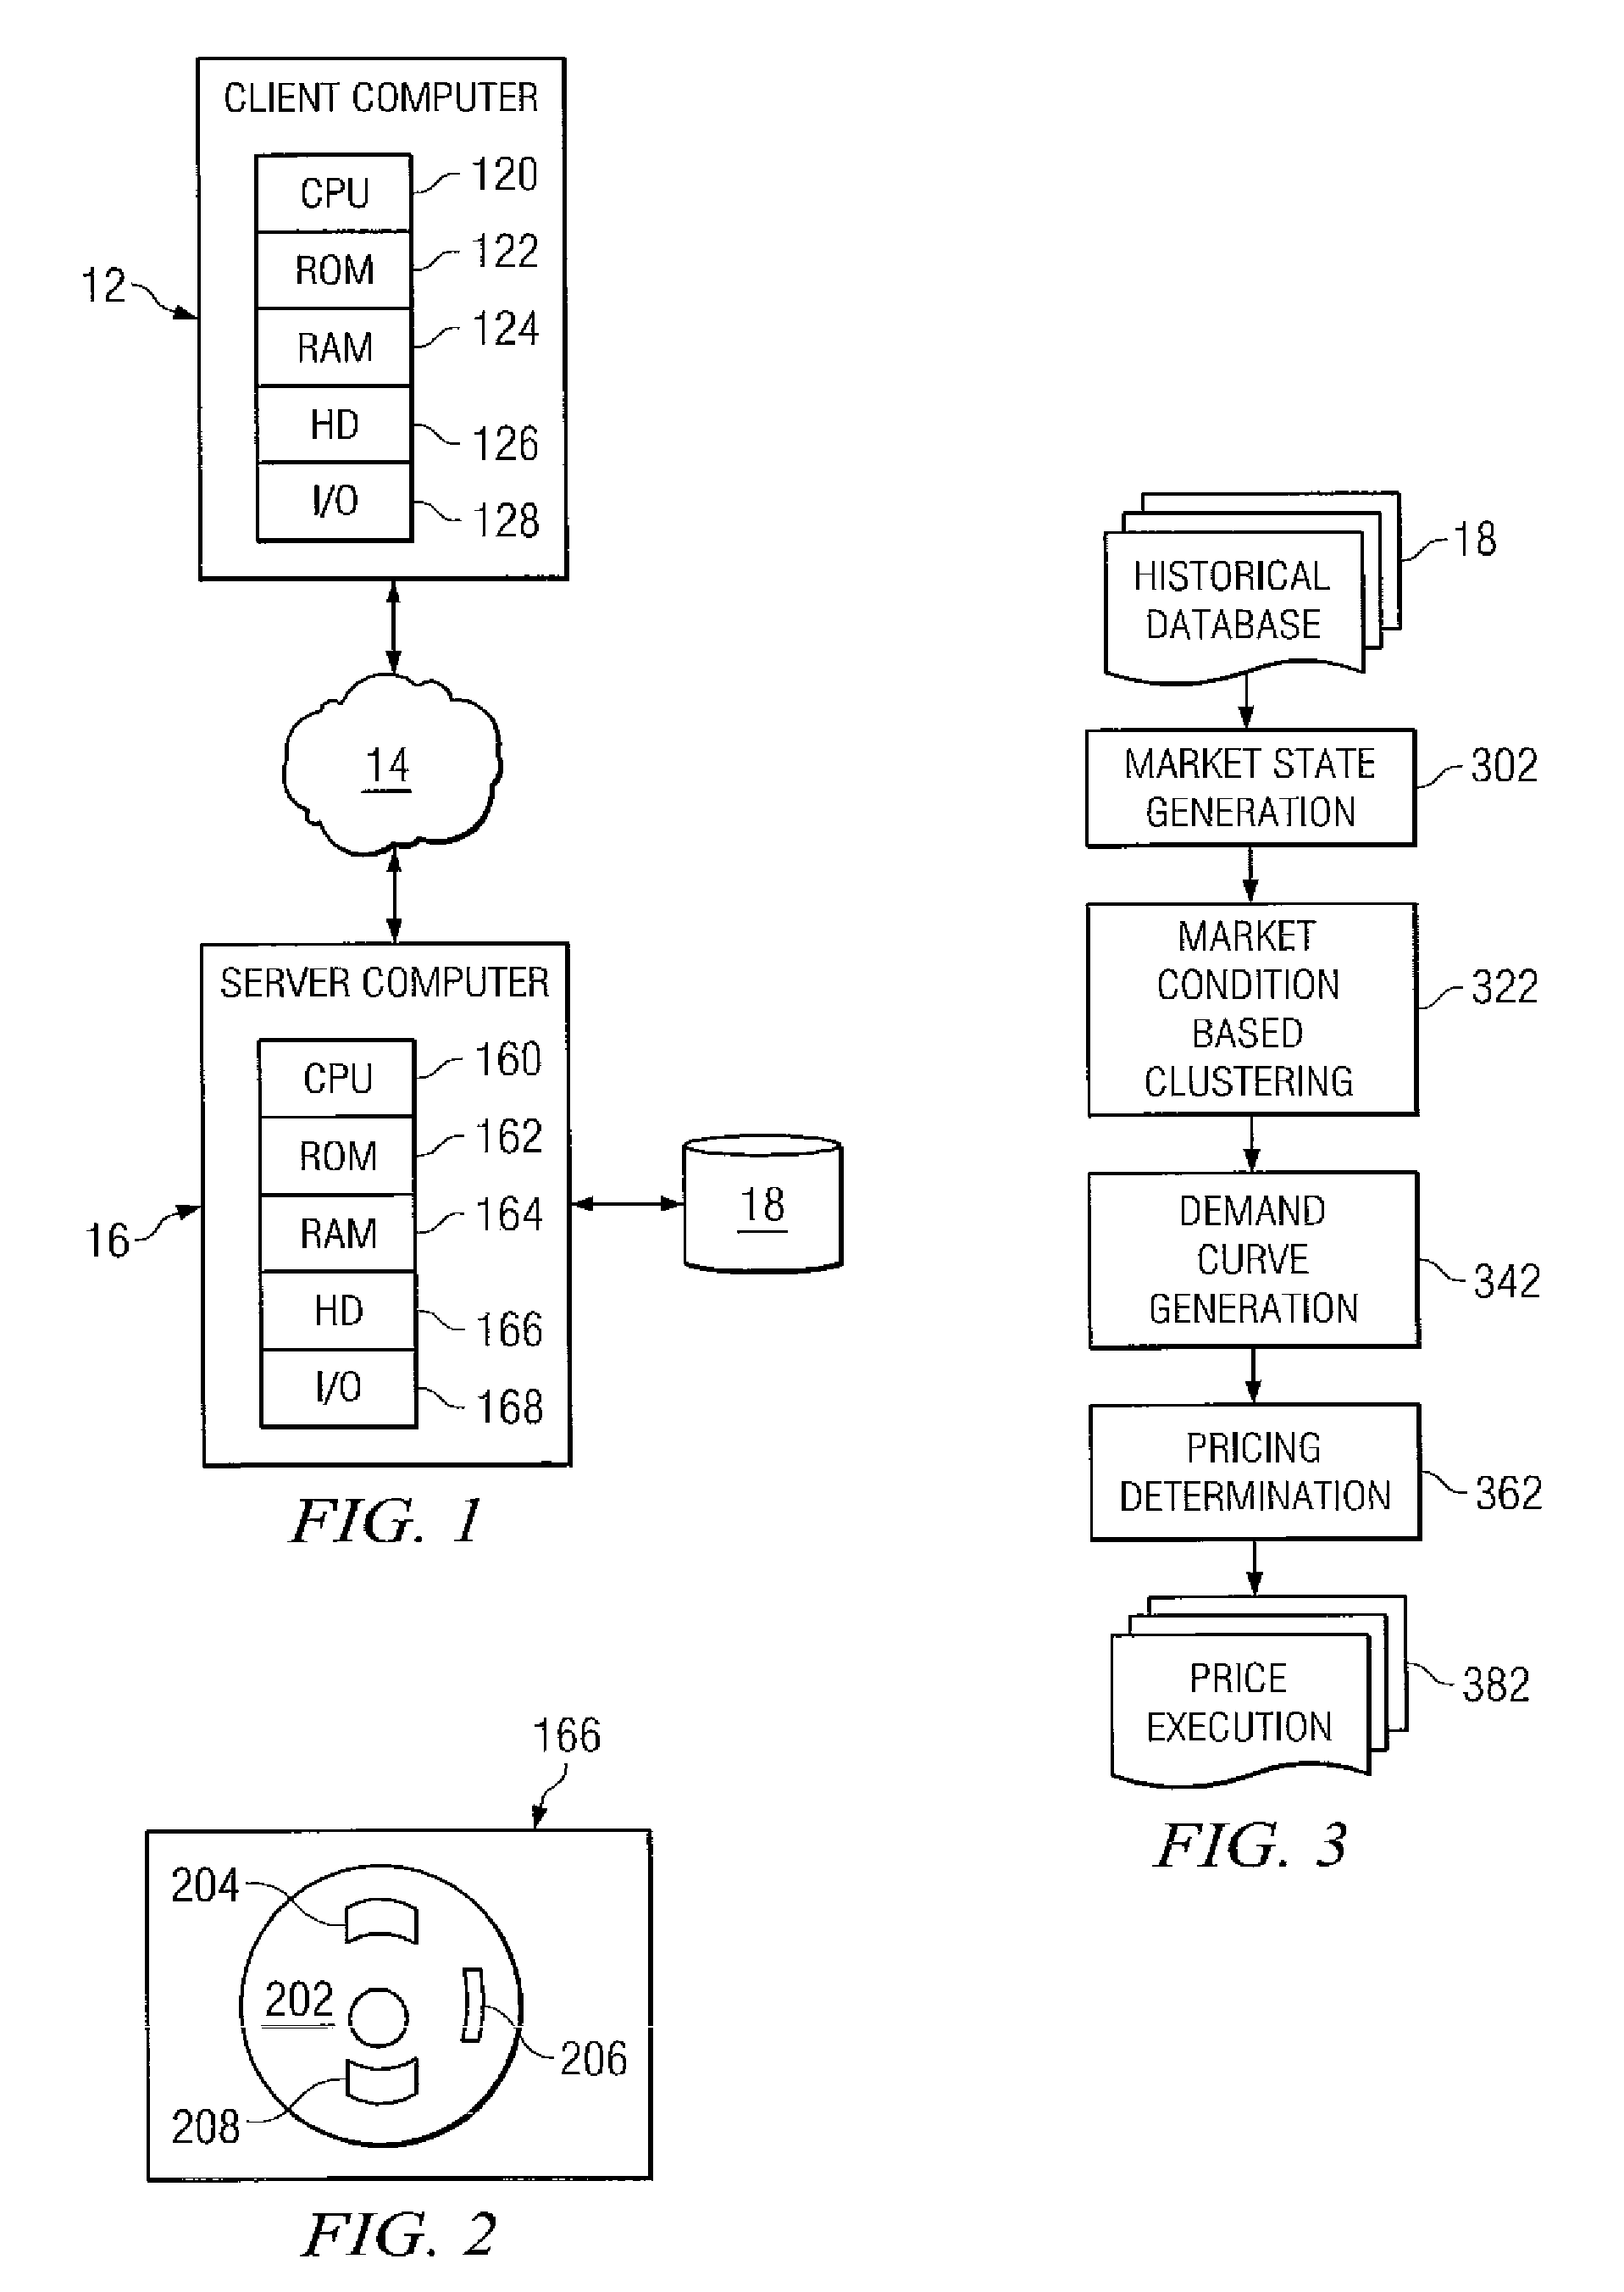
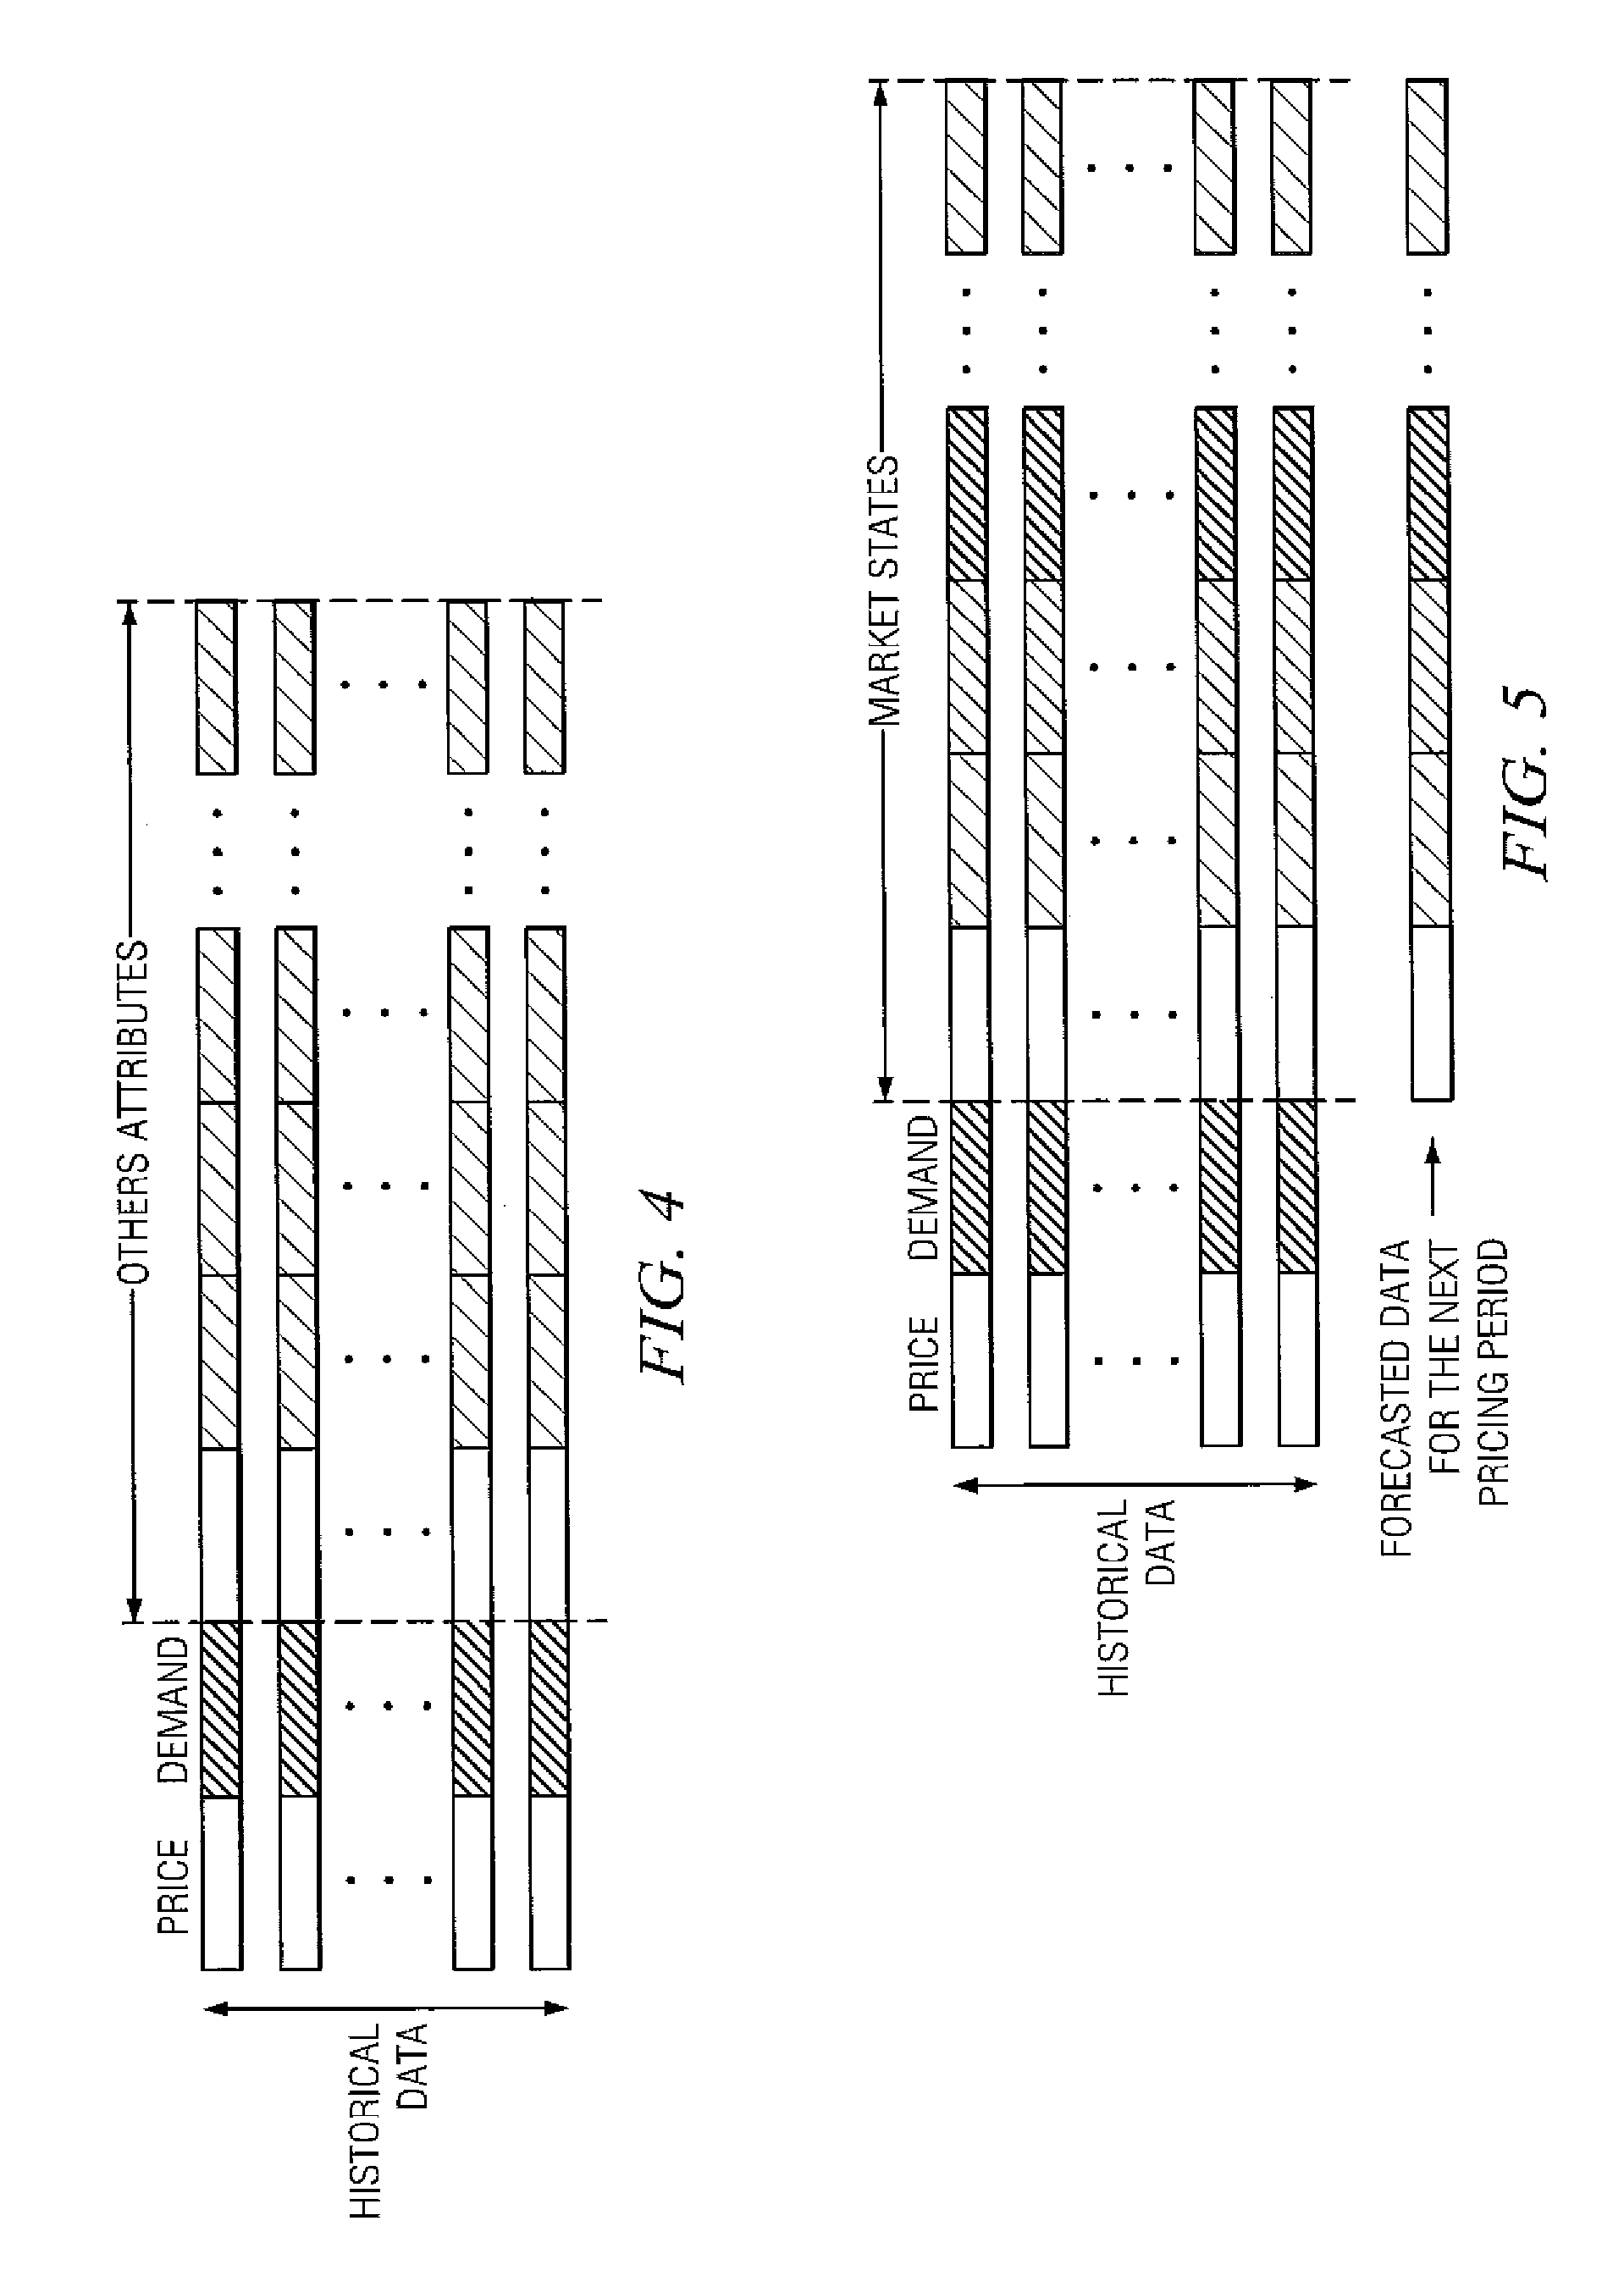
[0027]A method and system can be used to determine an optimal price of a commodity on a spot market. Market state conditions can be generated using historical data. The historical data may include transactional and other data, such as an environmental or other external condition that may affect the price or demand of a commodity in a spot market. The market state conditions may include nearly any number of attributes. The forecast market state conditions can include a forecast price for the commodity during the next time period. The historical data and market state condition may be used in a clustering module that separates the data into clusters. The cluster with the forecast market state conditions is identi...


PUM


Abstract

A method and system can be used to determine an optimal price of a commodity on a spot market. Market state conditions can be generated using historical data, such as transactional and other data. The market state conditions may include nearly any number of attributes, and the forecast market state conditions may include a forecast price for the commodity during the next time period. The historical data and market state condition may be used in a clustering module that separates the data into clusters. The cluster with the market state condition is identified, and the data in that cluster is used to generate a price-demand curve for the next time period. The price for the commodity on the spot market during that time period can be determined consistent with the company's business rules.

Description

CROSS REFERENCE TO RELATED APPLICATIONS[0001]This application is related to U.S. patent application Ser. No. 09 / 919,385 entitled “System and Method for Analyzing Transaction in an Electronic Exchange” by Woestemeyer et al. filed Jul. 31, 2001, which is assigned to the current assignee hereof and incorporated herein by reference.BACKGROUND OF INVENTION[0002]1. Field of the Invention[0003]This invention relates in general to methods and systems for determining a price for a commodity, and more particularly, to methods and systems for determining a price for a commodity on a spot market.[0004]2. Description of the Related Art[0005]In order to determine the expected demand of a commodity, whether a product or service, for a given unit price on a spot market, a simple price-demand curve can be used. If a company can accurately define a price-demand curve, it can optimize its operations. While price-demand concepts are easy to understand, accurately defining the proper curve has been a pr...

Claims


Application Information

Patent Timeline
Patent Type & Authority Patents(United States)
IPC IPC(8): G06Q40/00
CPCG06Q40/04G06Q40/06
Inventor VALKOV, THEODORE V.WISNIEWSKI, MICHAELASWAL, NAVINBURAPARATE, VIROJ
Owner PROS
Why Eureka
Eureka Blog
Learn More