Method for generating a net analyte signal calibration model and uses thereof

a net analyte signal and calibration model technology, applied in the field of in vivo spectroscopic analysis, can solve the problems of increased financial burden, premature death, pain and suffering, and difficulty in obtaining blood samples several times daily, and achieves the effects of reducing the cost of diabetes, and improving the accuracy of the calibration model

Inactive Publication Date: 2008-12-02
IOWA RES FOUND UNIV OF
View PDF8 Cites 33 Cited by
  • Summary
  • Abstract
  • Description
  • Claims
  • Application Information

AI Technical Summary

Problems solved by technology

The costs associated with diabetes, including premature death, pain and suffering, and increased financial burdens.
While these daily measurements provide a diabetic patient with the ability to self-monitor and thus better control blood glucose levels, they are not without drawbacks.
In particular, the taking of blood samples several times daily can be very painful and expose the patient to elevated risks of infection.
Moreover, these methods are not suitable for providing continuous blood glucose measurements.
Thus, for example, during the night, a patient must either be awakened periodically for testing or else run the risk that glucose levels will drop dangerously low while they sleep.
Further, these statistical methods fail to provide direct evidence that the assigned concentration predictions from the multivariate calibration models are actually based on glucose specific spectral information.
Moreover, in some cases the in vivo spectral signature for a physiological analyte can be smaller than many weakly or partially correlated spectral variations, making the use of the conventional statistical methods very difficult.

Method used


Image

  • Method for generating a net analyte signal calibration model and uses thereof
  • Method for generating a net analyte signal calibration model and uses thereof
  • Method for generating a net analyte signal calibration model and uses thereof

Examples


example 1

Generation of an in vivo Net Analyte Signal Calibration Model for Glucose in a Lab Rat as Tested Above

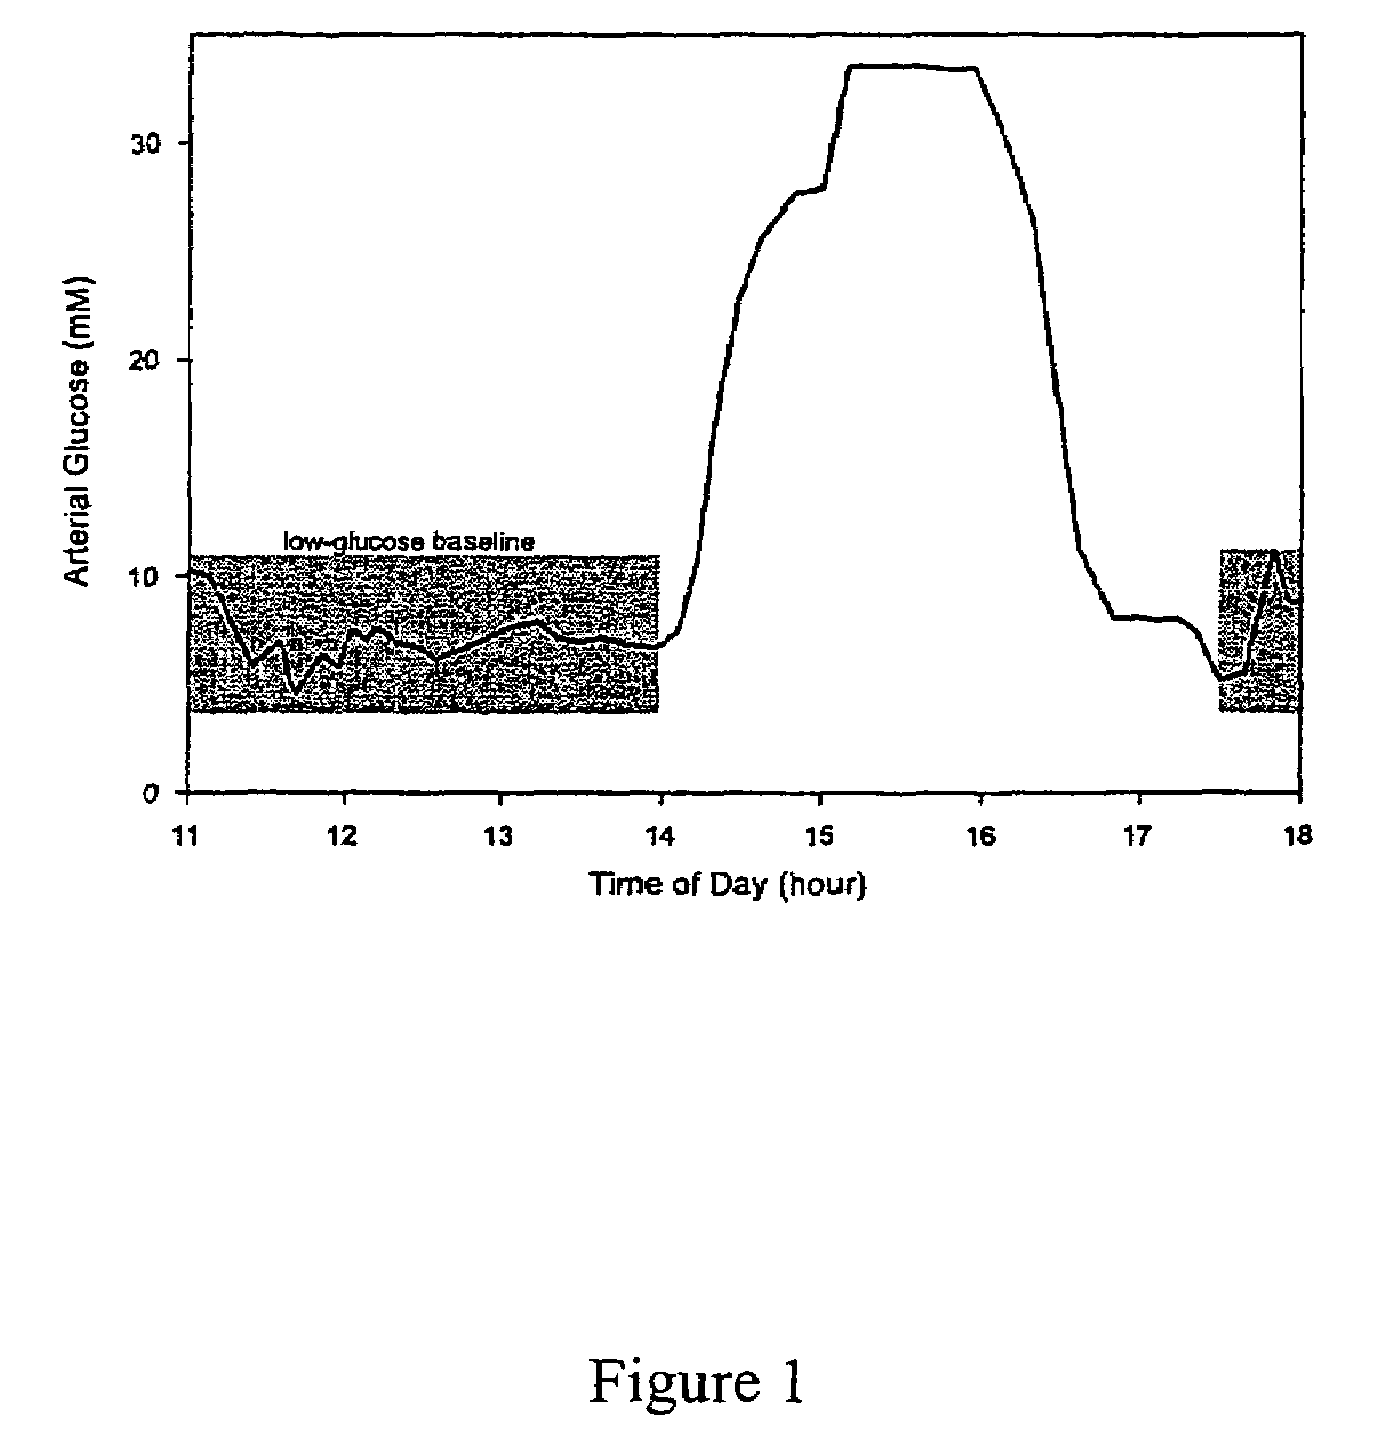
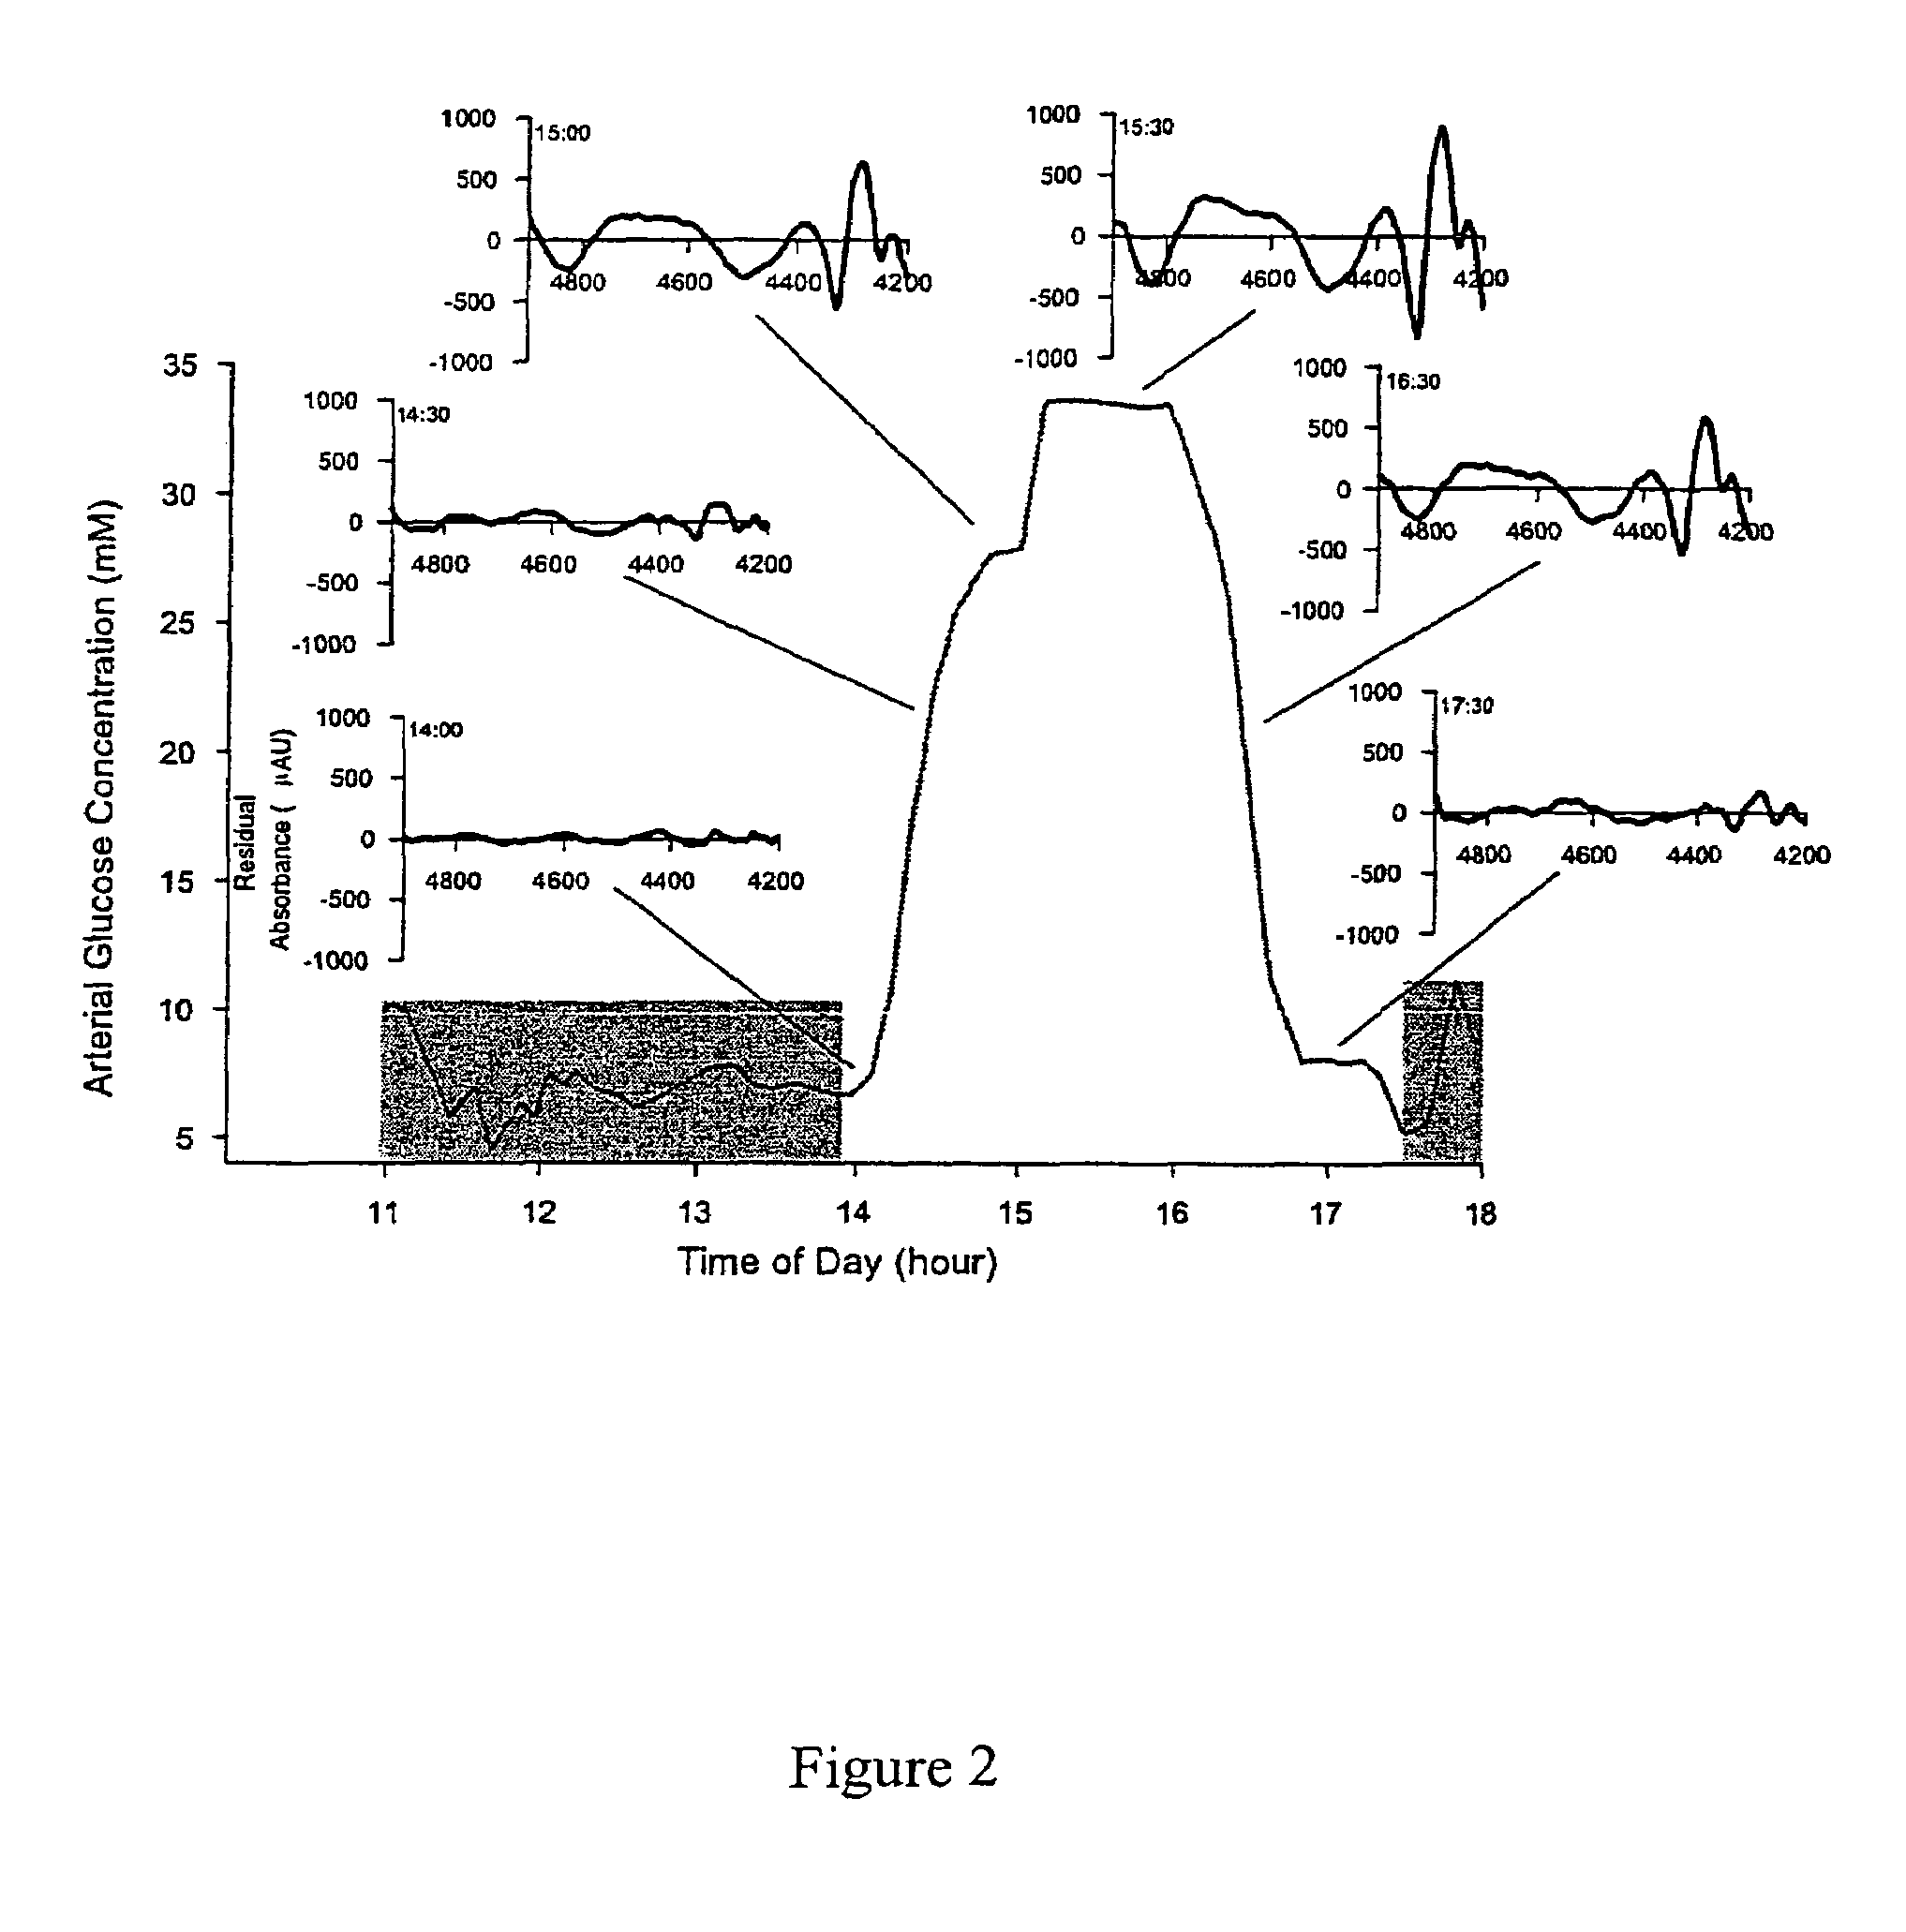
[0081]Using the data collected from the experimental procedure described above, an in vivo net analyte signal calibration model for glucose in the lab rat was generated. First, the time profile of arterial glucose concentration in the lab rat over the course of the experiment is depicted in FIG. 1. The lower, shaded regions on FIG. 1 indicate the times during the course of the experiment when the glucose concentration was held substantially constant and the times from which the obtained spectra were used to form the baseline background spectra (11:00-13:50 and 17:30-18:00). The latter set of shaded spectra were included in the background calculation of the baseline factors in order to correct for long term drift in the spectroscopy system. During the period from 13:00-13:45, the fiber optic clamp was repositioned on the animal between each scan in order to account for possible varia...

example 2

Use of the Model to Measure a Predicted Concentration

[0085]The net analyte signal of glucose generated in Example 1 above was used to calculate predicted concentrations of glucose at selected periods during the course of the experimental procedure.

[0086]The glucose concentration was calculated using the following mathematical model:

[0087]Cglucose=βglucose·Al+C_b

Where Cglucose is the concentration of glucose in the animal, βglucose is the glucose calibration vector from the net analyte signal, A is the absorbance spectrum measured for the rat skin, λ is the optical path length, which is approximately 0.7 mm in this experiment, and Cb(bar) is the mean concentration of glucose in the set of baseline spectra used to generate the net analyte signal. The average glucose concentration is ca., 7 mM for the baseline spectra used in this experiment.

[0088]The results of this calculation are indicated in FIG. 4, wherein the open circles represent the spectra used in the calculation of the backg...

example 3

Generation of in vivo PLS Multivariate Calibration Model

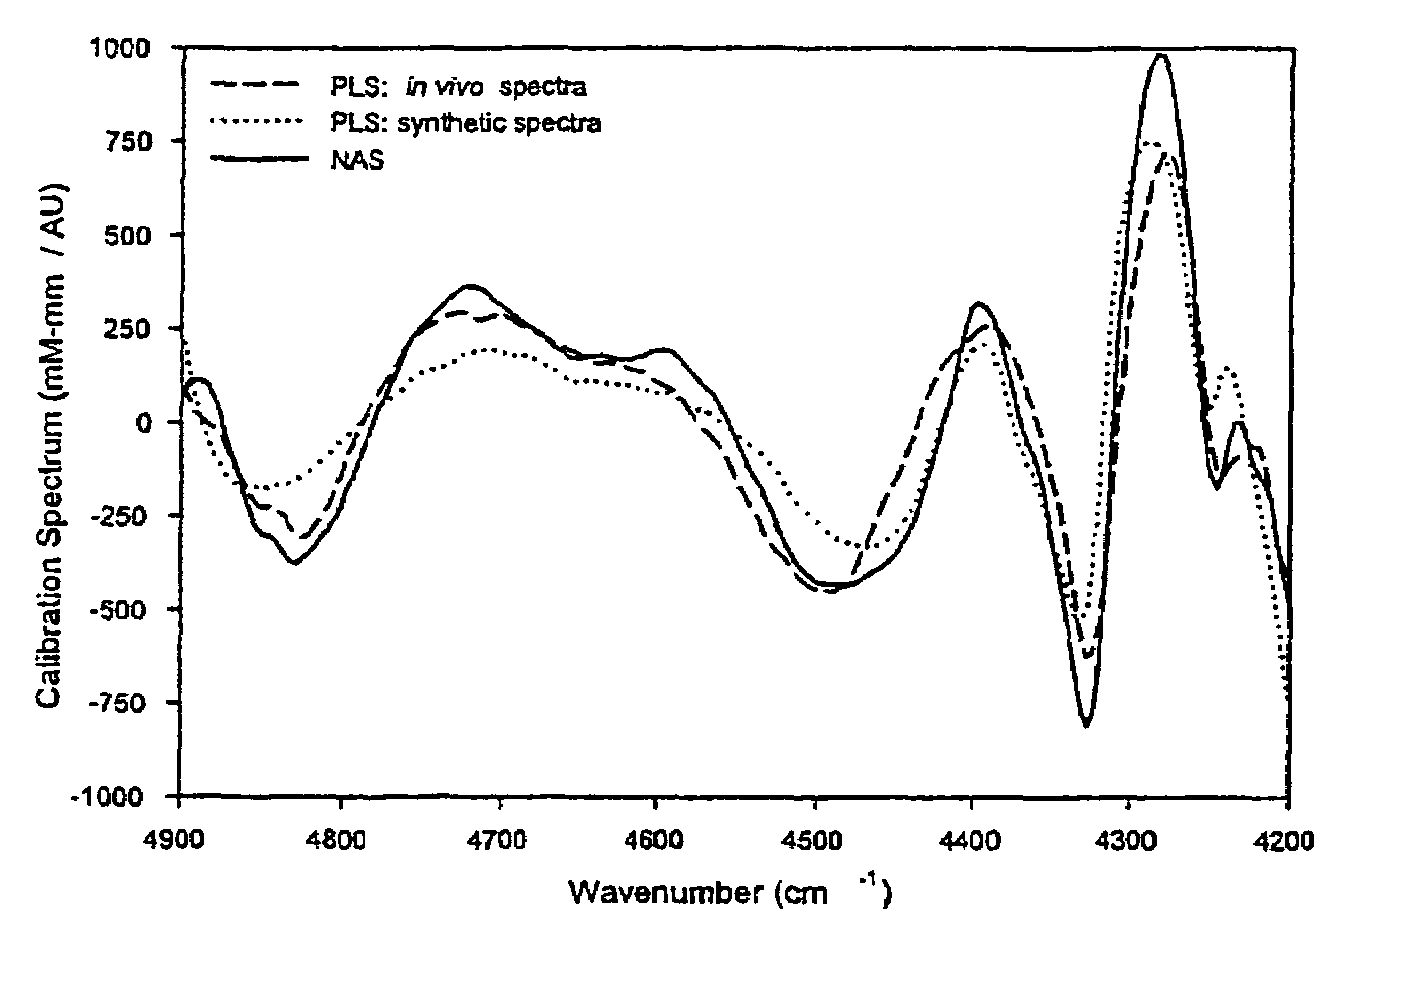
[0090]The net analyte signal of glucose generated in Example 1 was also used to evaluate the analytical significance of a classical partial least squares regression calibration model obtained from the same spectral data obtained in the experimental procedure.

[0091]A partial least squares regression calibration model was generated from the data collected in the foregoing experiment. A set of 54 randomly selected spectra were removed from the data set and set aside for an independent measure of the standard error of prediction after the calibration was constructed. All remaining spectra, (approximately 306) were used to build the partial least squares calibration model. The number of factors was chosen by performing 50 repetitions of a randomly selected leave-one-third-out cross validation of the calibration spectra after mean centering. The average standard error of cross validation (SECV) from the 50 repetitions is shown in FIG...


PUM


Abstract

A method for generating a net analyte signal calibration model for use in detecting and / or quantifying the amount of an analyte in a test subject. The net analyte signal can be generated by providing a set of in vivo infrared spectra for a test subject during a period in which an analyte concentration is essentially constant; calculating an optimal subspace of spectra that at least substantially describes all non-analyte dependent spectral variance in the in vivo spectra; providing a pure component infrared spectrum for the analyte; and calculating a net analyte signal spectrum from a data set comprising the optimal subspace spectra and the pure analyte spectrum. The net analyte signal calibration model can be used, for example, in measuring the concentration of analyte in a test subject, and / or for evaluating the analytical significance of an in vivo multivariate calibration model.

Description

[0001]The invention described in the foregoing specification has been developed in part with funds received from the National Institute of Diabetes and Digestive and Kidney Diseases of the National Institutes of Health under grant numbers DK-60657 and DK-02925. The United States Government may have certain rights under this invention.FIELD OF THE INVENTION[0002]The present invention relates generally to the field of in vivo spectroscopic analysis of a test subject and more particularly to a method for generating an in vivo net analyte signal calibration model and methods for the use thereof.BACKGROUND OF THE INVENTION[0003]Diabetes is one of the fastest growing diseases today. The World Health Organization estimates that 177 million people worldwide currently have diabetes and this number is projected to increase to more than 370 million people by the year 2030. The costs associated with diabetes, including premature death, pain and suffering, and increased financial burdens. These ...

Claims


Application Information

Patent Timeline
Patent Type & Authority Patents(United States)
IPC IPC(8): A61B5/1455G01J3/00G12B13/00
CPCA61B5/14532A61B5/1455A61B5/1495G01N21/274G01N21/35A61B2560/0223G01N21/1702G01N21/4738G01N21/552G01N2021/3595G01N2201/129
Inventor ARNOLD, MARK A.OLESBERG, JONATHON T.
Owner IOWA RES FOUND UNIV OF
Why Eureka
Try Eureka