Hybrid graphics for interactive reporting

a technology of interactive reporting and hybrid graphics, applied in the field of graphic reporting of data, can solve the problems of static raster images, inability to provide interactive functionality, and inability to encode raster images with large amounts of information regarding the data attributes of raster image data

Active Publication Date: 2009-07-28
EVERBRIDGE
View PDF30 Cites 102 Cited by
  • Summary
  • Abstract
  • Description
  • Claims
  • Application Information

AI Technical Summary

Problems solved by technology

Although numerous schemes for compressing bitmaps have been employed, including the JPEG (Joint Photographic Experts Group), GIF (Graphics Interchange Format), and PNG (Portable Network Graphics) standards, in general raster images suffer from the shortcoming that it is impractical to encode raster images with large amounts of information regarding the data attributes of raster image data.
Thus, raster images are usually static and do not provide interactive functionality such as allowing a user to click on a certain point in an image to change how the image is displayed, or to obtain more information about a point or points in the image.
However, vector graphics files sometimes consume large amounts of processing overhead to r...

Method used


Image

  • Hybrid graphics for interactive reporting
  • Hybrid graphics for interactive reporting
  • Hybrid graphics for interactive reporting

Examples


Embodiment Construction

Introduction

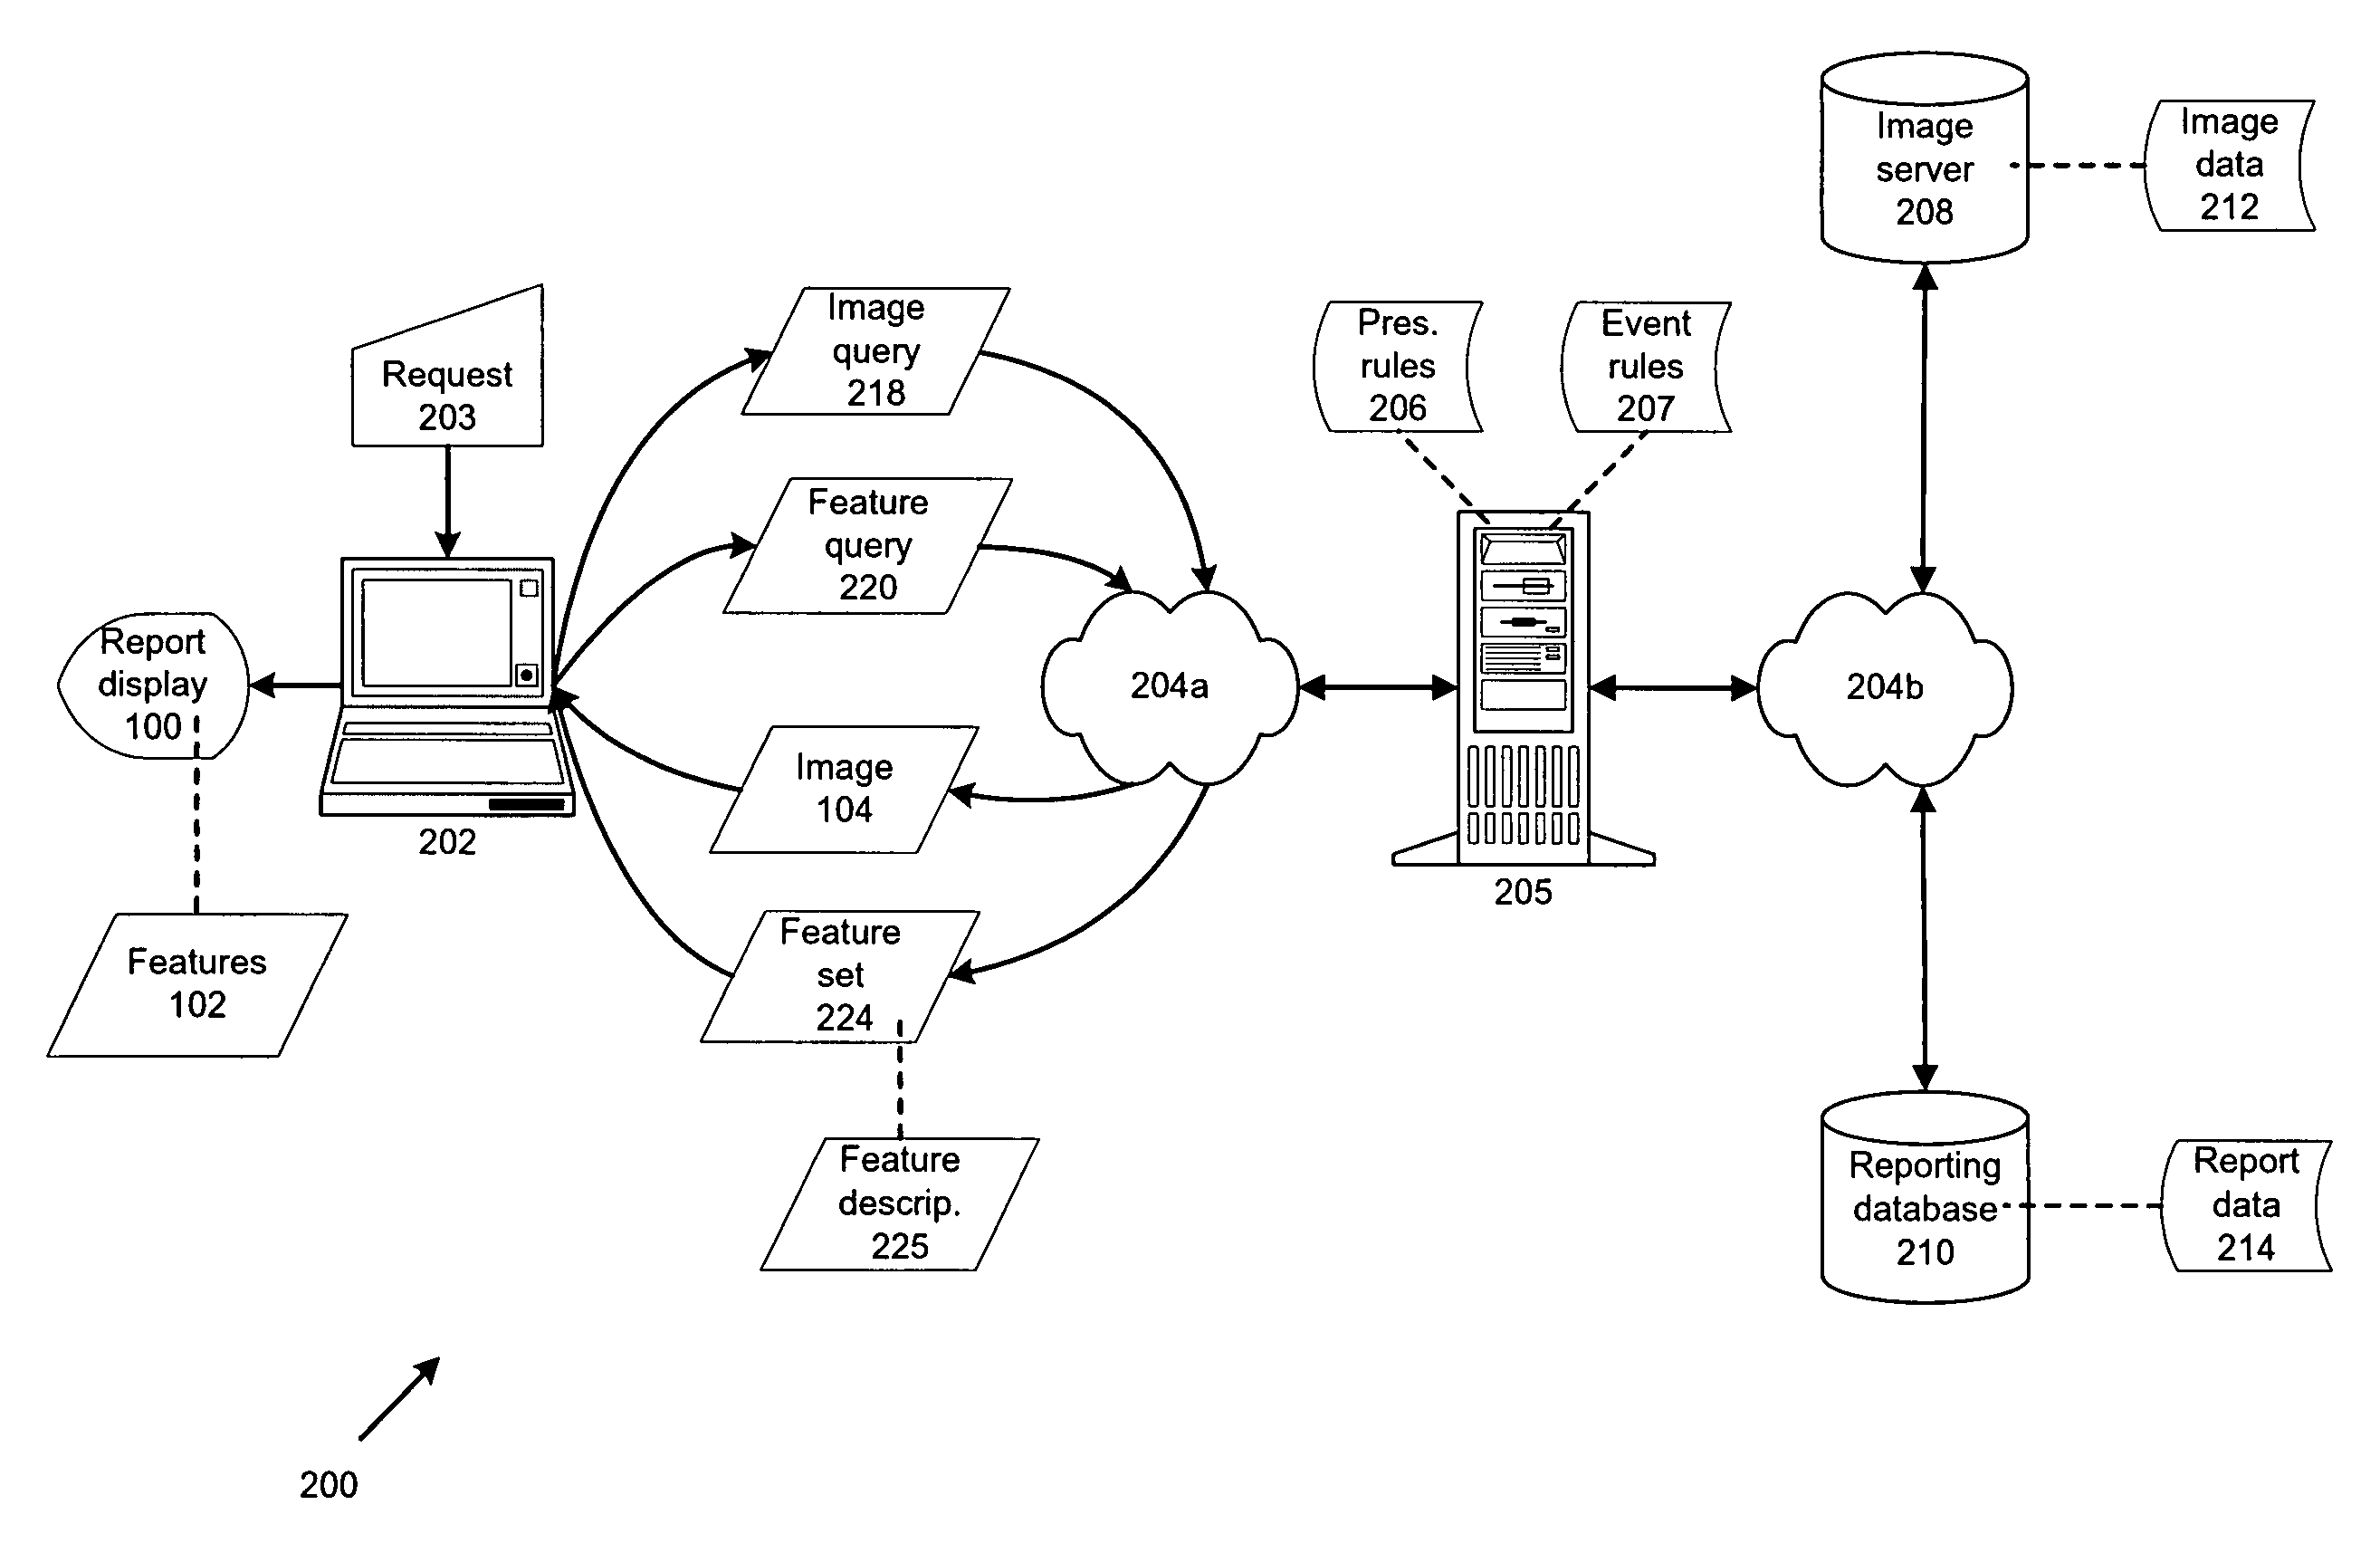
[0021]The novel approach to combining report data and image data disclosed herein may be used in any reporting application in which an image can be mapped according to a multi-dimensional, often two-dimensional (e.g., XY), coordinate system. Because report data and image data are brought back separately to a reporting client, and are never combined into a single data structure or any other programmatic object, it is advantageously possible to flexibly and efficiently query, manipulate, and refresh report data and image data independently of each other, even as they are displayed overlaid together in a graphical user interface.

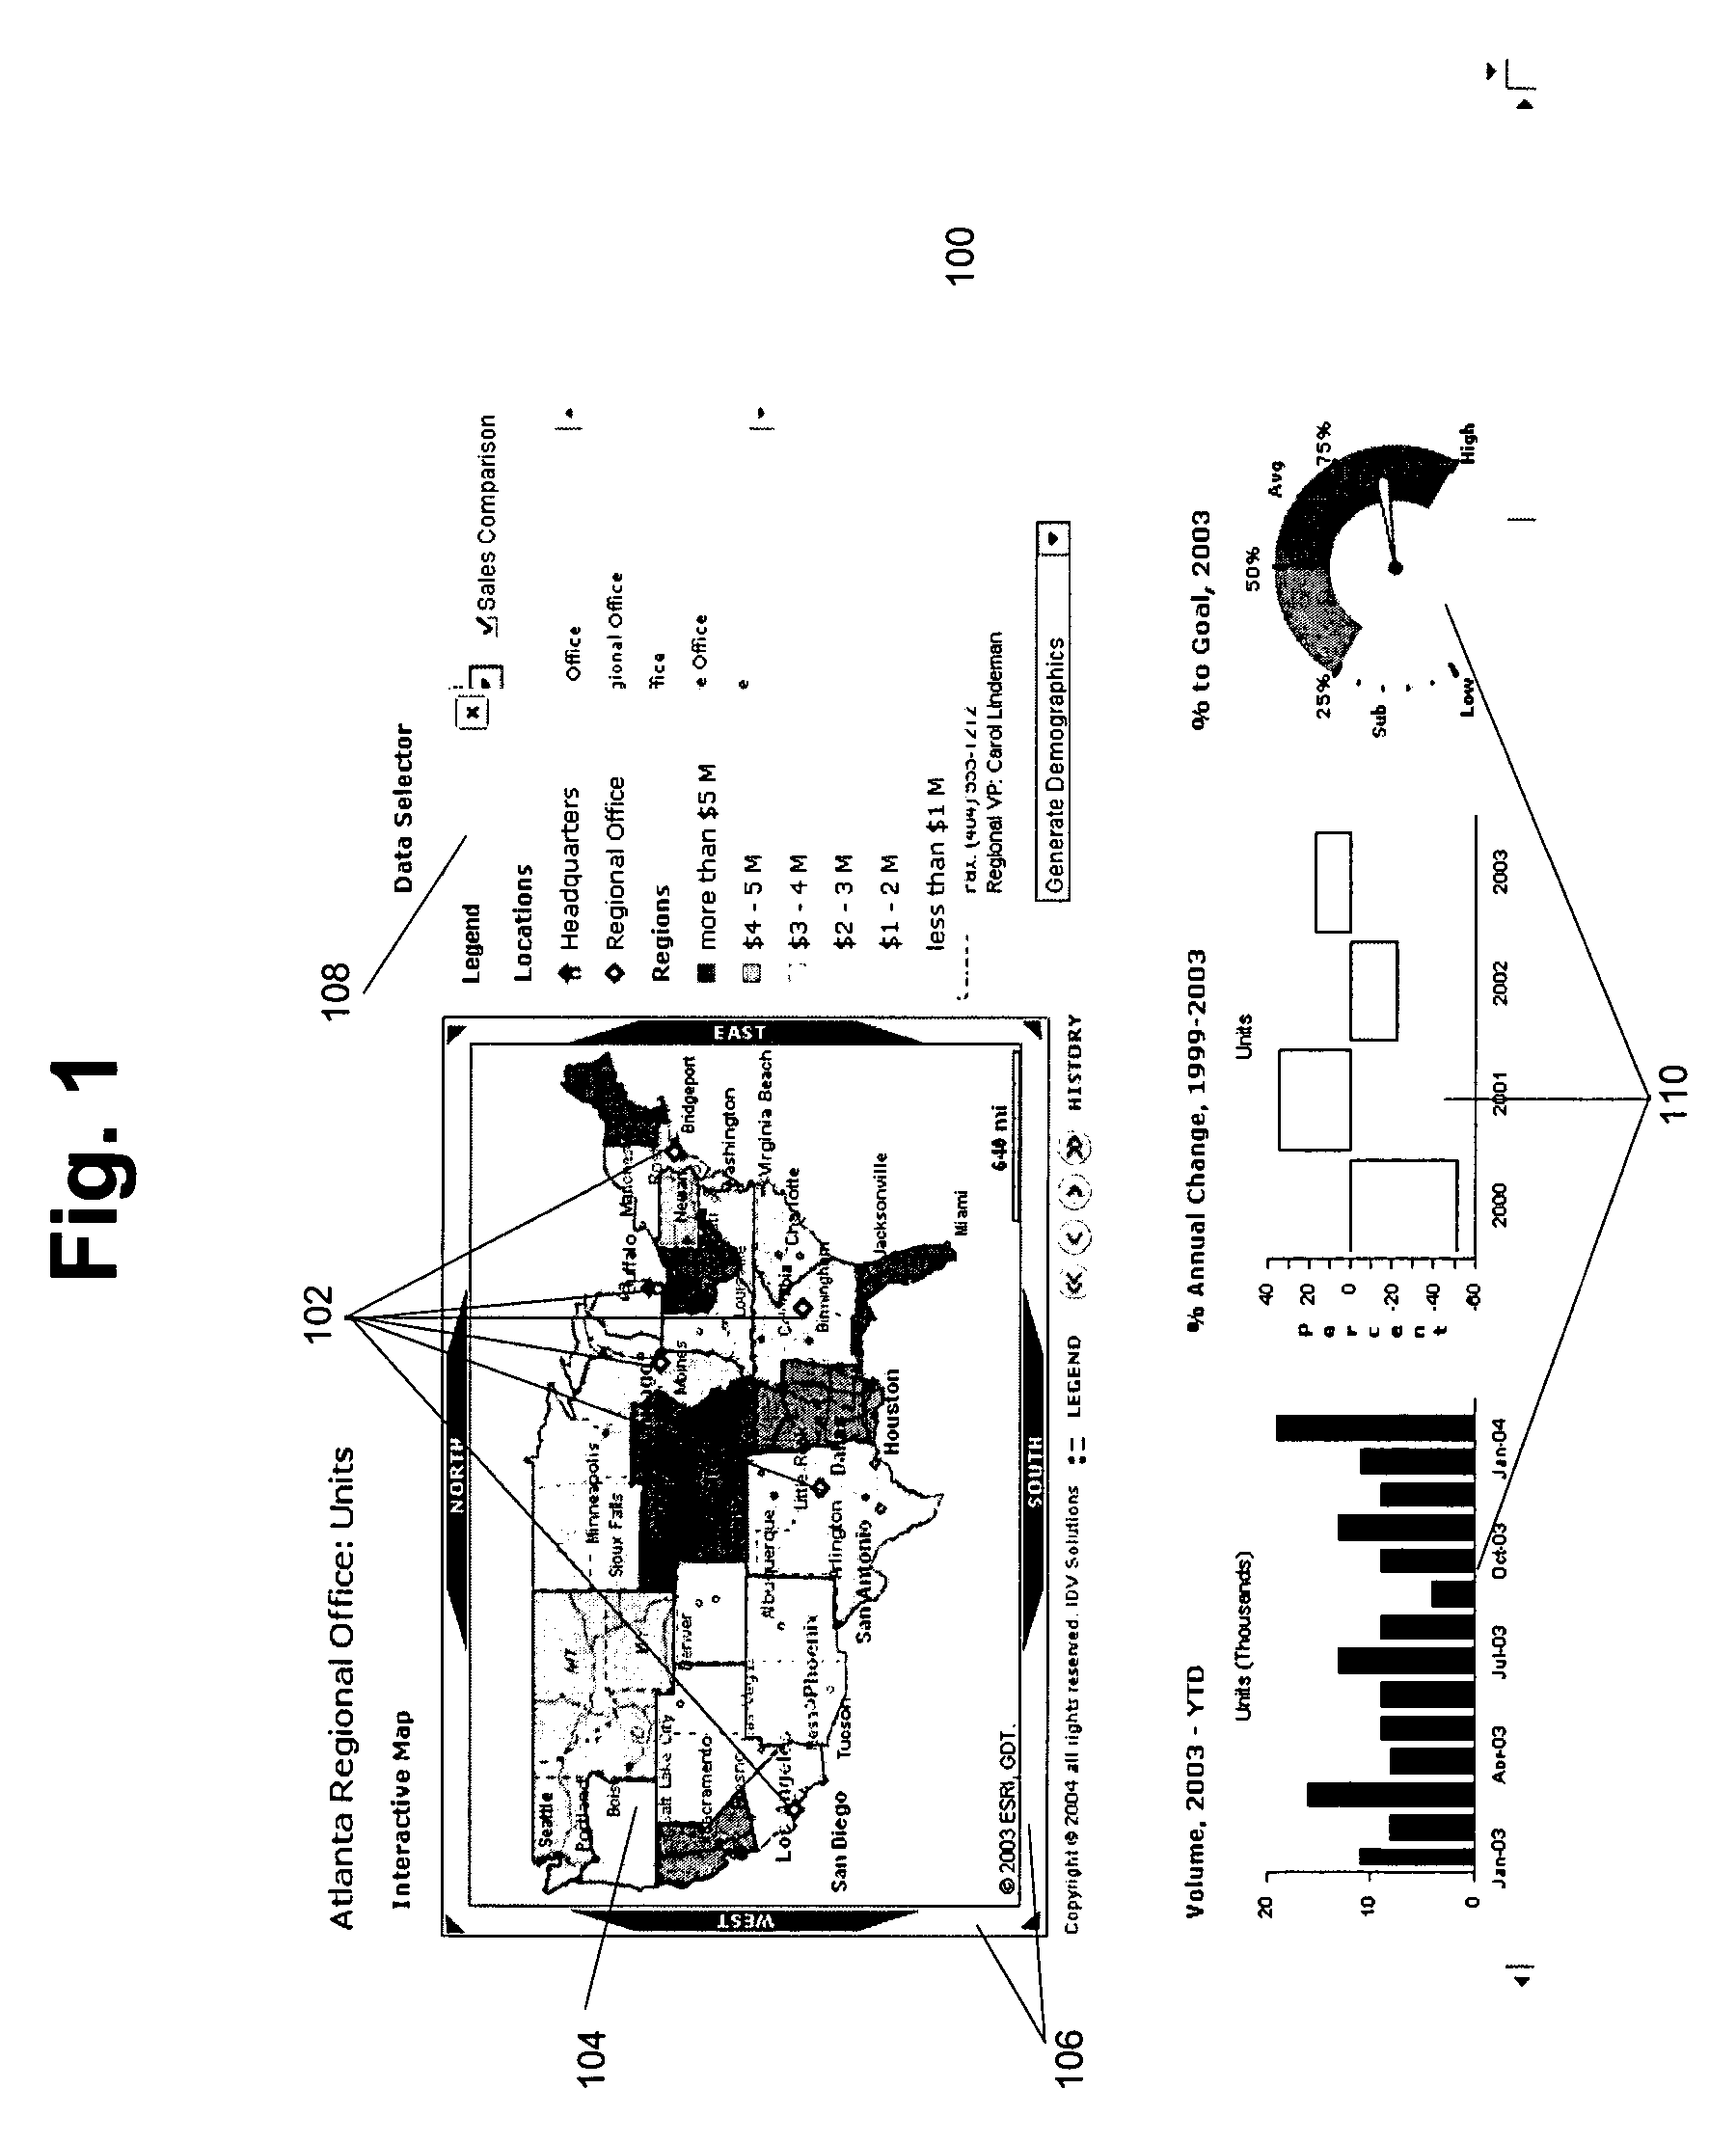
[0022]For example, FIG. 1 shows a report display 100, according to one embodiment. Report display 100 includes features 102 overlaid on an image 104, defined by a bounding box 106, in a graphical user interface. That is, bounding box 106 provides a common frame of reference for the display of features 102 and image 104. As explained in more detail b...


PUM


Abstract

A computer in the form of a client comprises a graphical user interface and a memory, the memory including a first data object for storing the feature data in a first format, and a second data object for storing the image data in a second format. The client computer is configured to send at least one query; receive at least one of the feature data and the image data in response to the at least one query; and display the feature data in the first format and the image data in the second format in the graphical user interface.

Description

FIELD[0001]The present application relates to graphical reporting of data.BACKGROUND[0002]Raster images, or bitmaps, are well known, and have long been used for the display of computer graphics. A bitmap is a pixel-by-pixel map of how an image should be rendered on a computer or video display or printout, defining the location, color, intensity, etc. of each pixel. Although numerous schemes for compressing bitmaps have been employed, including the JPEG (Joint Photographic Experts Group), GIF (Graphics Interchange Format), and PNG (Portable Network Graphics) standards, in general raster images suffer from the shortcoming that it is impractical to encode raster images with large amounts of information regarding the data attributes of raster image data. Thus, raster images are usually static and do not provide interactive functionality such as allowing a user to click on a certain point in an image to change how the image is displayed, or to obtain more information about a point or poi...

Claims


Application Information

Patent Timeline
IPC IPC(8): G09G5/00G09G5/14
CPCG06F3/1454G06F17/30554G06F3/1431G09G2370/16G09G2340/12G06F16/248
Inventor CLEMENS, IANPRASLA, RIYAZHOFFMAN, JUSTIN
Owner EVERBRIDGE
Why Eureka
Try Eureka