Time relevance-based visualization of data

a data relevance and data technology, applied in the field of time relevance-based visualization of data, can solve the problems of difficult and cumbersome data viewing, difficult to maintain data in context,

Active Publication Date: 2011-04-12
HEWLETT-PACKARD ENTERPRISE DEV LP
View PDF71 Cites 37 Cited by
  • Summary
  • Abstract
  • Description
  • Claims
  • Application Information

AI Technical Summary

Problems solved by technology

However, as the number of data points grows, the sheer volume of data can make viewing the data difficult and cumbersome.
However, forcing

Method used


Image

  • Time relevance-based visualization of data
  • Time relevance-based visualization of data
  • Time relevance-based visualization of data

Examples


Embodiment Construction

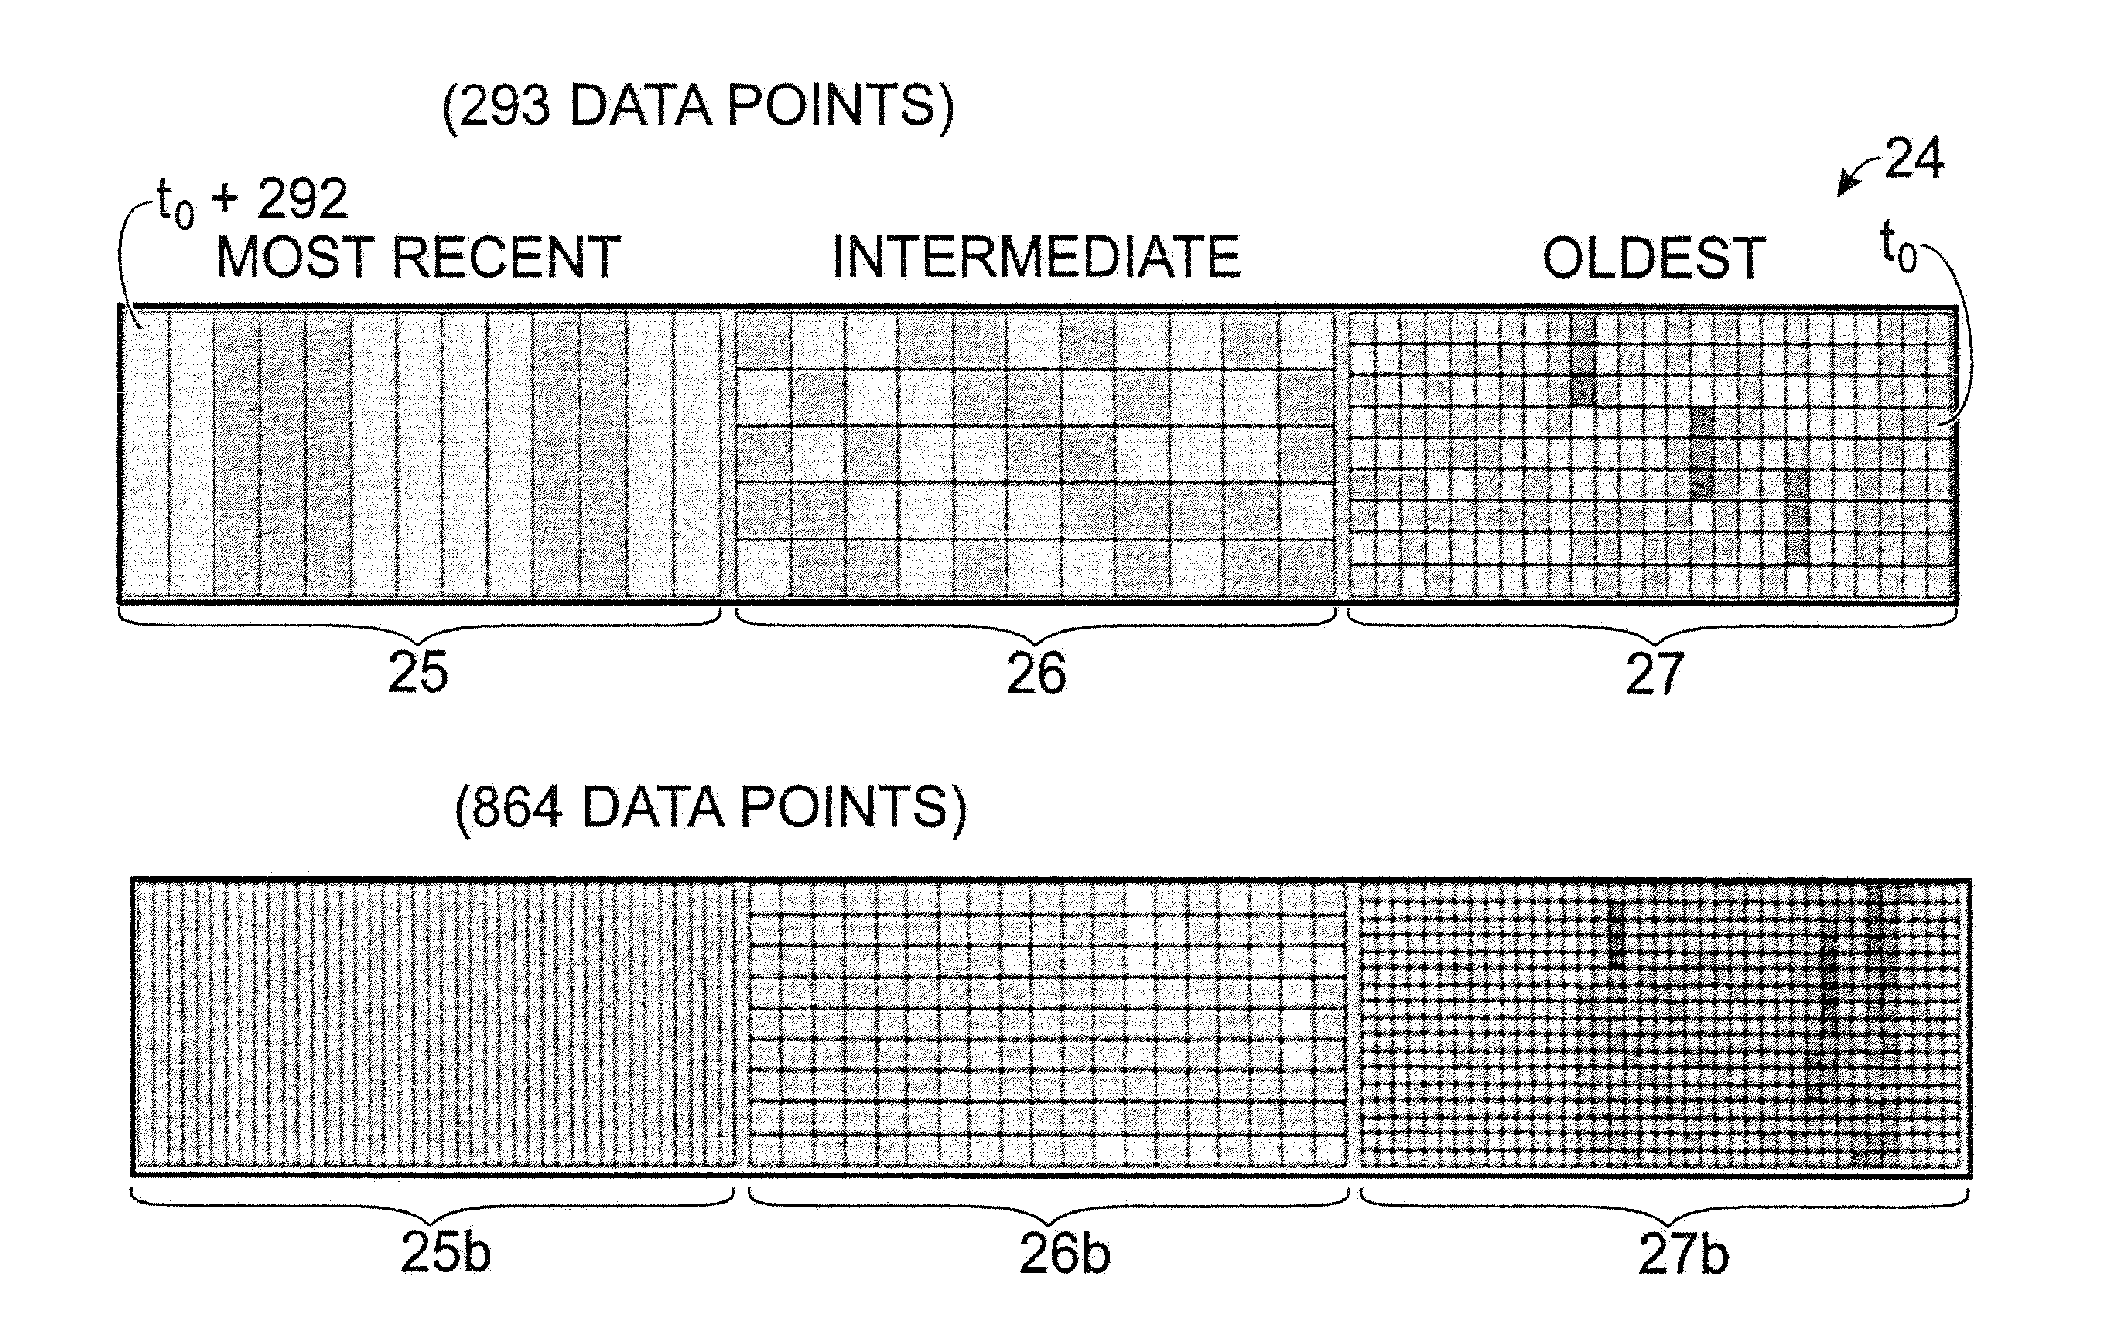
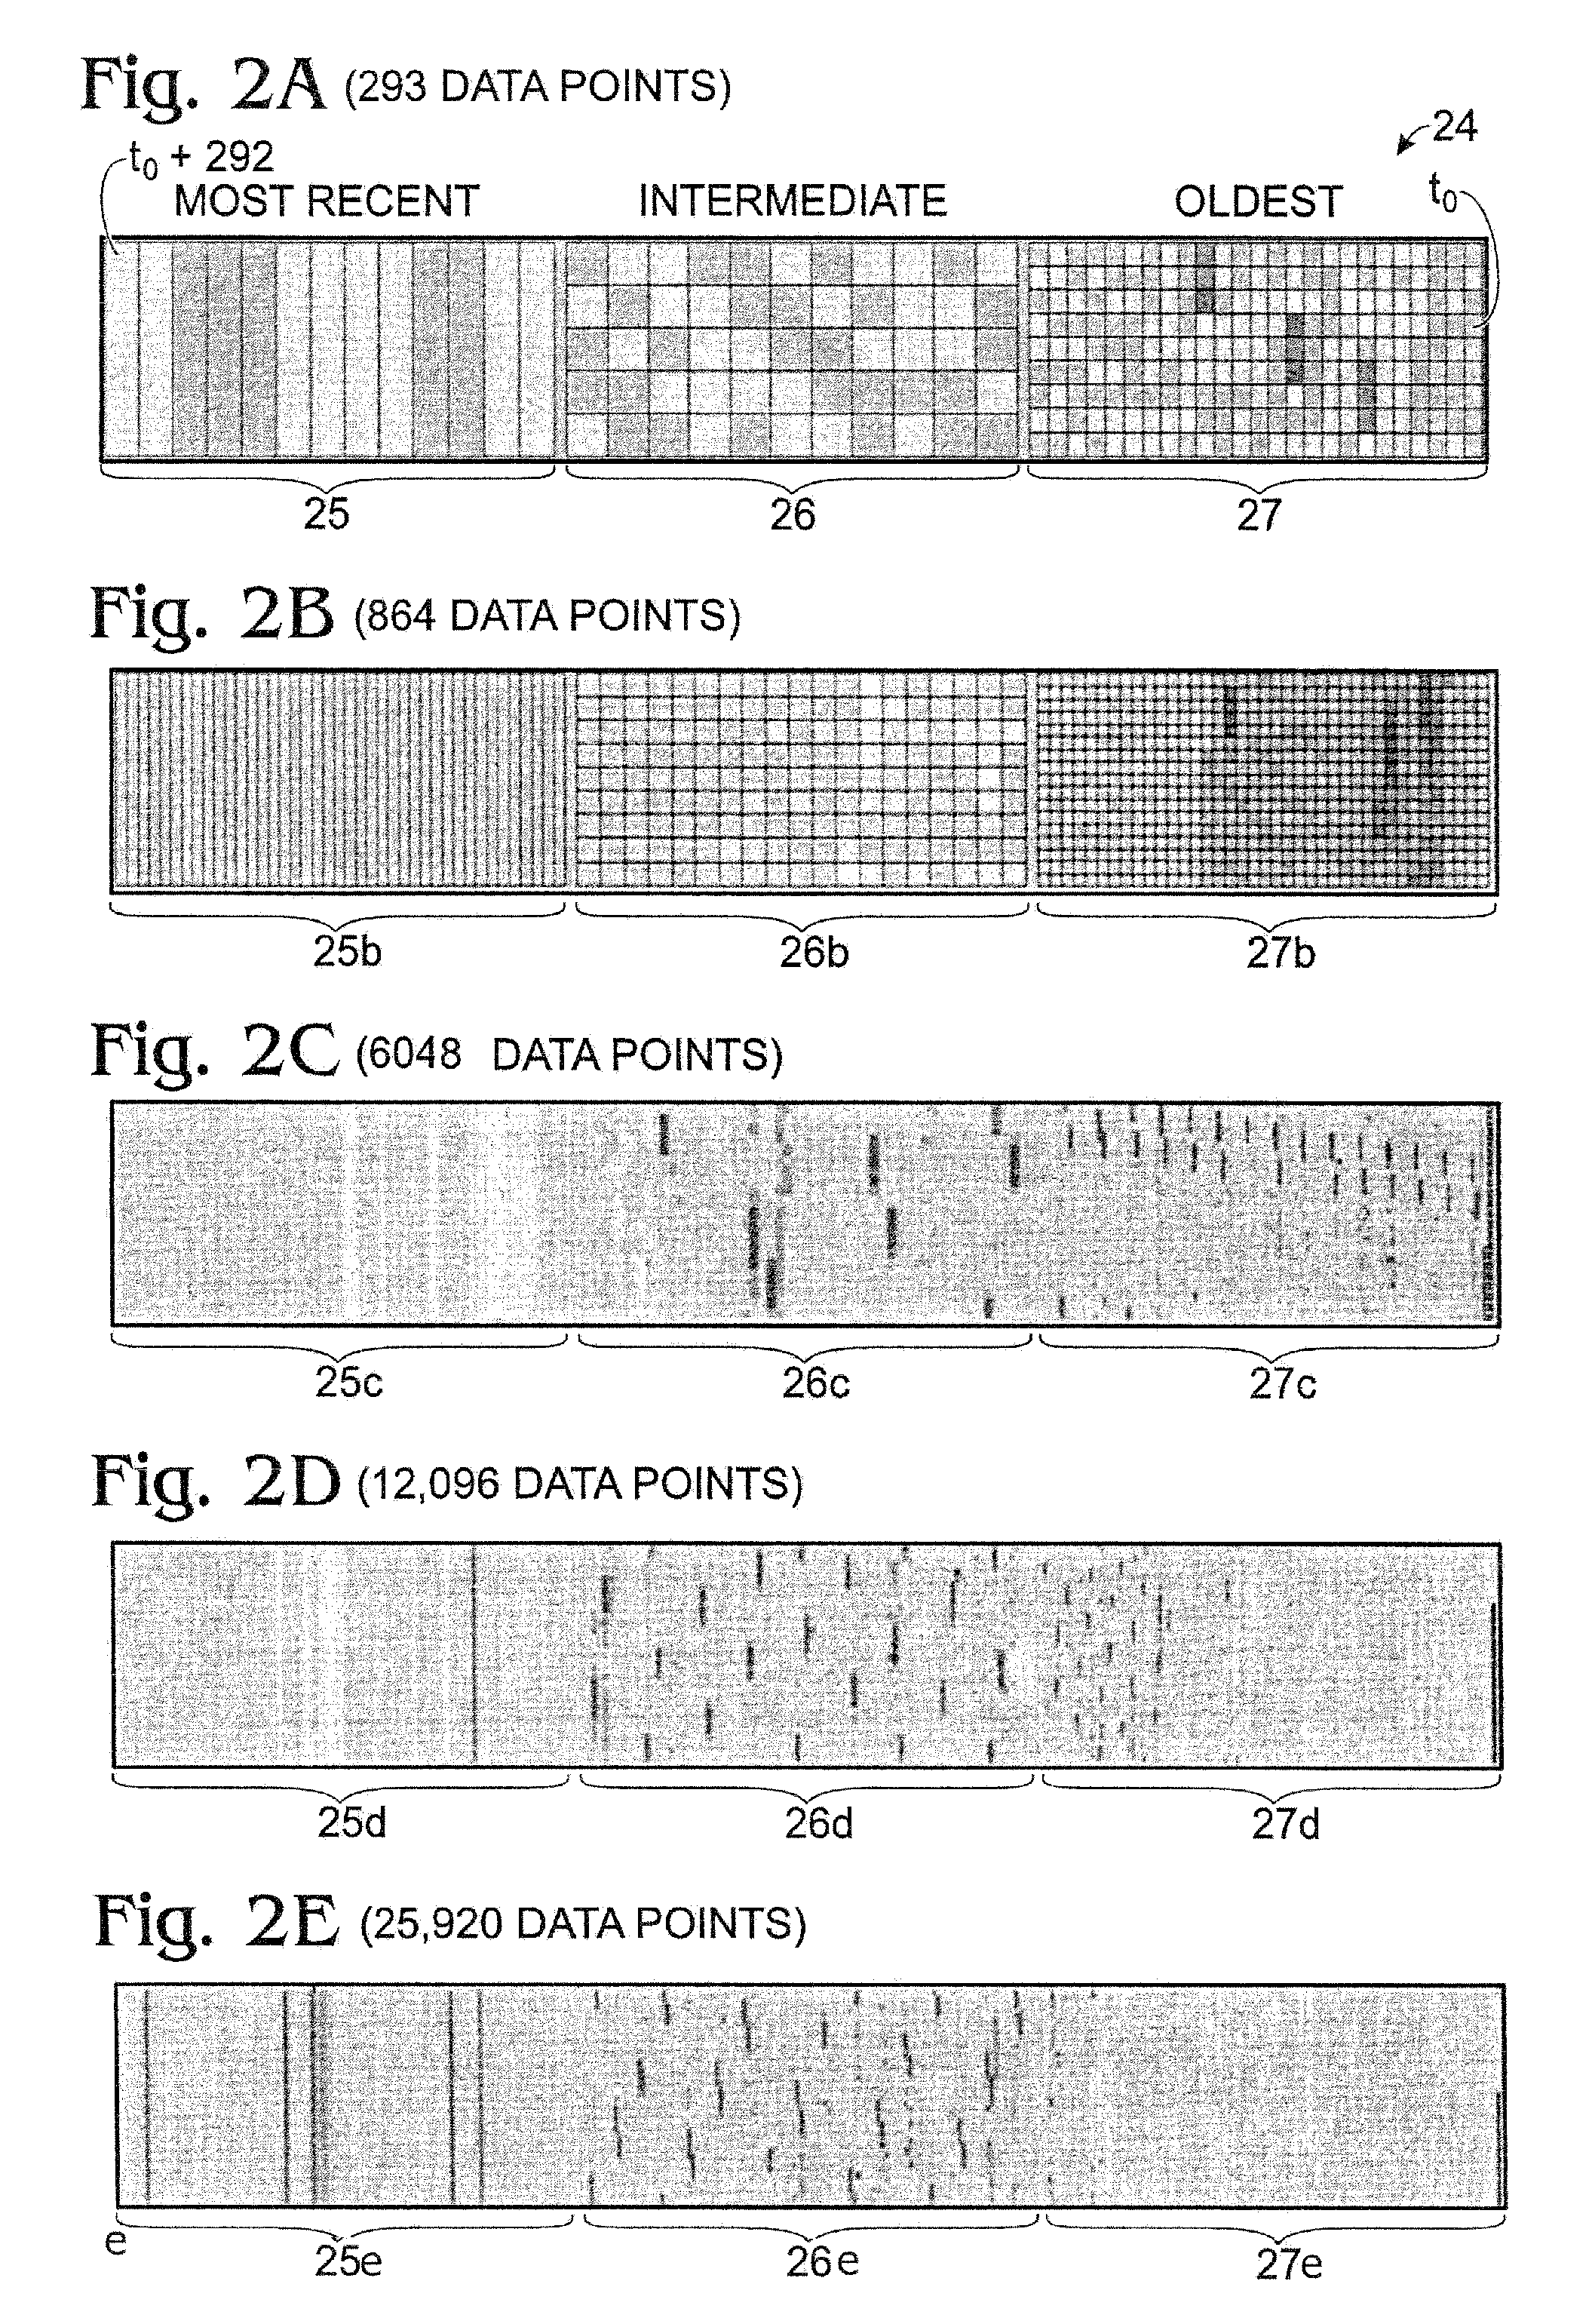
The present disclosure provides methods and systems for employing time relevance-based nonlinear distortion techniques to represent large time series data in a user-friendly manner. According to one aspect of the invention, the goal is to provide the user with an easy to understand representation of a large amount of data that allows the user to view all the data in a single display, but in different contexts according to the importance of the data.

For the purposes of the present disclosure, the term “display” includes any visual representation of the data, regardless of the format in which it is delivered or otherwise made viewable. Accordingly, a display may be provided on or included as part of a computer monitor, a handheld device (PDA, cell phone, etc.) screen, paper, pamphlet, projection, hologram, watermark, etc.

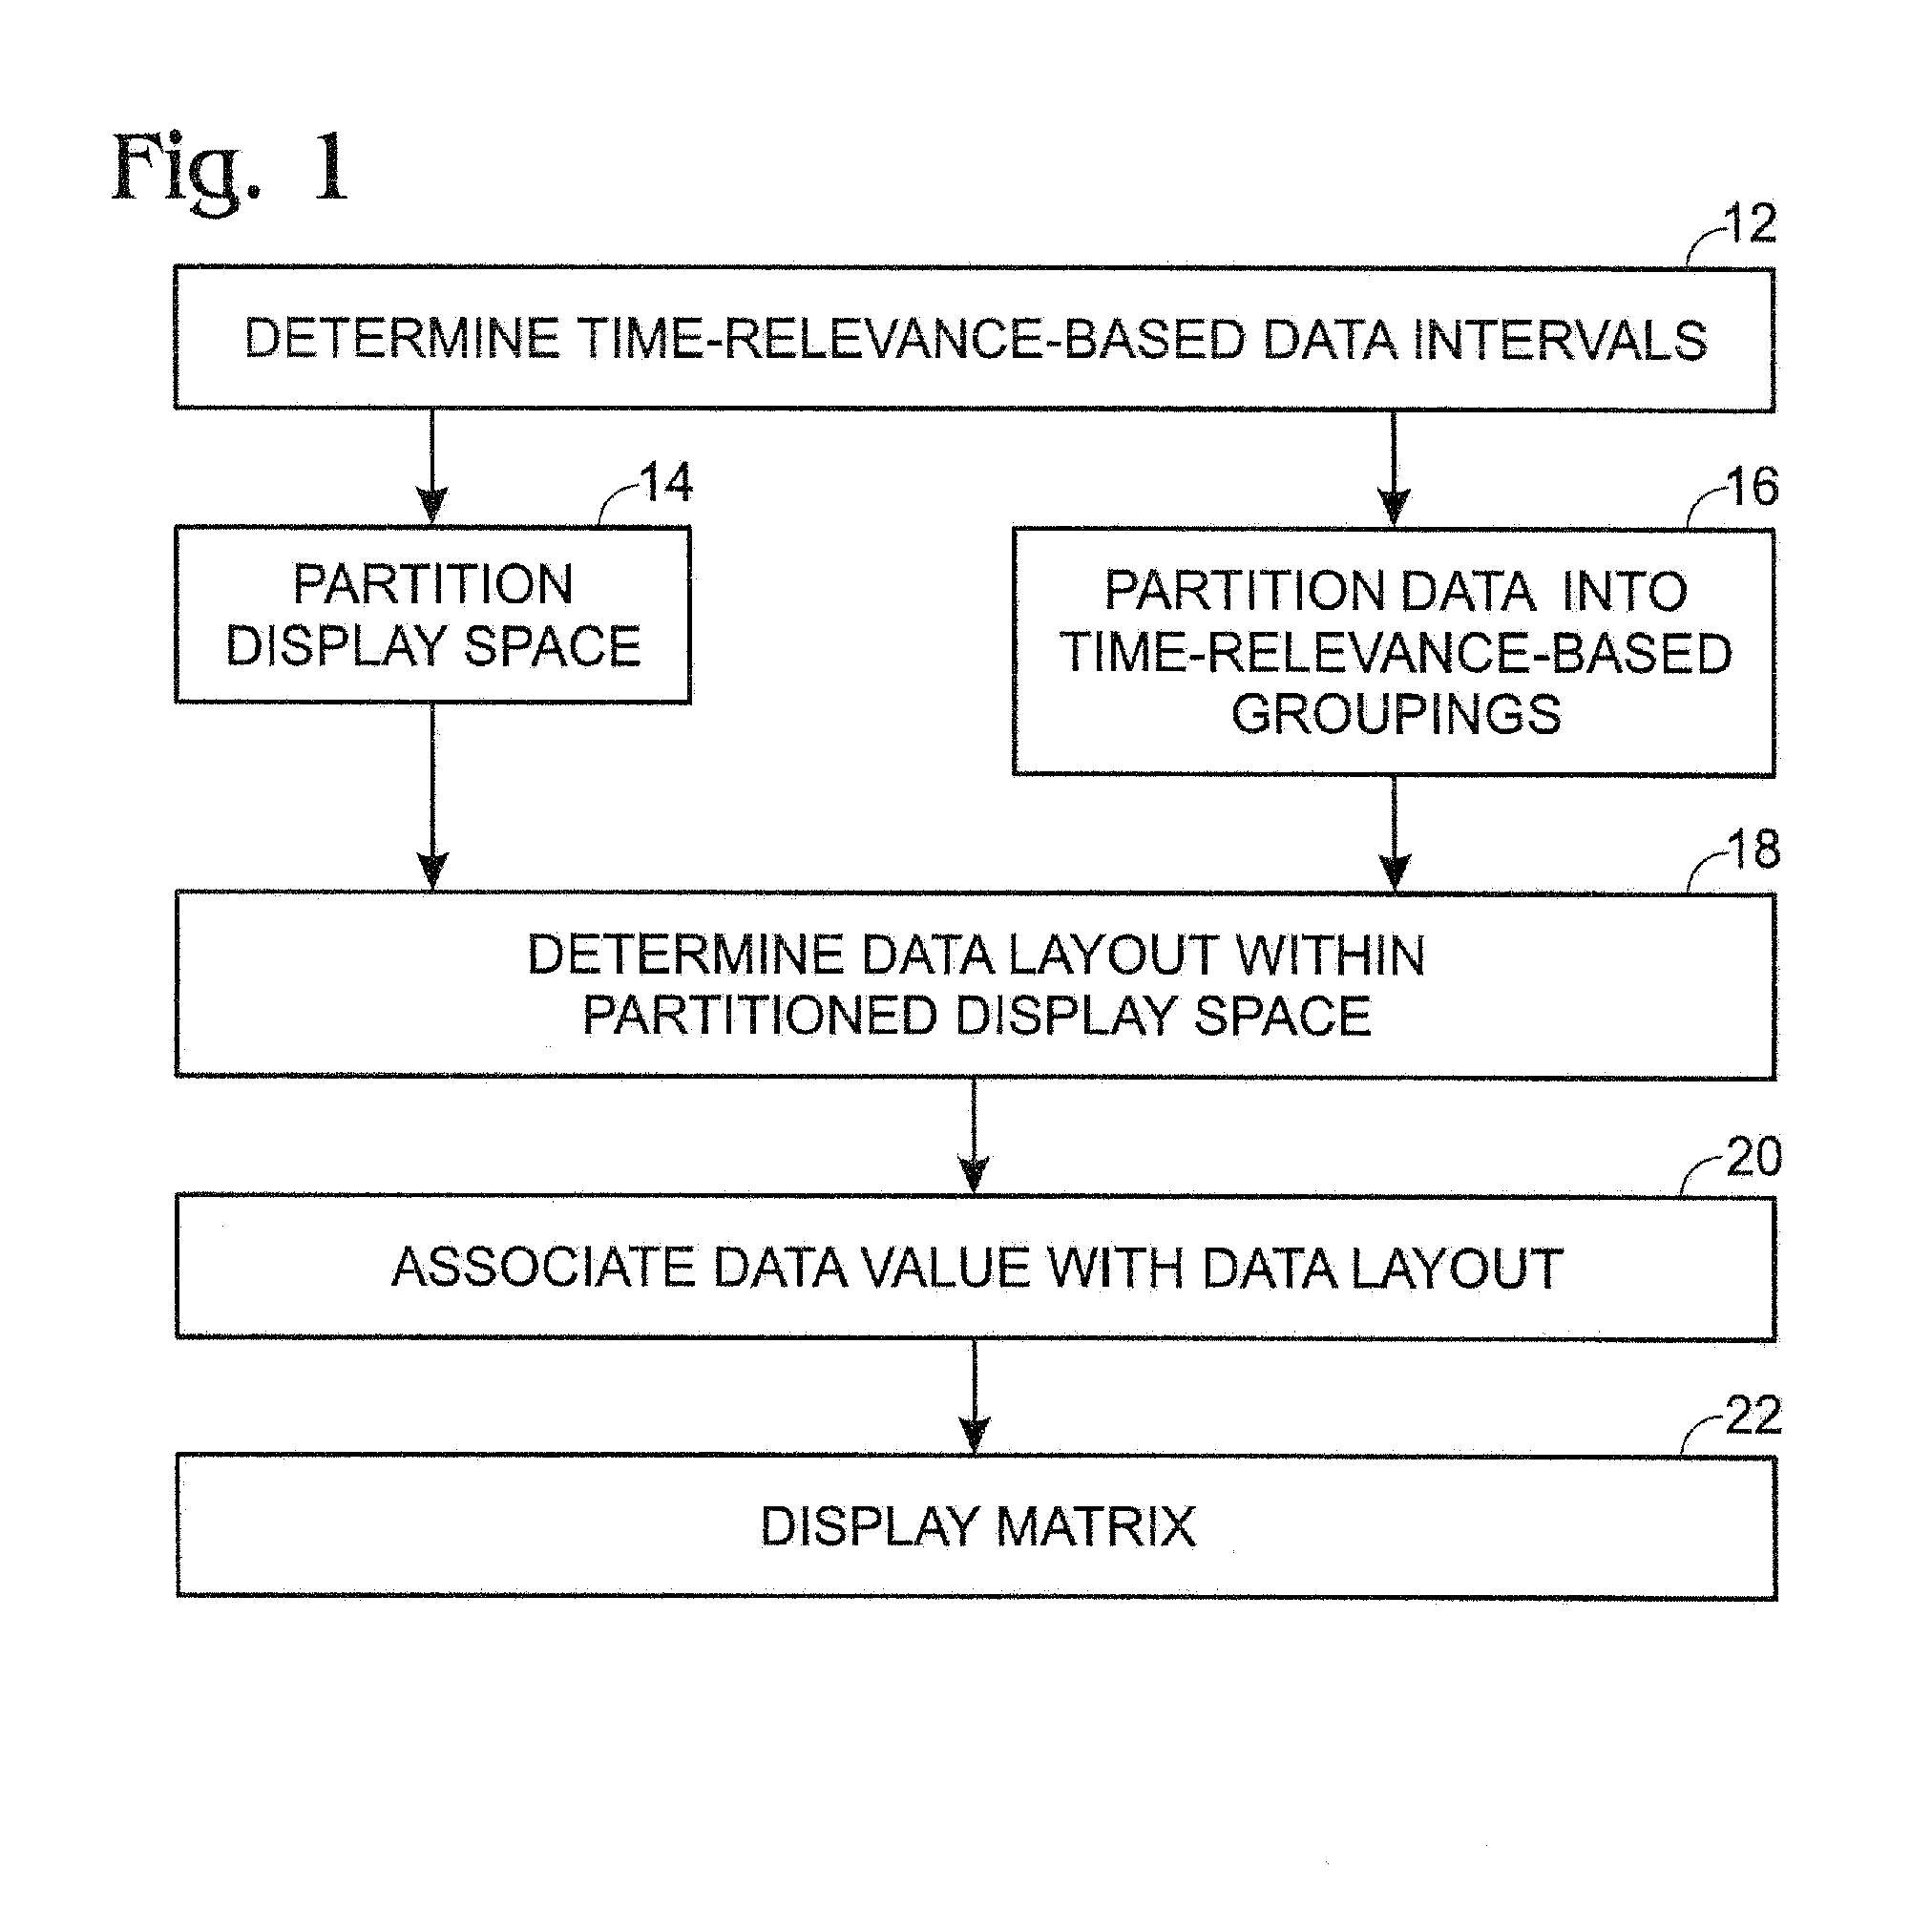
FIG. 1 is a flow chart representing a simplified embodiment of a method for creating a multi-resolution (MR) time series display according to the present invention. T...


PUM


Abstract

A method for displaying a time-series data set. The method may include determining a number of data intervals for the data set, determining a data resolution for each data interval, partitioning a display space into a number of substantially equally sized partitions equal to the number of data intervals, partitioning the dataset into a number of time-relevance-based subsets equal to the number of partitions based on the currentness of the data and the desired data resolution for each partition, determining a data layout for each partition, and associating the data values for each subset with the corresponding layout. Furthermore, the first subset may consist of more current data at a first resolution and the second subset may consist of data that is less current than the first subset at a lower resolution than the first resolution.

Description

BACKGROUNDIt is both common and useful to collect large amounts of data over a long period of time for a wide variety of applications. For example, data tracking stock prices, ozone levels, room temperatures, server usage, etc. can be collected and analyzed for any number of reasons—both personal and professional. However, as the number of data points grows, the sheer volume of data can make viewing the data difficult and cumbersome. Typically, large time series data is presented in a single resolution, linear fashion. For example, the fluctuations in a stock price over time are often presented by plotting evenly dispersed time points against stock price in a X-Y graph.If, as often happens, there are more data points than can reasonably be displayed in the allocated display space (e.g. a sheet of paper, a window on a computer screen), the user is typically provided with two options: first, the data is maintained at the same resolution and the display space is enlarged (e.g. by addin...

Claims


Application Information

Patent Timeline
IPC IPC(8): G06T11/20
CPCG06T11/206
Inventor HAO, MINGSCHRECK, TOBIASDAYAL, UMESHWARKEIM, DANIEL A.
Owner HEWLETT-PACKARD ENTERPRISE DEV LP
Why Eureka
Try Eureka