Method and system for image evaluation data analysis

a data analysis and image technology, applied in the field of computer software and systems, can solve the problems of limited survey distribution, difficult to identify meaningful patterns, high analysis costs, etc., and achieve the effects of reducing the dimensionality of designated area data

Active Publication Date: 2011-12-27
XEROX CORP
View PDF7 Cites 26 Cited by
  • Summary
  • Abstract
  • Description
  • Claims
  • Application Information

AI Technical Summary

Problems solved by technology

Although much useful data may be gathered using this method, it presents several significant problems.
The most serious include high analysis costs, difficulty in identifying meaningful patterns, limited survey distribution, and the extended amount of time necessary to complete the test itself.
Although computer surveys offered the benefits of electronic data collection and wider survey distribution, there was no means for respondents to physically draw and write on pages.
No existing survey applications permit respondents to draw on images to specify areas of interest and then comment on those areas.
Nor are existing tools able to compile and analyze such data, in an accurate and easily comprehended manner.

Method used


Image

  • Method and system for image evaluation data analysis
  • Method and system for image evaluation data analysis
  • Method and system for image evaluation data analysis

Examples


Embodiment Construction

[0021]In the following detailed description, reference is made to the accompanying drawings, which form a part hereof, and in which is shown by way of illustration specific illustrative embodiments in which the invention may be practiced. These embodiments are described in sufficient detail to enable those skilled in the art to practice the invention, and it is to be understood that other embodiments may be utilized and that logical, mechanical and electrical changes may be made without departing from the scope of the disclosure. The following detailed description is, therefore, not to be taken in a limiting sense.

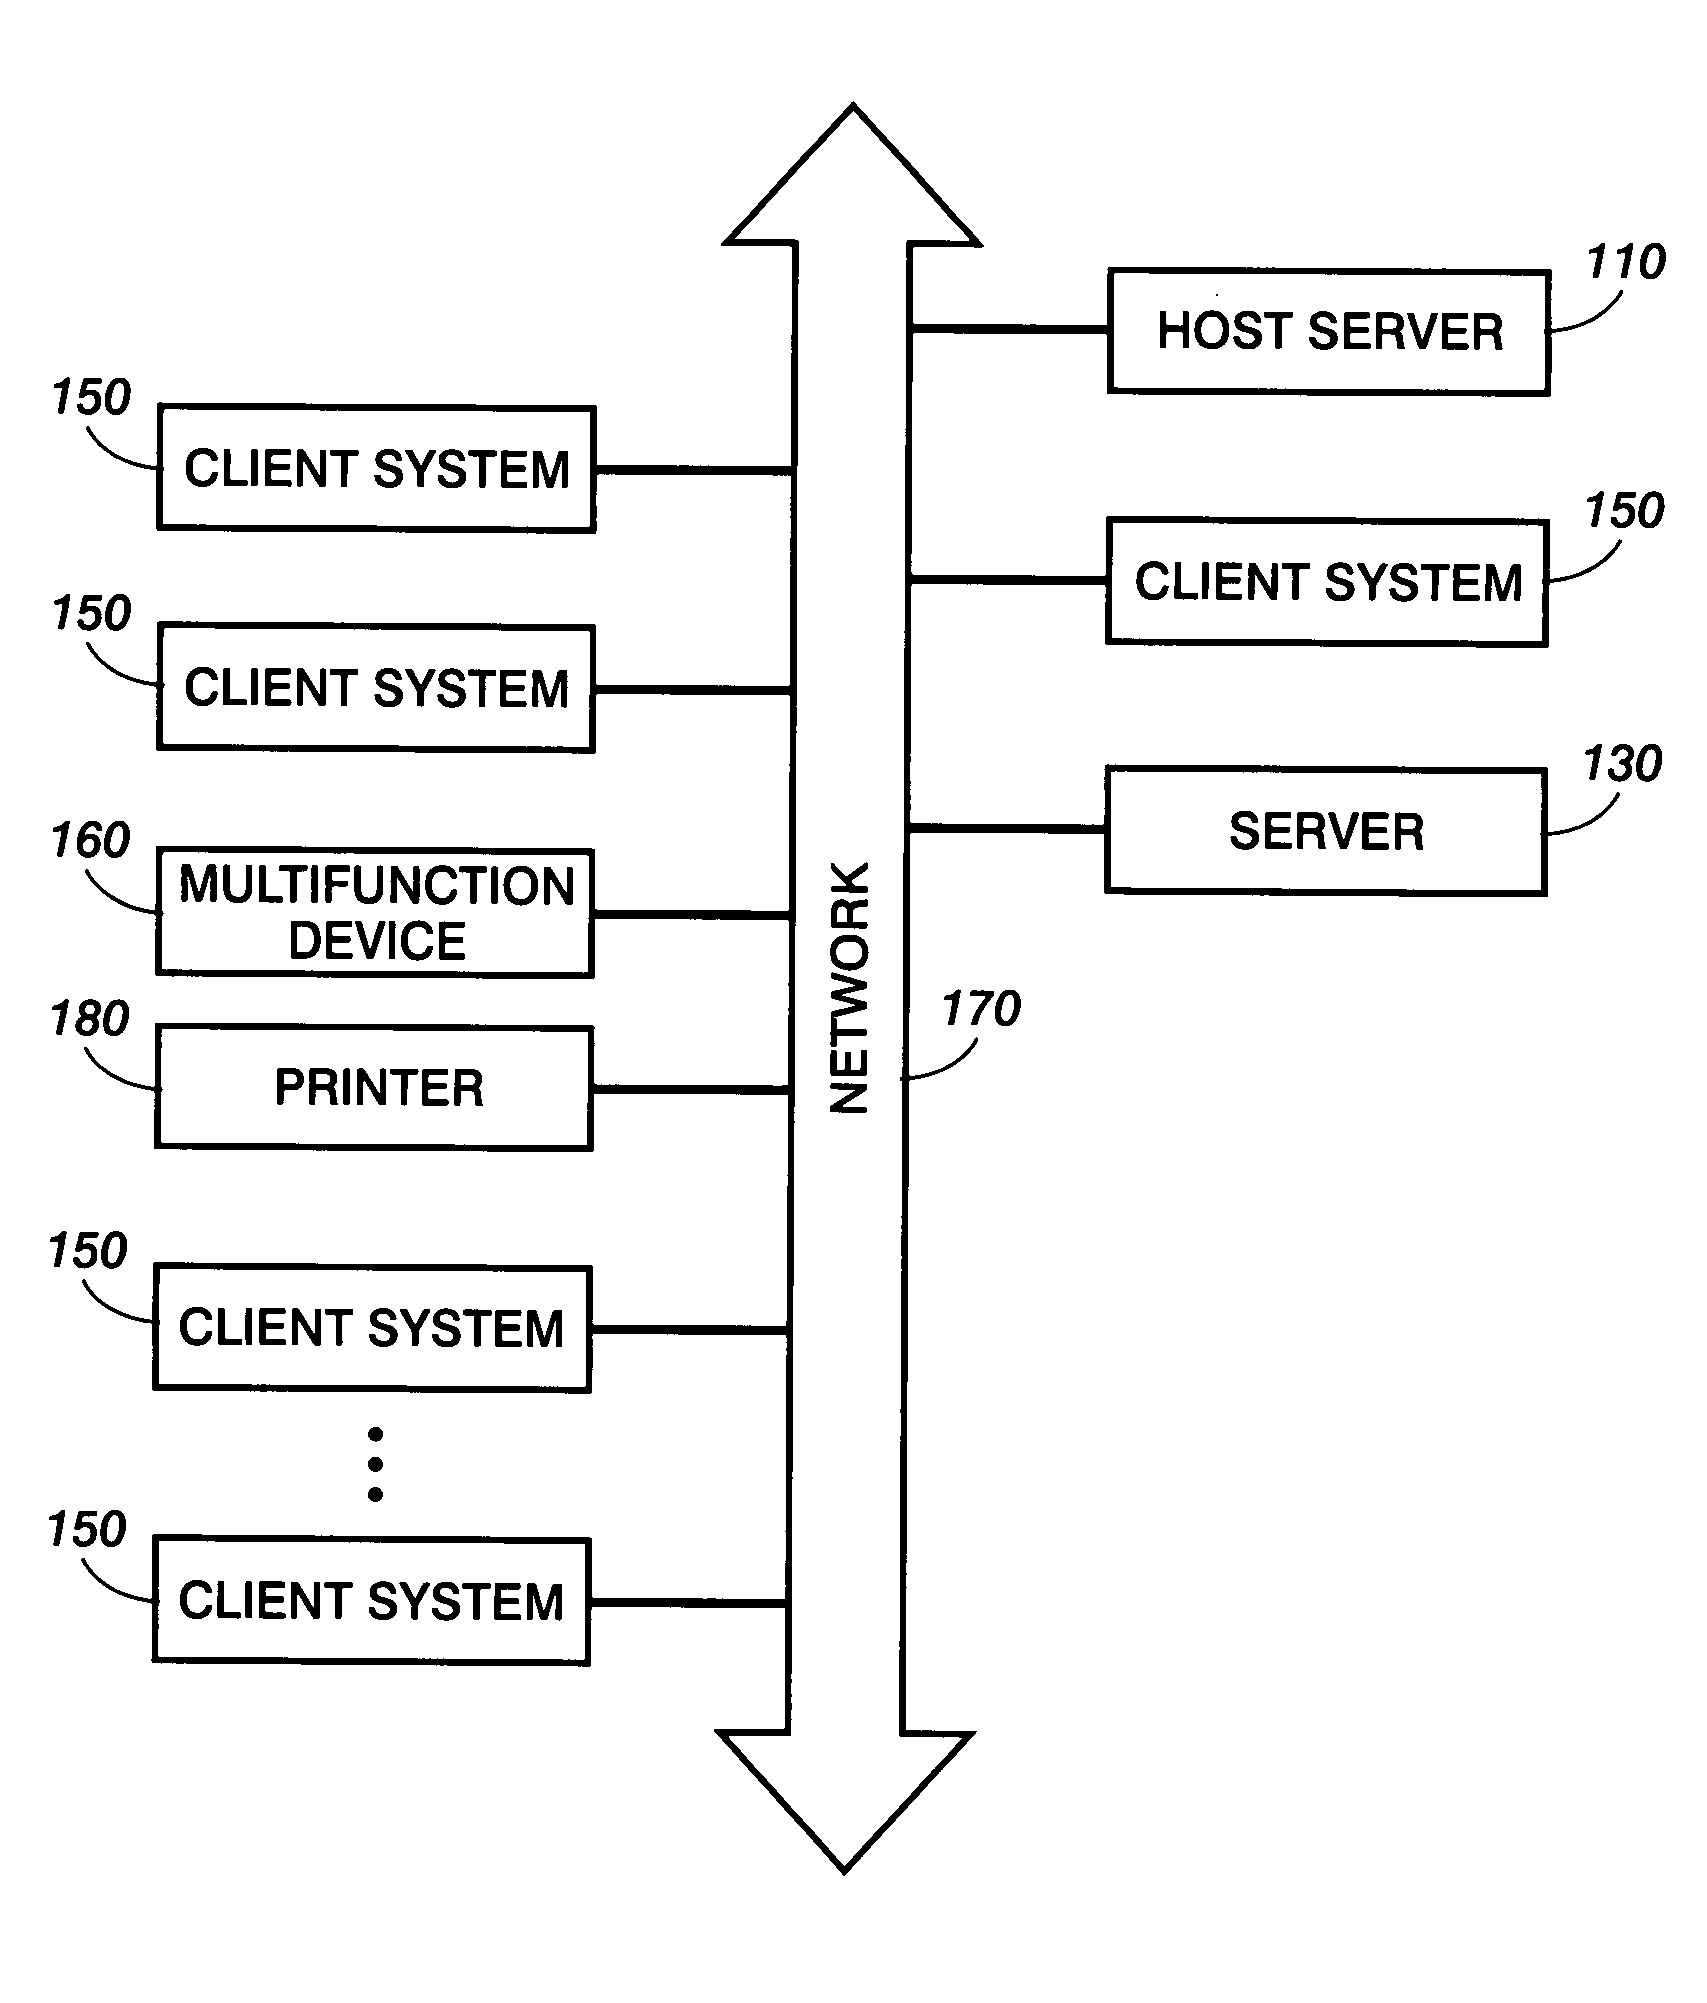
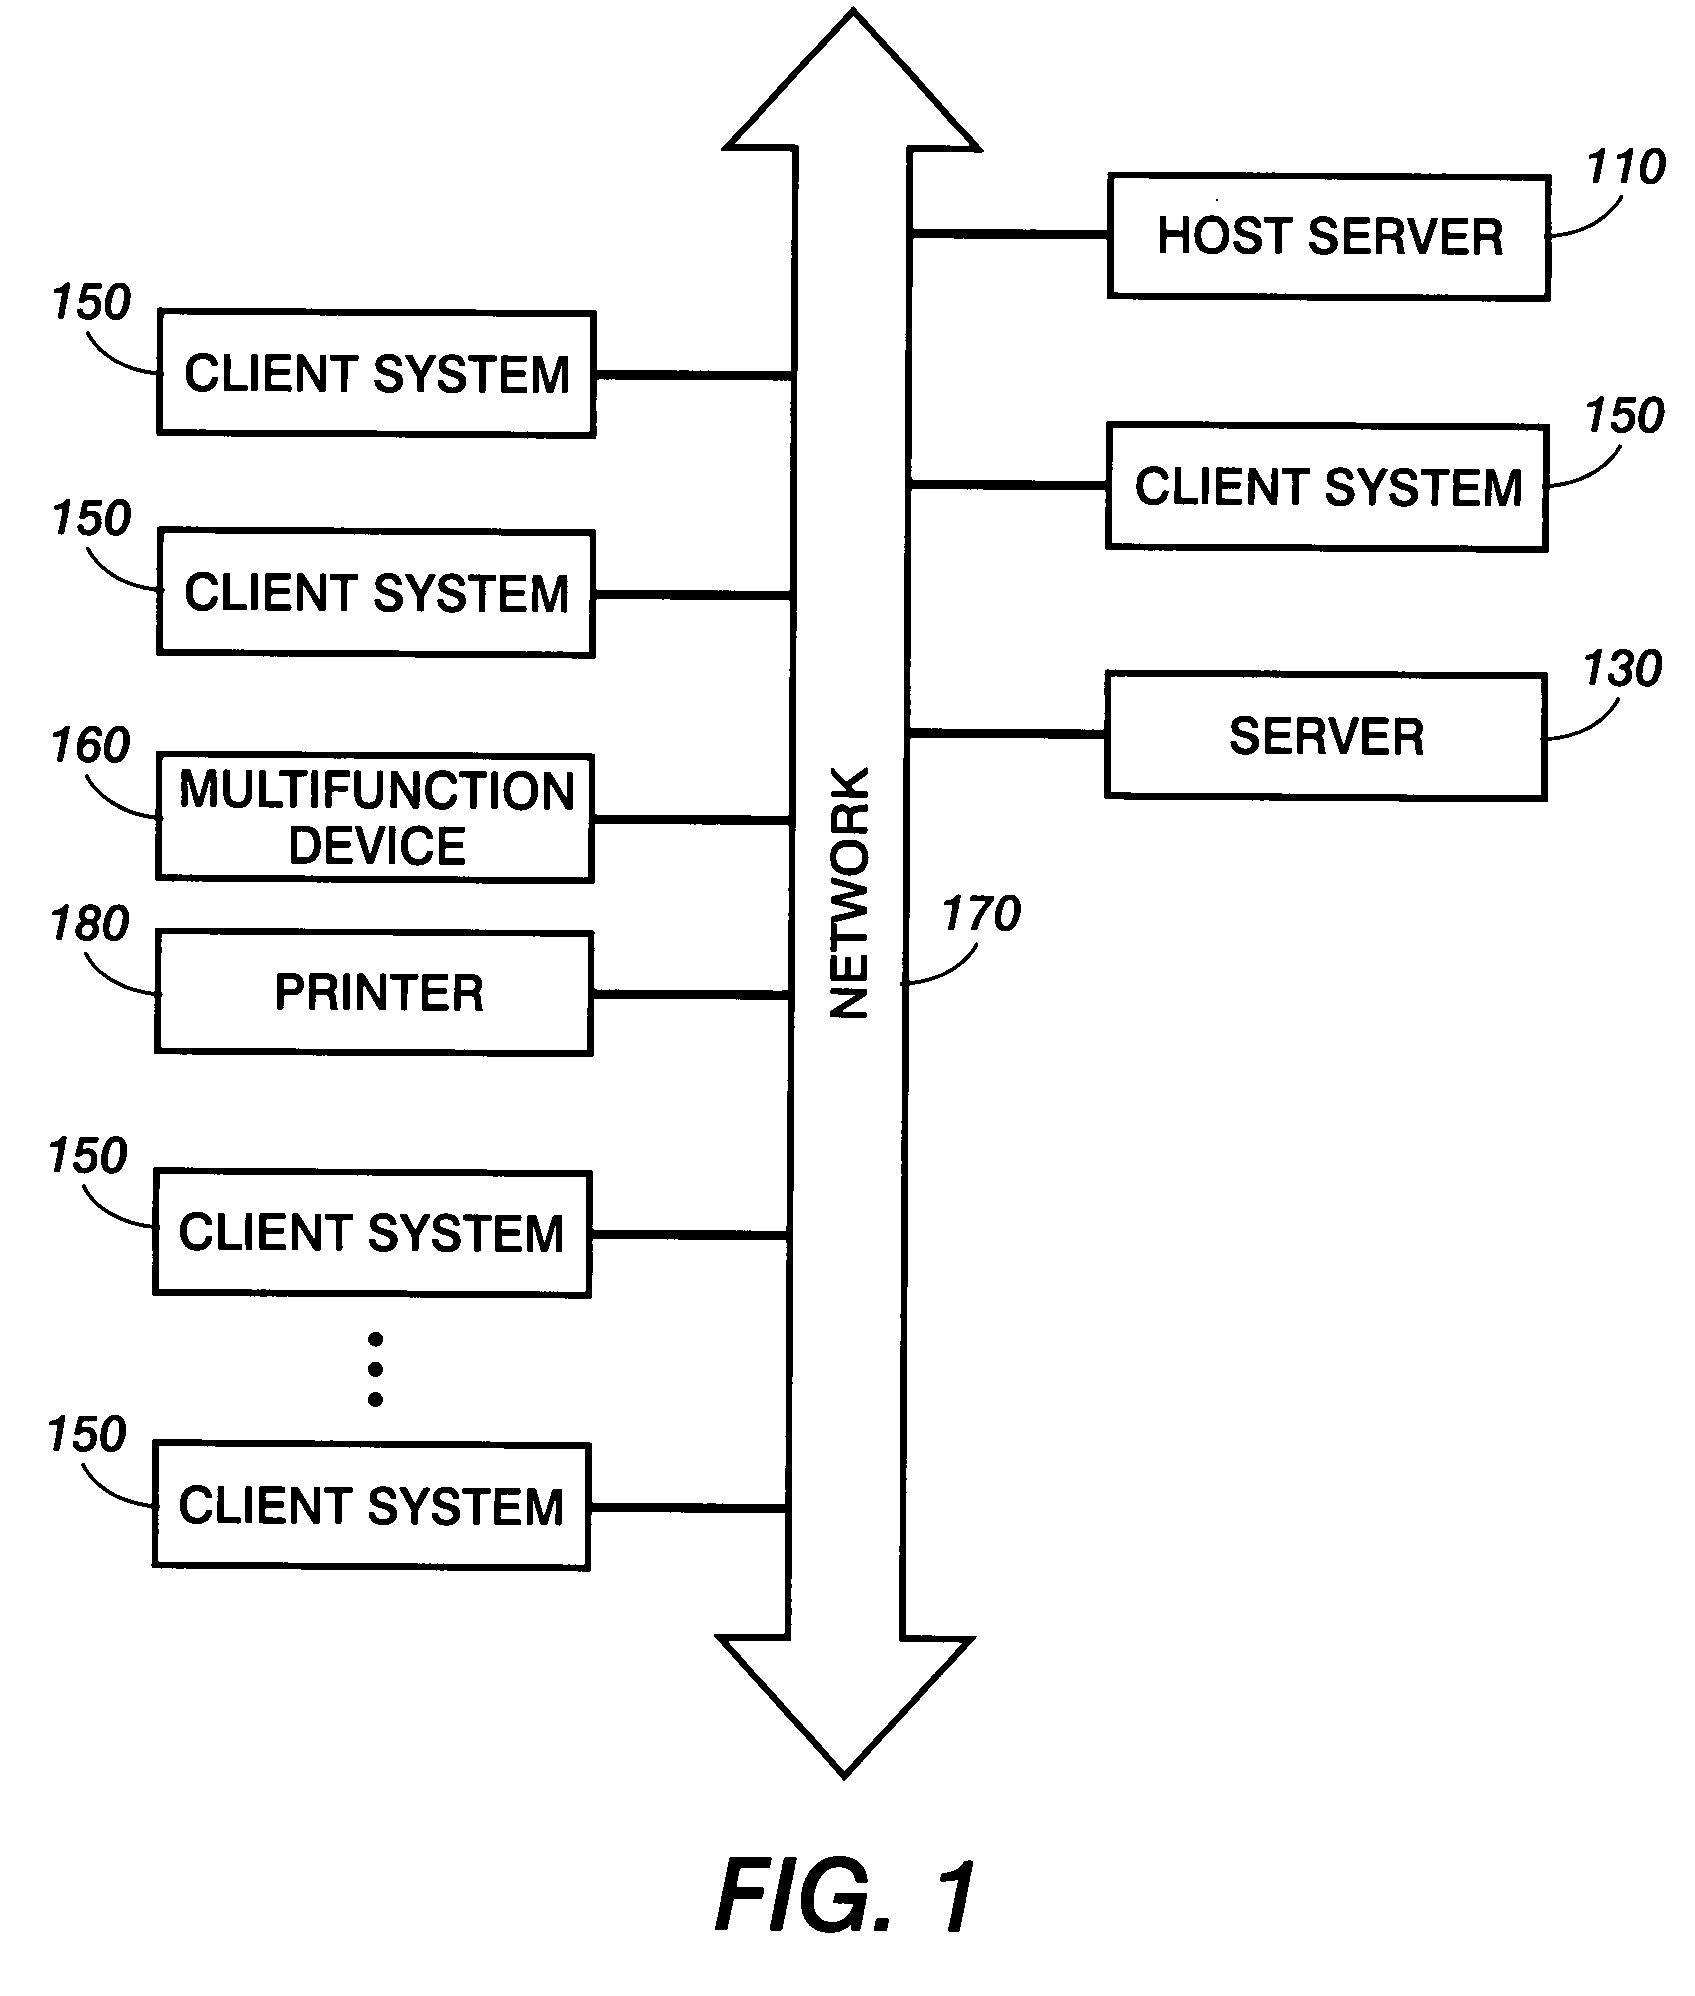
[0022]The product design evaluation system described herein presents proposed designs to survey respondents, and their feedback is collected via, for example, individual personal computers connected in a network such as an intranet, an extranet, or the internet. It is possible to control the interpersonal dynamics among the respondents. It is also possible to isolate them ...


PUM


Abstract

A method is provided for operating a computer to analyze image evaluation data from electronic survey respondents to evaluate preferences related to two dimensional and three dimensional images. Data files, which include designated area data, image attributes, and survey respondent opinions for one or more images in an electronic survey, are received. A graphical user interface permits an operator to reformat the designated area data and set analysis parameters. Cluster analysis is performed on the data files to reduce the dimensionality of the designated area data and to classify areas of the survey images that generate positive and negative responses. The analysis produces coordinate data to map cluster classifications and for construction of a heat map. In association with descriptive statistical analysis, cluster score evaluation is performed to identify the clusters of interest. Respondent comments and results from the statistical analysis are linked to clusters of interest.

Description

CROSS-REFERENCE TO RELATED APPLICATIONS[0001]The following co-pending applications, U.S. application Ser. No. 11 / 717,856, filed Mar. 14, 2007, titled “Graphical User Interface for Gathering Image Evaluation Information”, and U.S. application Ser. No. 11 / 717,855, filed Mar. 14, 2007, titled “Graphical User Interface for Presenting Image Evaluation Information”, are assigned to the same assignee of the present application. The entire disclosures of these co-pending applications are totally incorporated herein by reference in their entireties.BACKGROUND AND SUMMARY[0002]This disclosure relates generally to computer software and systems, particularly business application software and systems, and more particularly graphical user interfaces for the evaluation of preferences related to two-dimensional and three-dimensional images.[0003]Product manufacturers operating globally utilize market research studies to obtain direct feedback about customer needs, values, and buying trends. For the...

Claims


Application Information

Patent Timeline
Patent Type & Authority Patents(United States)
IPC IPC(8): G06K9/62
CPCG06Q30/02
Inventor PENKE, MARK S.BROWN, DONALD A.CAMPBELL, SARAH E.KARN, KEITH S.JULIANO, CORNELLPARSONS, DAVID M.
Owner XEROX CORP
Why Eureka
Try Eureka