Prioritization of reports using content data change from baseline

Active Publication Date: 2013-07-23
TREND MICRO INC
View PDF21 Cites 15 Cited by
  • Summary
  • Abstract
  • Description
  • Claims
  • Application Information

AI Technical Summary

Problems solved by technology

An unimportant report can mean that the report's content

Method used


Image

  • Prioritization of reports using content data change from baseline
  • Prioritization of reports using content data change from baseline
  • Prioritization of reports using content data change from baseline

Examples


Embodiment Construction

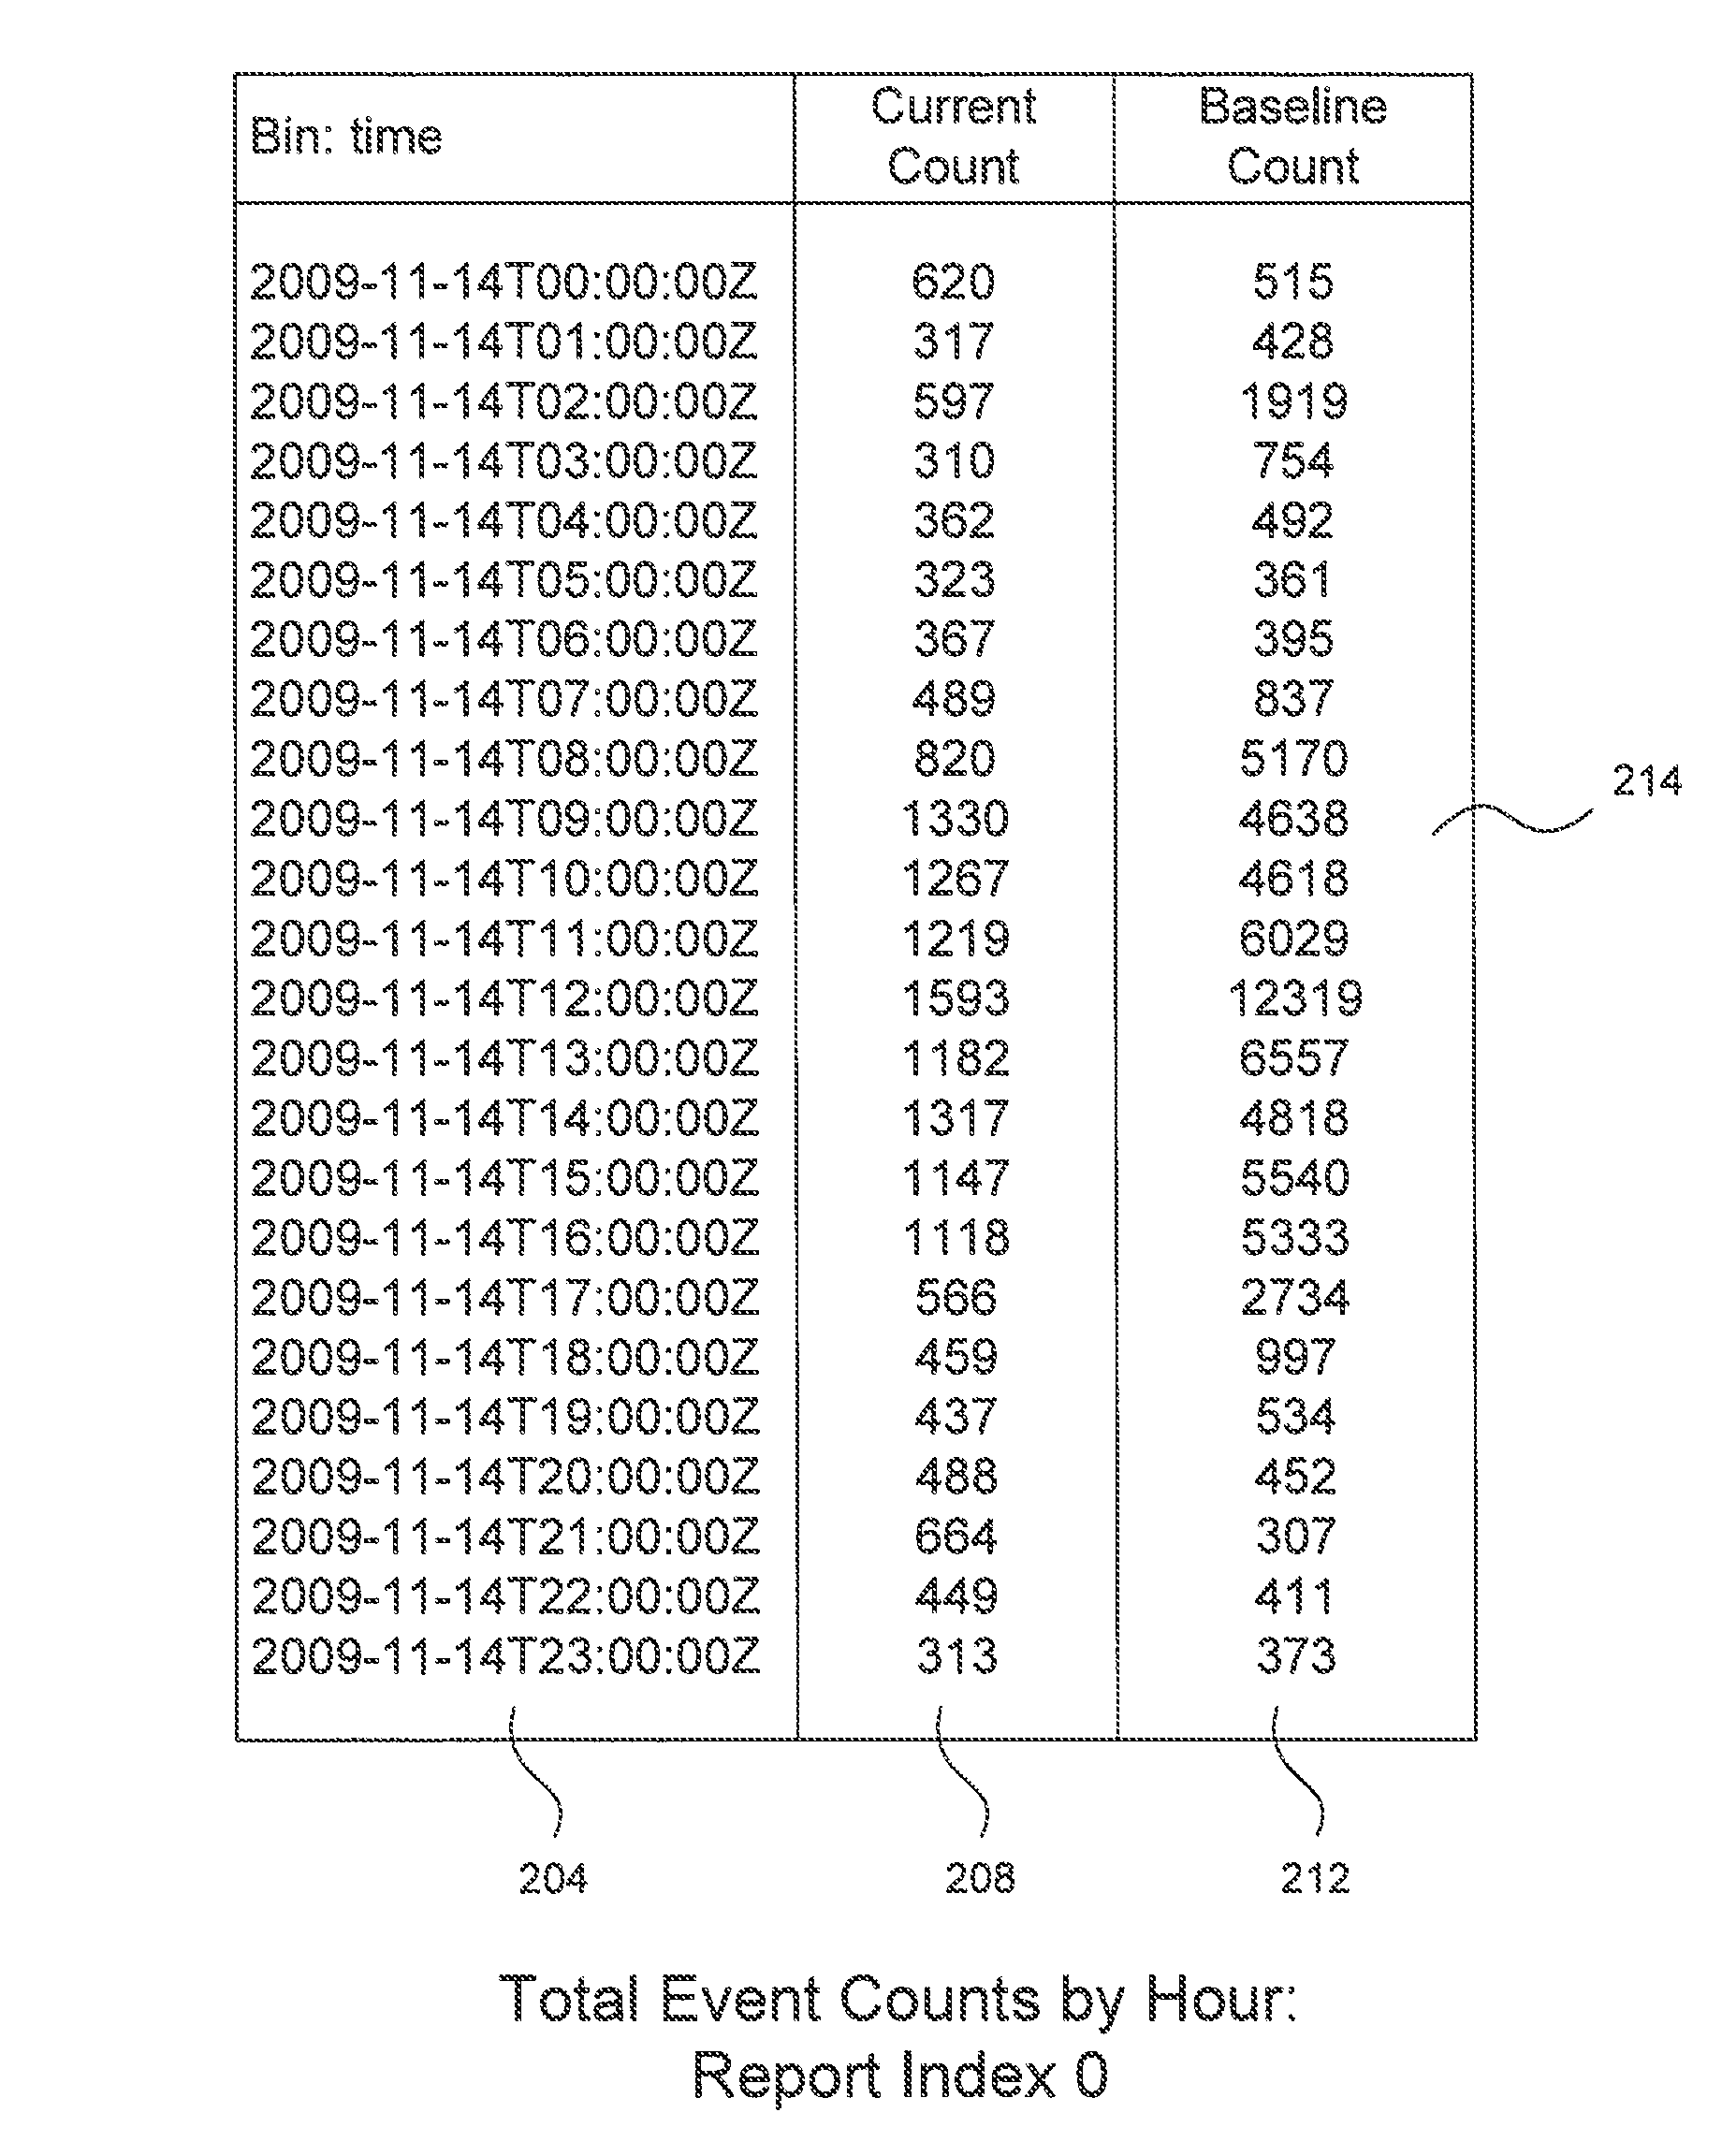
[0021]The present invention uses input report data in the form of distributions or histograms to make conclusions about the importance of a current report. For example, a report may list the number of malware events in a computer network that occur each hour. If this report were to be presented in graphical form, the x-axis of the report is time (the 24 hours in the day) while the y-axis is the number of malware events that occur during one of those hours, thus producing a current report histogram. Historical report data for the number of malware events may be used to form a baseline histogram, but instead of listing malware events for the current day, the y-axis data could be from the mean value of each corresponding weekly-hour within a moving time period such as an eight-week duration, etc. Here, “current” means when the events in the report content were logged; the “historical” is relative to the “current.” Each histogram has a particular shape to its curve and a particular area...


PUM


Abstract

The raw data for a plurality of numerical reports (distributions or histograms) concerning malware infection in a computer network are stored in a data source. The data source is queried to produce any number of reports. Each report's content comes from a distribution of data within a time interval, and a baseline distribution is formed for comparison by the corresponding historical data. The shape change for the distributions is determined by using Kullback-Leibler divergence. The change of volume (i.e., total sample count) for the distributions is determined using the L1 norm ratio. A cutoff threshold is determined for the K-L divergence and the volume ratio threshold is determined for the count change. A measure value for each report is determined by multiplying the shape change by the volume change (modified by raising it to a particular power). The reports are ranked based upon their measure values. A report is determined to be important if its shape change is greater than the cutoff threshold, if it's volume change is greater than the count ratio threshold, or if the measure value is greater than a measure threshold. The invention can be applied to all kinds of reports suitable for a distribution or histogram, and also provides one approach to detect anomalous behaviors.

Description

FIELD OF THE INVENTION[0001]The present invention relates generally to the analysis of large volumes of data. More specifically, the present invention relates to filtering and prioritizing reports based upon content change from a baseline.BACKGROUND OF THE INVENTION[0002]Analyzing a very large volume of data is often critical to resolving a particular problem. “Too many reports to study” is an often heard comment from business analysts who do not have the time to read the many reports available regarding a particular issue. The current state of computer technology, the number of software products, and ease of their use have generally made the generation of a great number of reports relatively easy.[0003]One prior approach that has been used involves correlation of a predefined report set. If a user reads a particular subset of reports together, then these reports may be correlated into the same neighborhood. Therefore, when another user picks out one of these reports for reading, a ...

Claims


Application Information

Patent Timeline
IPC IPC(8): G06F17/30
CPCG06F21/56G06Q10/00
Inventor CHANG, HUNG-JEN
Owner TREND MICRO INC
Why Eureka
Try Eureka