
Image quality defect detection via sensor characterization and halftone dot classification

a technology of image quality and sensor characterization, applied in the field of image quality defect detection via sensor characterization and halftone dot classification, can solve the problems of waste of paper, objectionable streaks for customers, undesirable to insert test patterns into customers' jobs,

Inactive Publication Date: 2013-10-29
XEROX CORP
View PDF12 Cites 6 Cited by
  • Summary
  • Abstract
  • Description
  • Claims
  • Application Information

AI Technical Summary

Benefits of technology

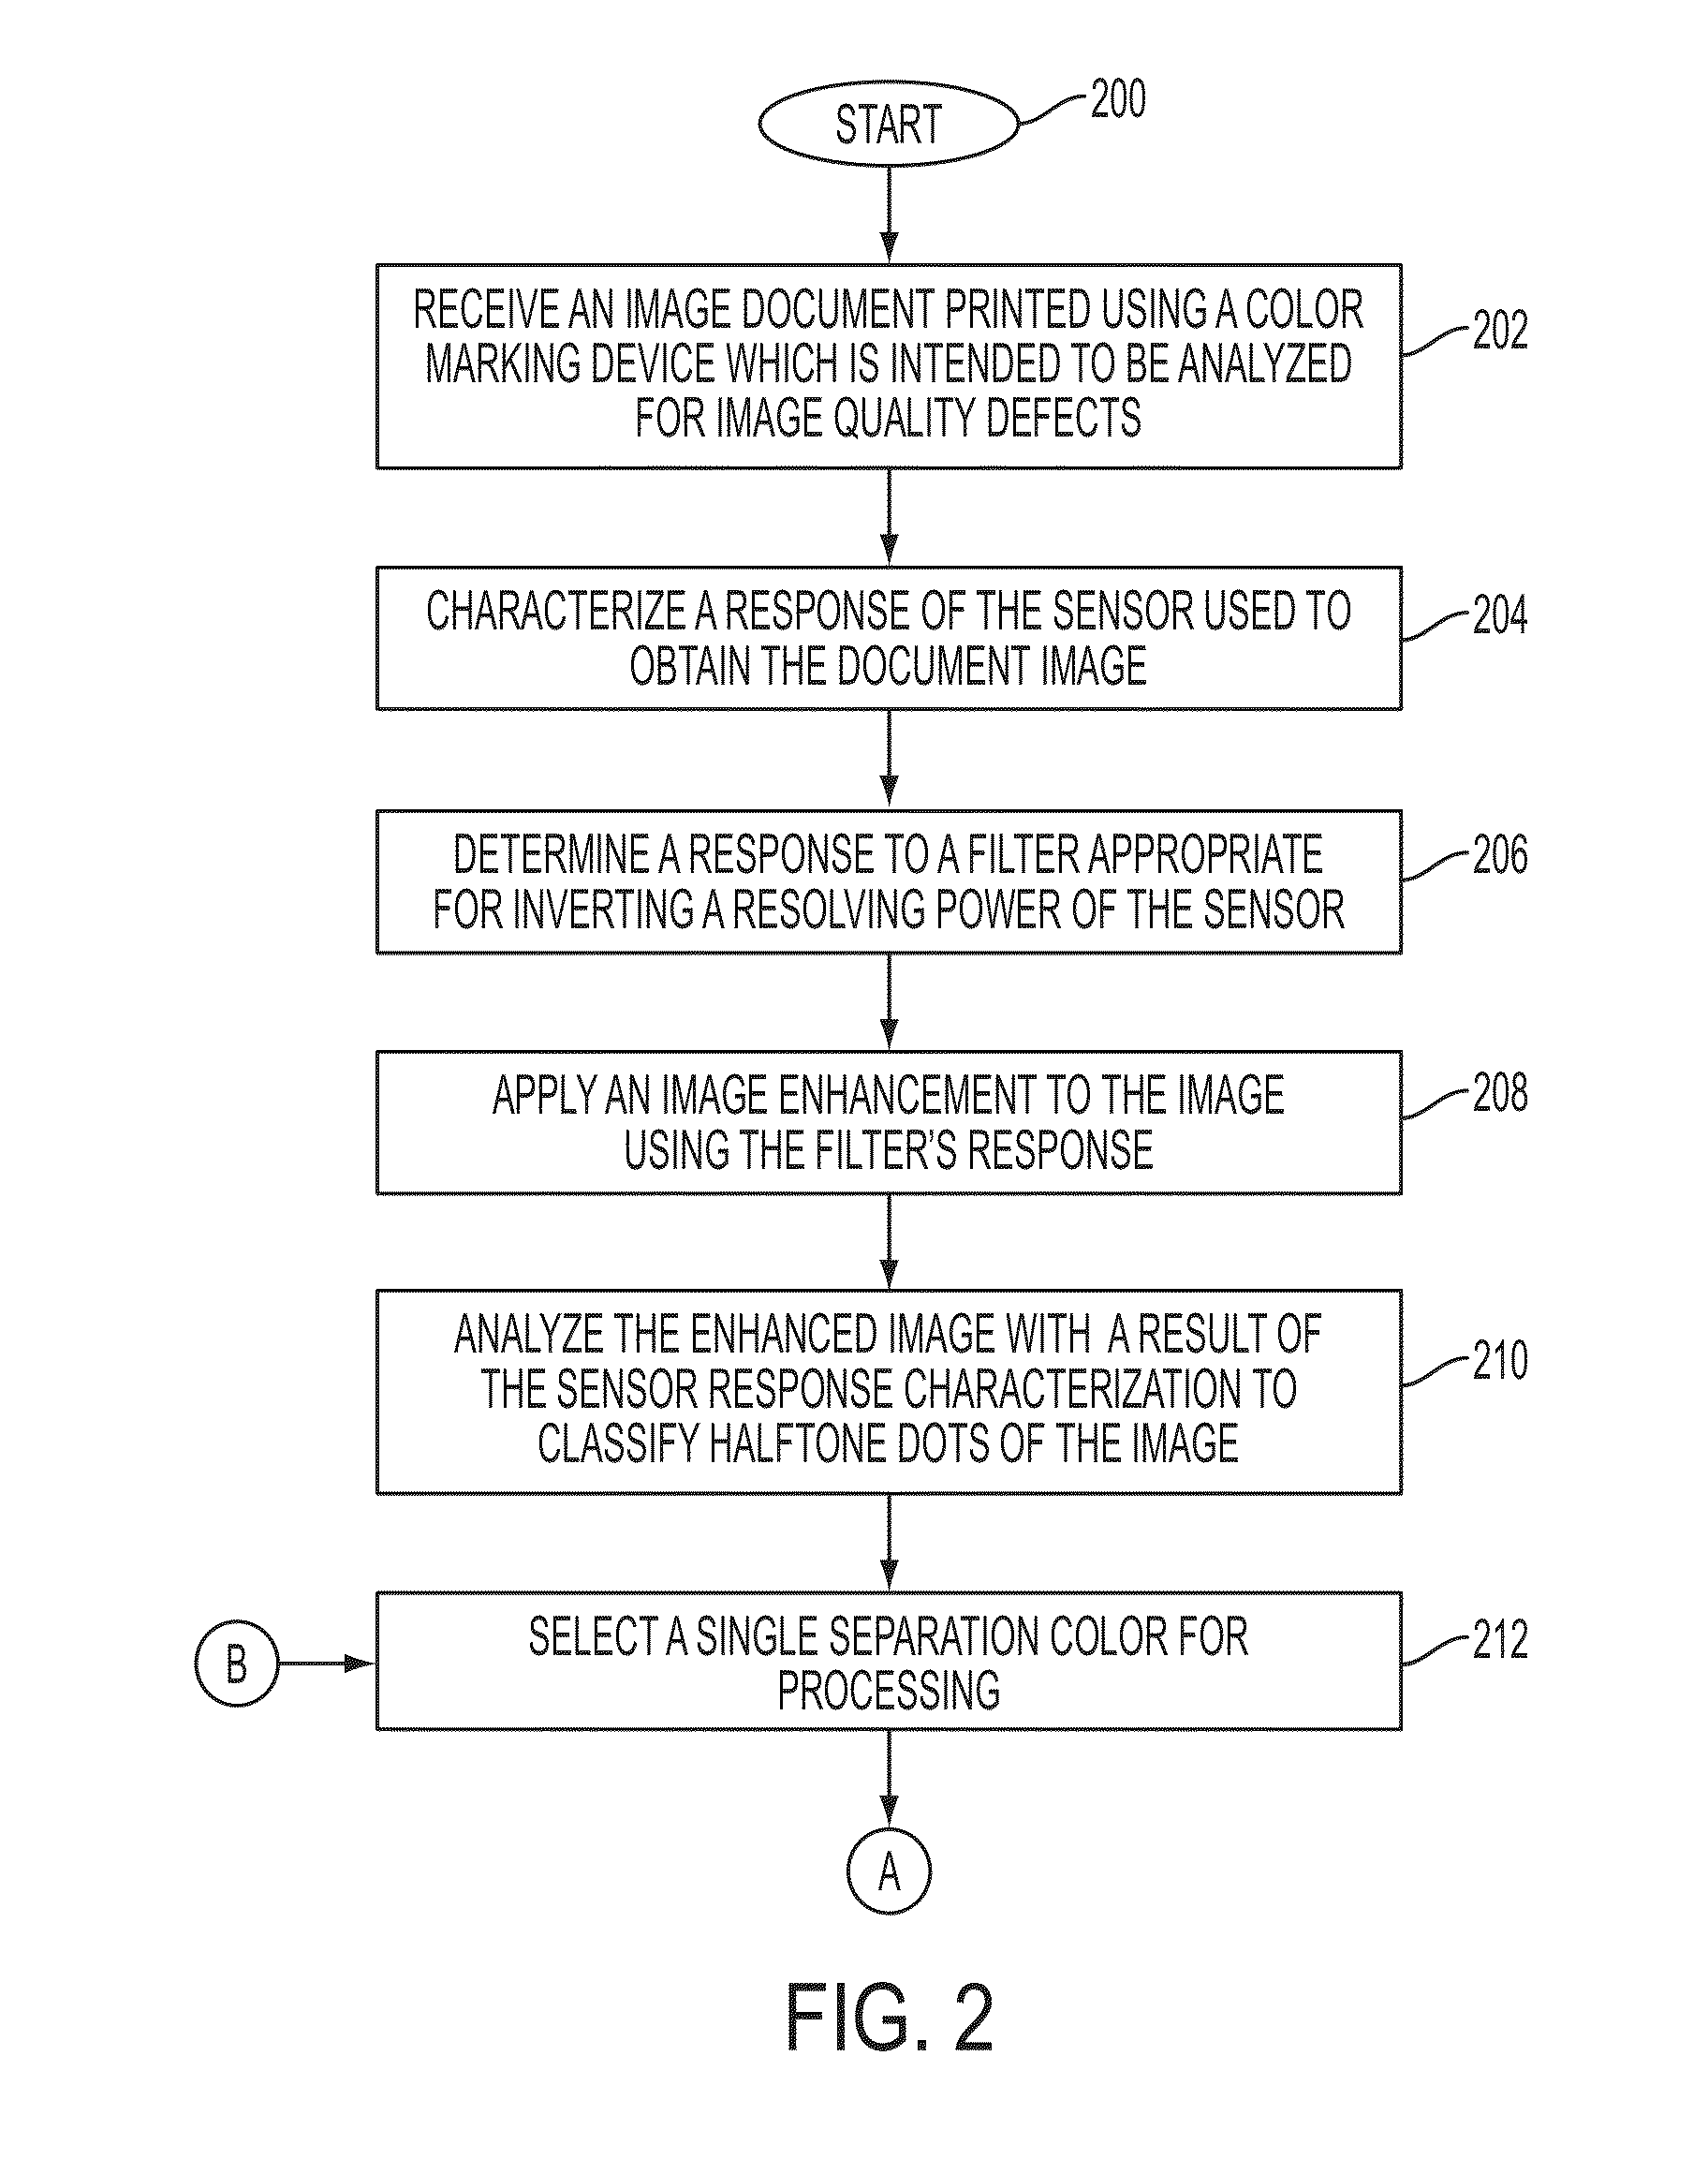
This patent describes a system and method for detecting image quality defects in halftone dot images. The system characterizes the resolution of the sensor and the sensor's response to printed patches, and a de-blurring filter is designed to compensate for the sensor's resolving power deficiencies. Image enhancement is then performed on the image using the filter response. The enhanced image is analyzed with the results of the characterized sensor response to properly classify the halftone dots present on the print. This allows for accurate identification of image quality defects in halftone dot images of single separation colors. The method can be used for partial or missing jet detection and can detect other image quality defects such as banding or mottle.

Problems solved by technology

Such streaks are objectionable to a customer.
However, it is undesirable to insert test patterns into a customer's job.
Not only does this waste paper and reduce productivity, but these pages need to be removed from the job.
This adds cost and complexity to a print job and provides opportunities for mistakes to occur.
This may not be viable for all printing systems.

Method used


Image

  • Image quality defect detection via sensor characterization and halftone dot classification
  • Image quality defect detection via sensor characterization and halftone dot classification
  • Image quality defect detection via sensor characterization and halftone dot classification

Examples


first embodiment

Flow Diagram of a First Embodiment

[0046]As discussed in the background section hereof, there are two primary approaches to image quality defect detection such as WMJ detection, streak detection, banding detection, mottle detection, graininess detection etc. For image quality defect detection, there are methods that do not identify individual halftone dot directly but estimate the average amount of halftone dots (referred to as analysis in macro-view), i.e., approaches that analyze average colors across many pixels for defects. On the other hand, there are methods that attempt to identify individual halftone dots directly (referred to as analysis in micro-view), i.e., approaches that attempt to identify at the pixel level the color of the halftone dot and then determine the presence of image defects. There are advantages and disadvantages in both approaches. Using WMJ detection as an example, for the macro-view approach, the process direction resolution can be very low (e.g., 5 dpi)....

second embodiment

Flow Diagram of a Second Embodiment

[0065]In this embodiment, instead of manipulating pixel values of the scans via filtering as in the above-described embodiment and then applying a two-stage halftone classification approach where these values are first compared to a spatially-invariant RGB→CMYK LUT and then optionally a subset of pixels are compared to a spatially varying RGB→CMYK LUT, a spatially varying RGB→CMYK LUT is created which is tailored for each pixel based on the pixel values of surrounding pixels. Then, each pixel at location (i,j) is classified to one of the 16 halftone dots based on a closest Euclidean distance to the modified centroids of the 16 primaries of the characterized sensor response. Here, the modification is based on the weighted average of values of pixels in a neighborhood of pixels surrounding center pixel (i,j) (pixel (i,j) is excluded) and the original spatially-invariant centroids of the 16 primaries (Table of FIG. 7).

[0066]Reference is now being made...

example functional

Block Diagram

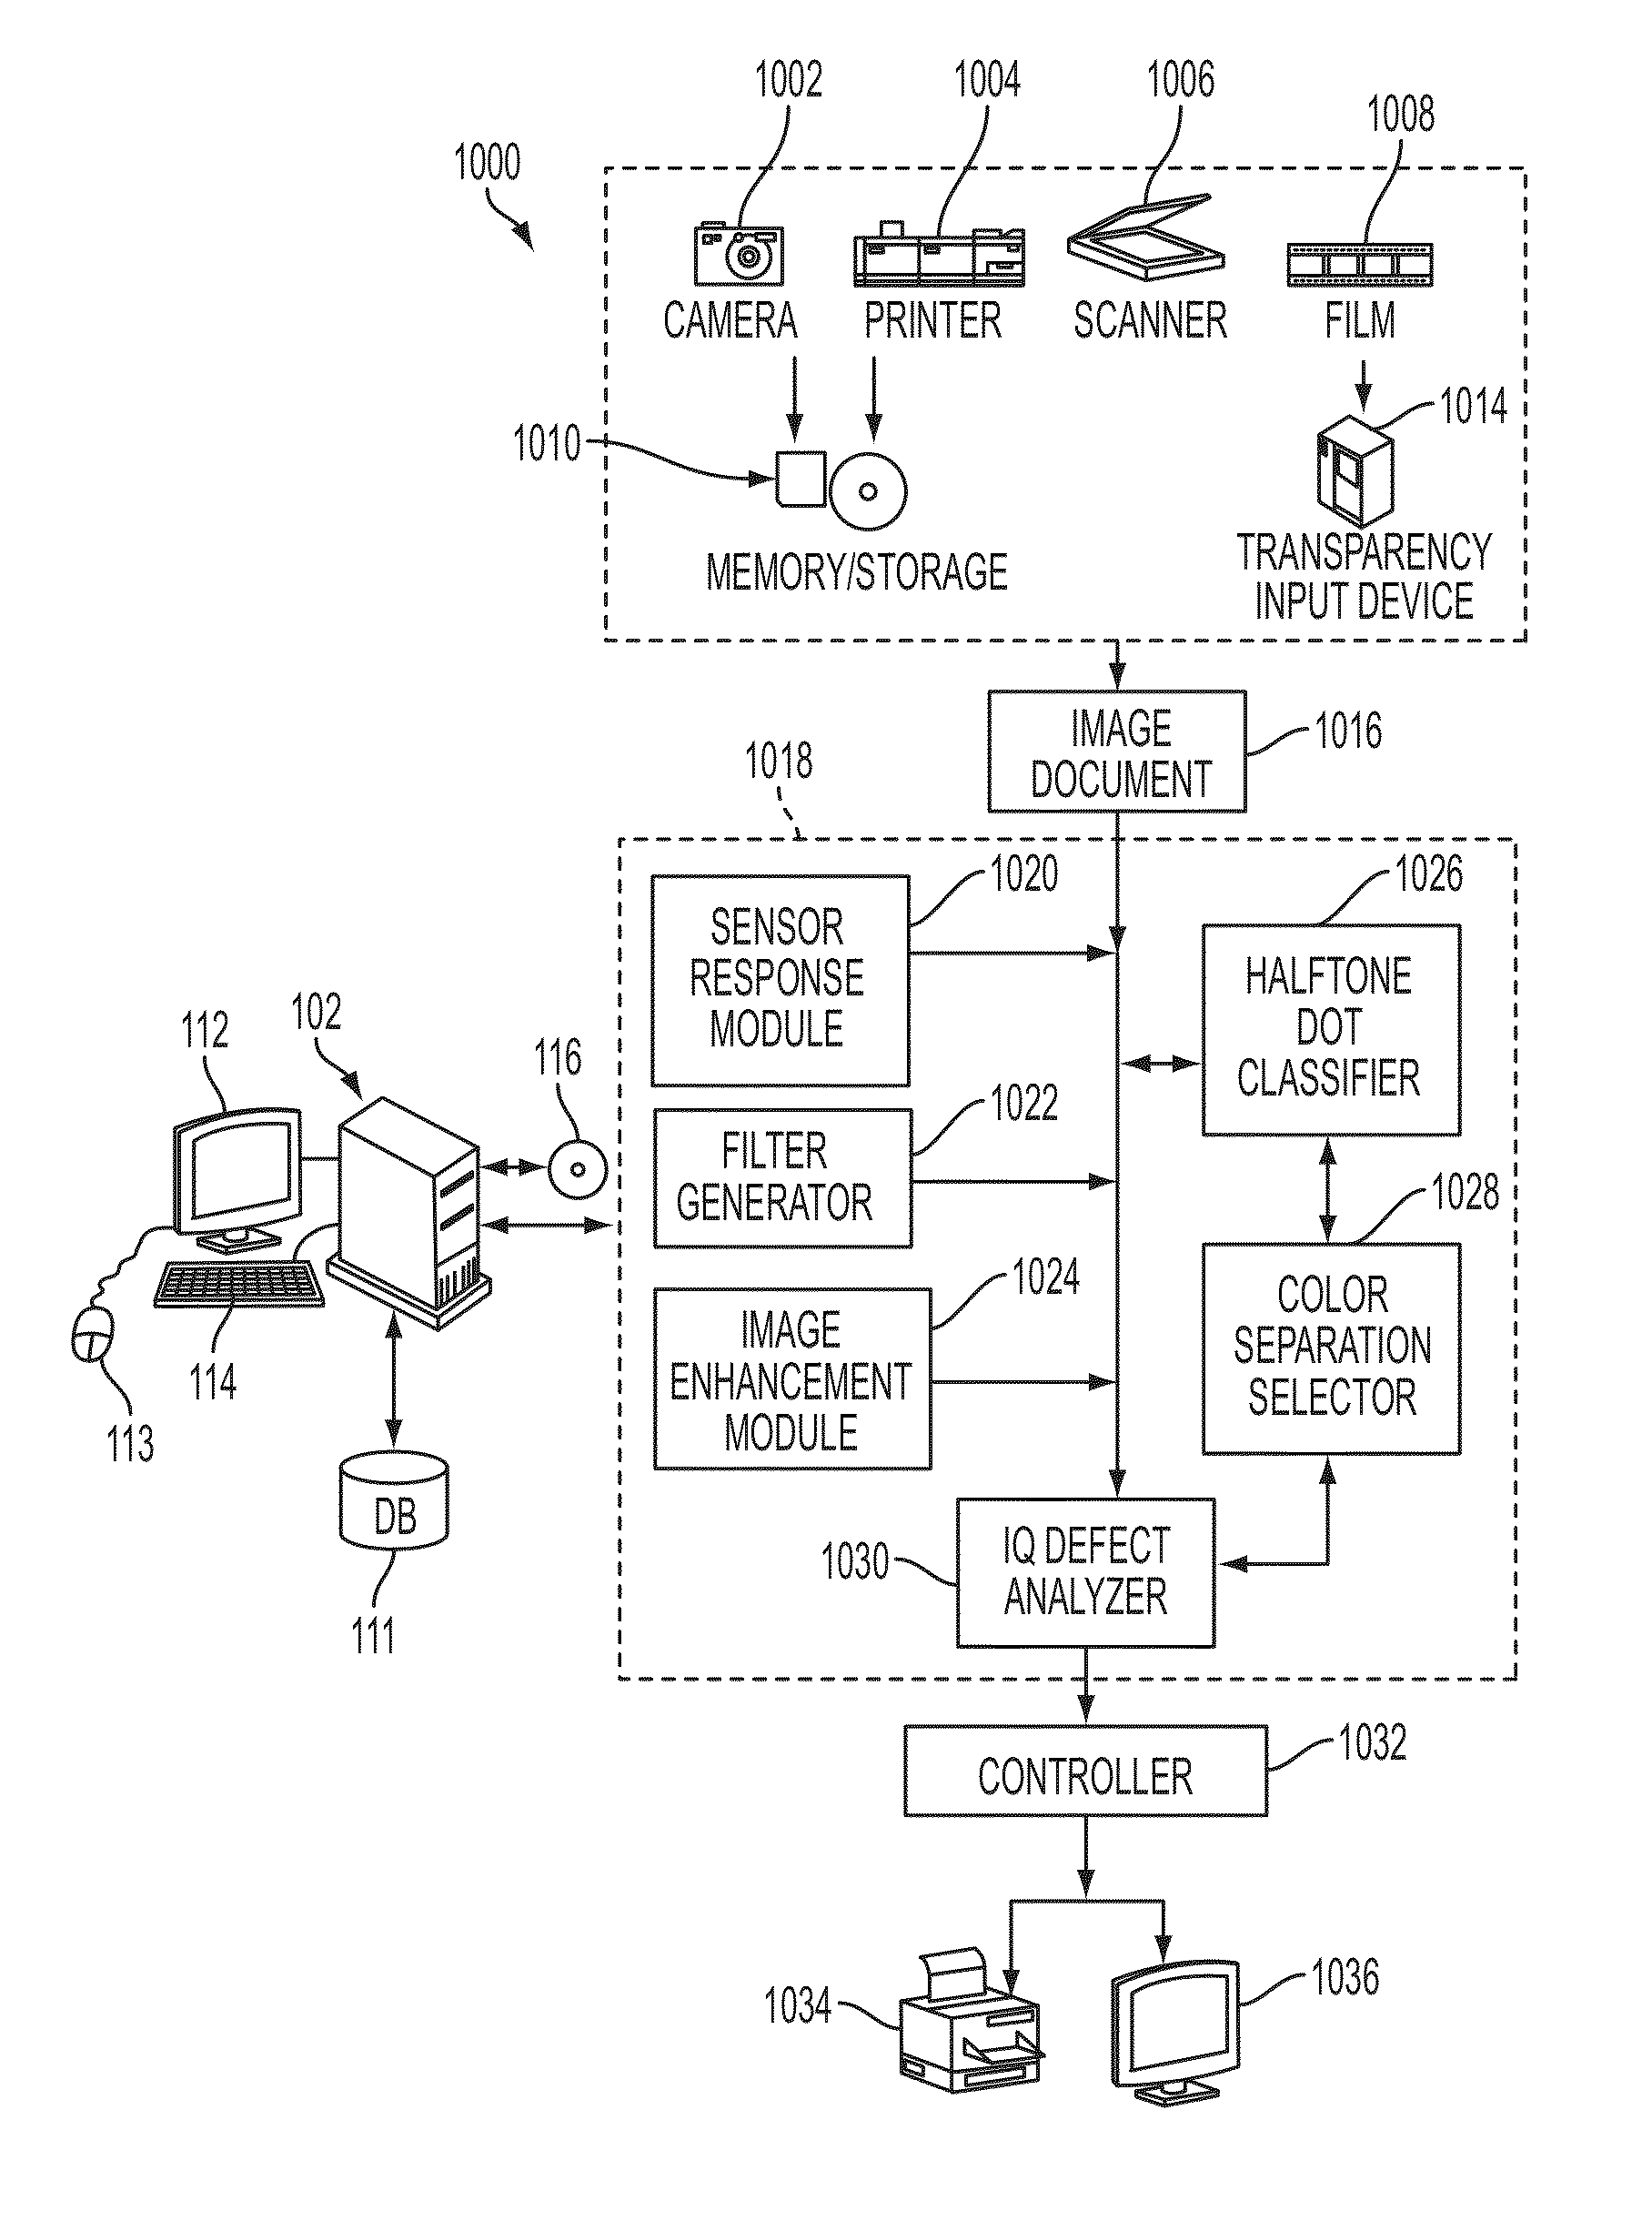
[0074]Reference is now being made to FIG. 10 which illustrates a functional block diagram of one embodiment of an example image quality processing system wherein various aspects of the present method for image quality defect analysis via halftone dot classification can be performed. The system illustrates a plurality of image input devices, at 1000, each capable of capturing the document image (110 of FIG. 1) and providing an image document 1016 to image quality processing module 1018 shown residing as any of a hardware or software embodiment within computer system 102.

[0075]In FIG. 10, an image of a customer document is captured using any of a variety of input devices such as, for instance, a digital camera 1002 or using a copying function of print system 1004. A document image may be captured using document scanning device 1006. The customer's document may reside on a color film 1008 and captured via transparency input device 1014. The document image may be retrieved ...


PUM


Abstract

What is disclosed is a system and method for image quality (IQ) defect detection via classification of halftone dots present on customer prints. In one embodiment, spatially-varying thresholds are applied on the sensed image in order to classify the halftone dots for IQ defect detection. The resolving power of the sensor is characterized and the sensor responses to patches printed with the print device are characterized. A de-blurring filter is designed which is appropriate for compensating the characterized resolving power of the sensor. Image enhancement is applied to the image using the de-blurring filter. Halftone dots present on the prints are classified by analyzing the enhanced image with the results of the sensor response characterization. Once classified, single separation halftone dot images can be more readily analyzed for defects. The present method allows sensor resolution as low as the size of the halftone dots of the printer under test.

Description

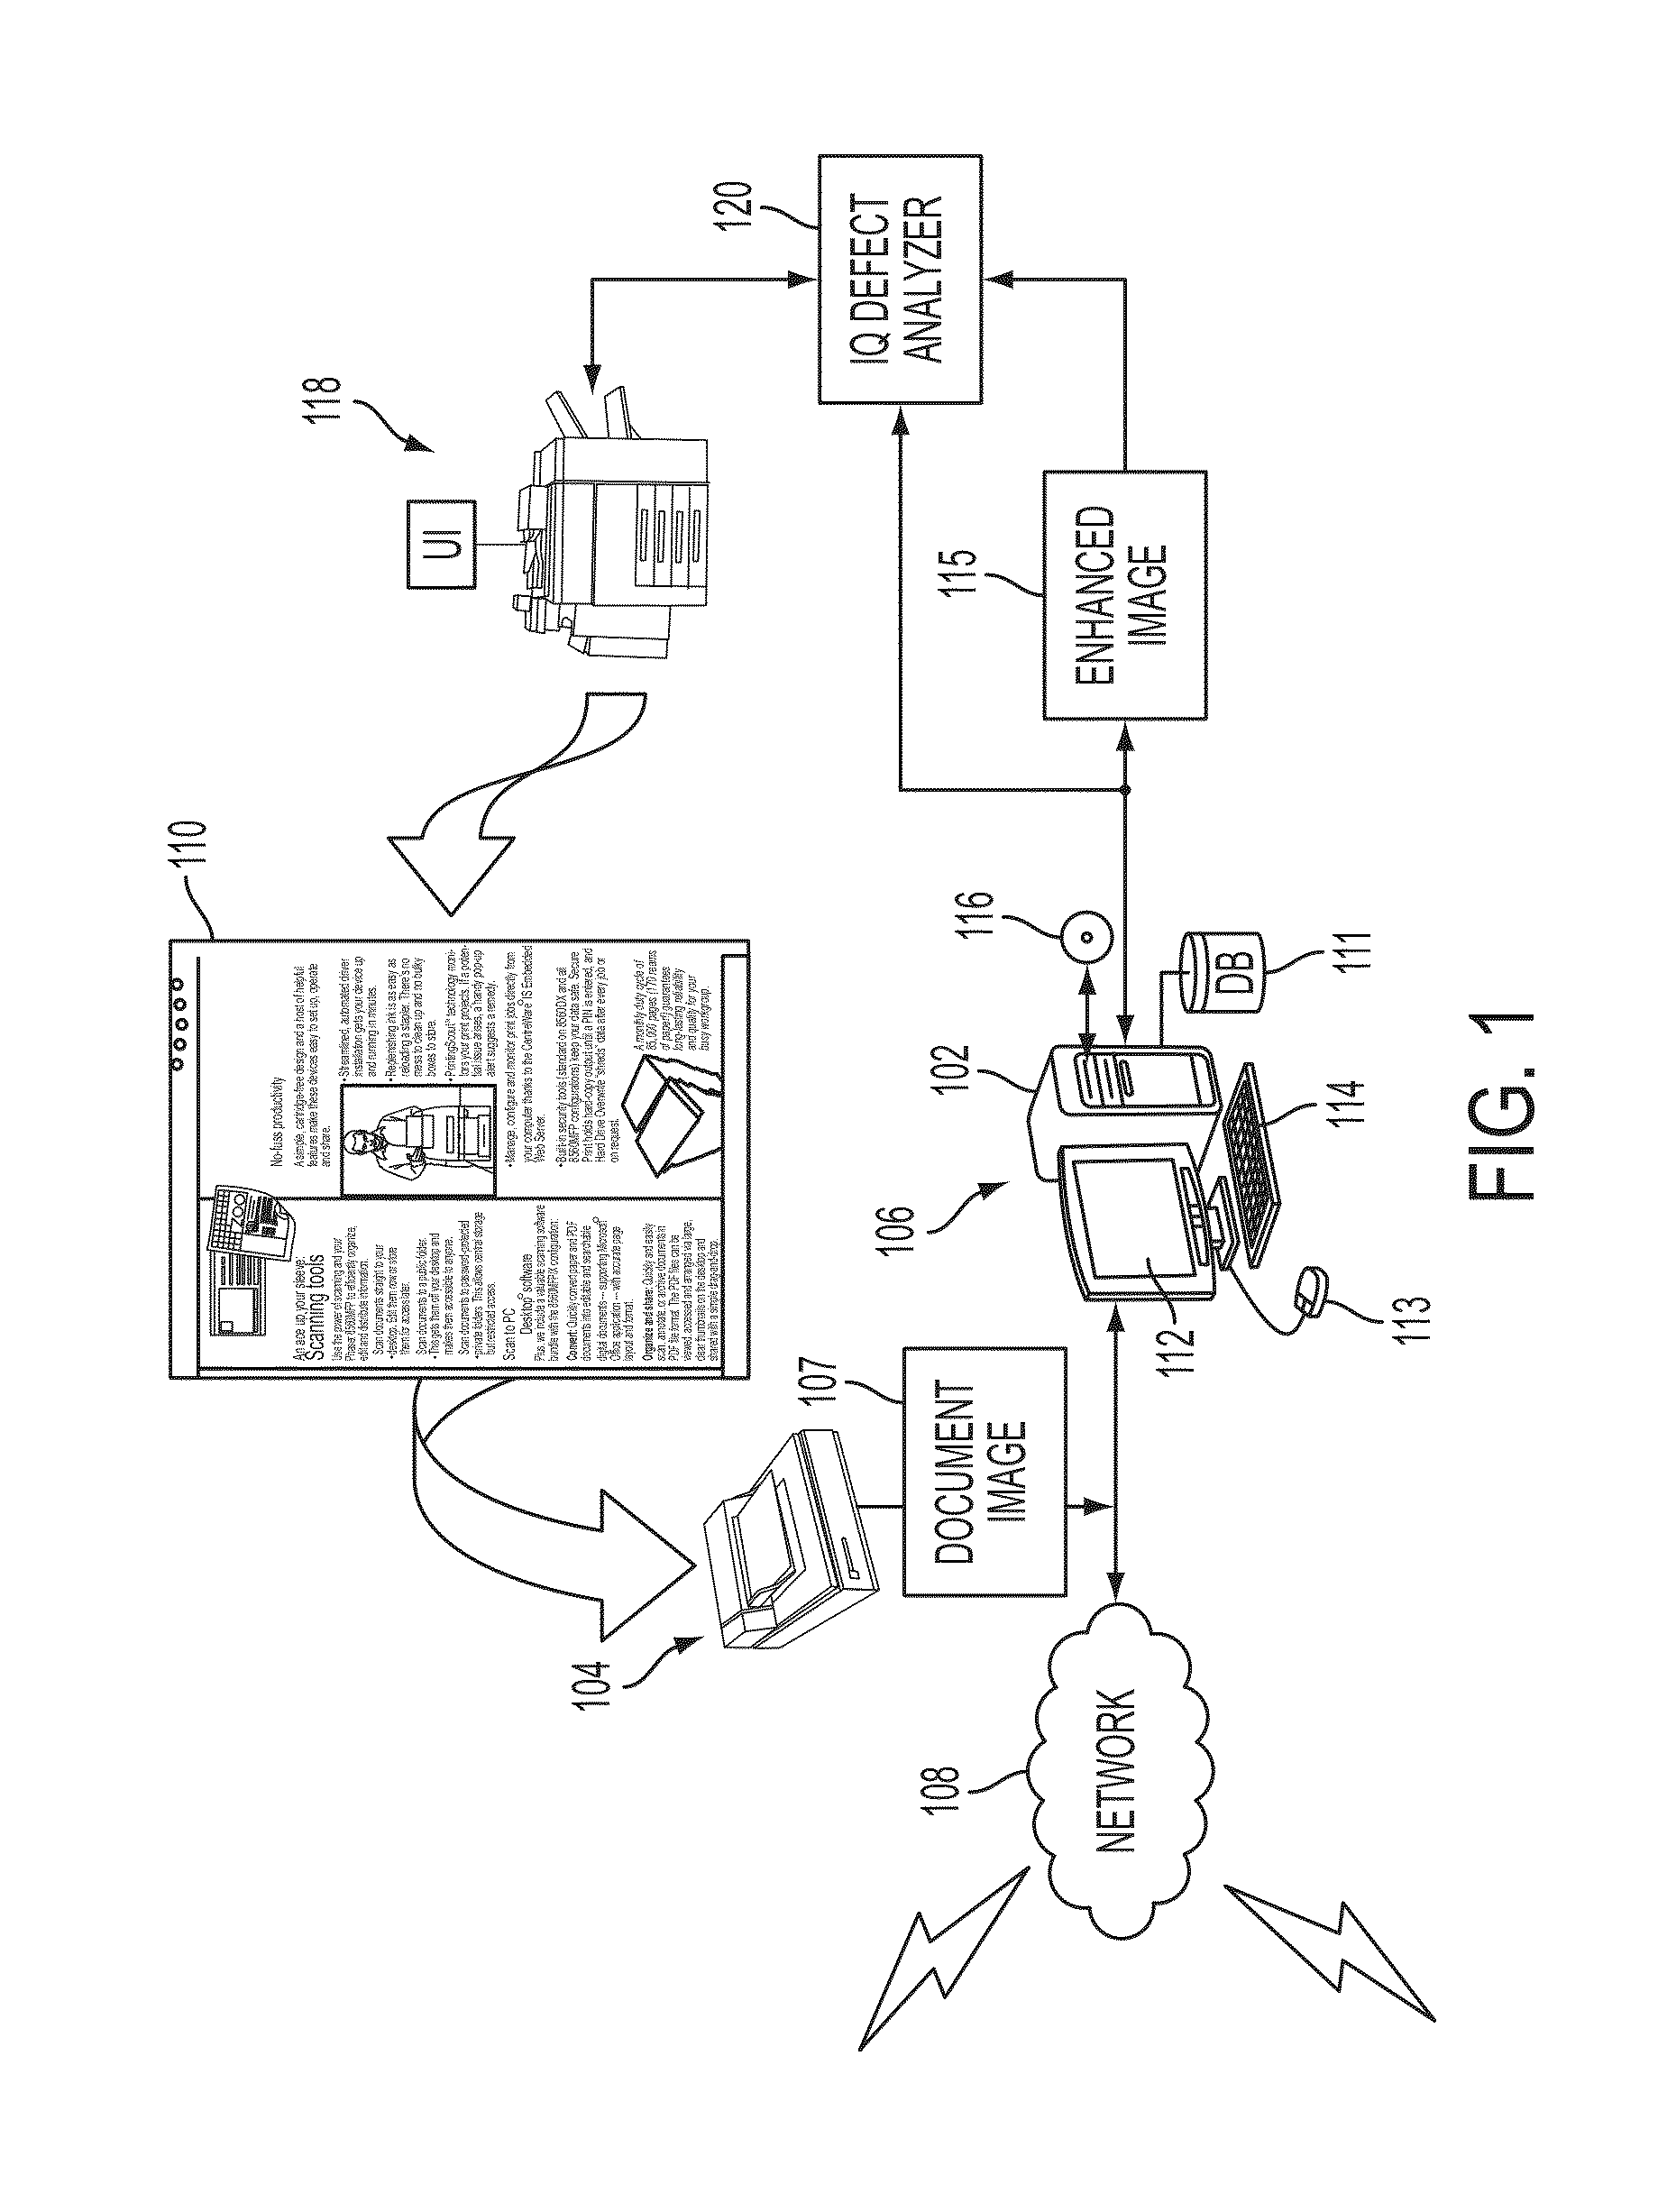
TECHNICAL FIELD[0001]The present invention is directed to systems and methods which compensate for the resolving power deficiency of a sensor in order to classify halftone dots present on a customer's print for image quality defect detection.BACKGROUND[0002]To meet customer demand, the ability to detect and identify image quality defects such as weak or missing jets during a print run is critical for some printers. Missing jets produce thin sharp streaks which are visible. Such streaks are objectionable to a customer. Countermeasures can be applied in the print engine to correct or mitigate the effects of missing jets. In order to apply these countermeasures, it is often necessary to reliably know the location and color separation identity of the missing jets. Missing jets can appear at any time, so it is necessary to look for them rather frequently. It is relatively straight-forward to detect and identify image quality (IQ) defects such as weak or missing jets (WMJ) with the use of...

Claims


Application Information

Patent Timeline
Patent Type & Authority Patents(United States)
IPC IPC(8): G06K9/00
CPCH04N1/405H04N1/52
Inventor WU, WENCHENGXU, BEILEIDALAL, EDUL N.
Owner XEROX CORP
Learn More