Event data visualization tool

a technology of event data and visualization tools, applied in the field of event data visualization tools, can solve the problems of impracticality for large networks, impracticality for a whole internet depiction, and difficulty for users to obtain the “big picture”

Active Publication Date: 2014-08-12
FLORIDA INST FOR HUMAN & MACHINE COGNITION
View PDF5 Cites 13 Cited by
  • Summary
  • Abstract
  • Description
  • Claims
  • Application Information

AI Technical Summary

Problems solved by technology

However, the volume of data existing at any point in time can be overwhelming.
Conventional techniques for displaying such data make it very difficult for a user to obtain the “big picture.”
They are impractical for large networks, however, and certainly impractical for a depiction of the Internet as a whole.
Even with large or multiple screens, clutter from overlapping connection lines in larger networks often becomes unreadable.
This capability exists despite the inability to rationally define the steps in a pattern or process.

Method used


Image

  • Event data visualization tool
  • Event data visualization tool
  • Event data visualization tool

Examples


Embodiment Construction

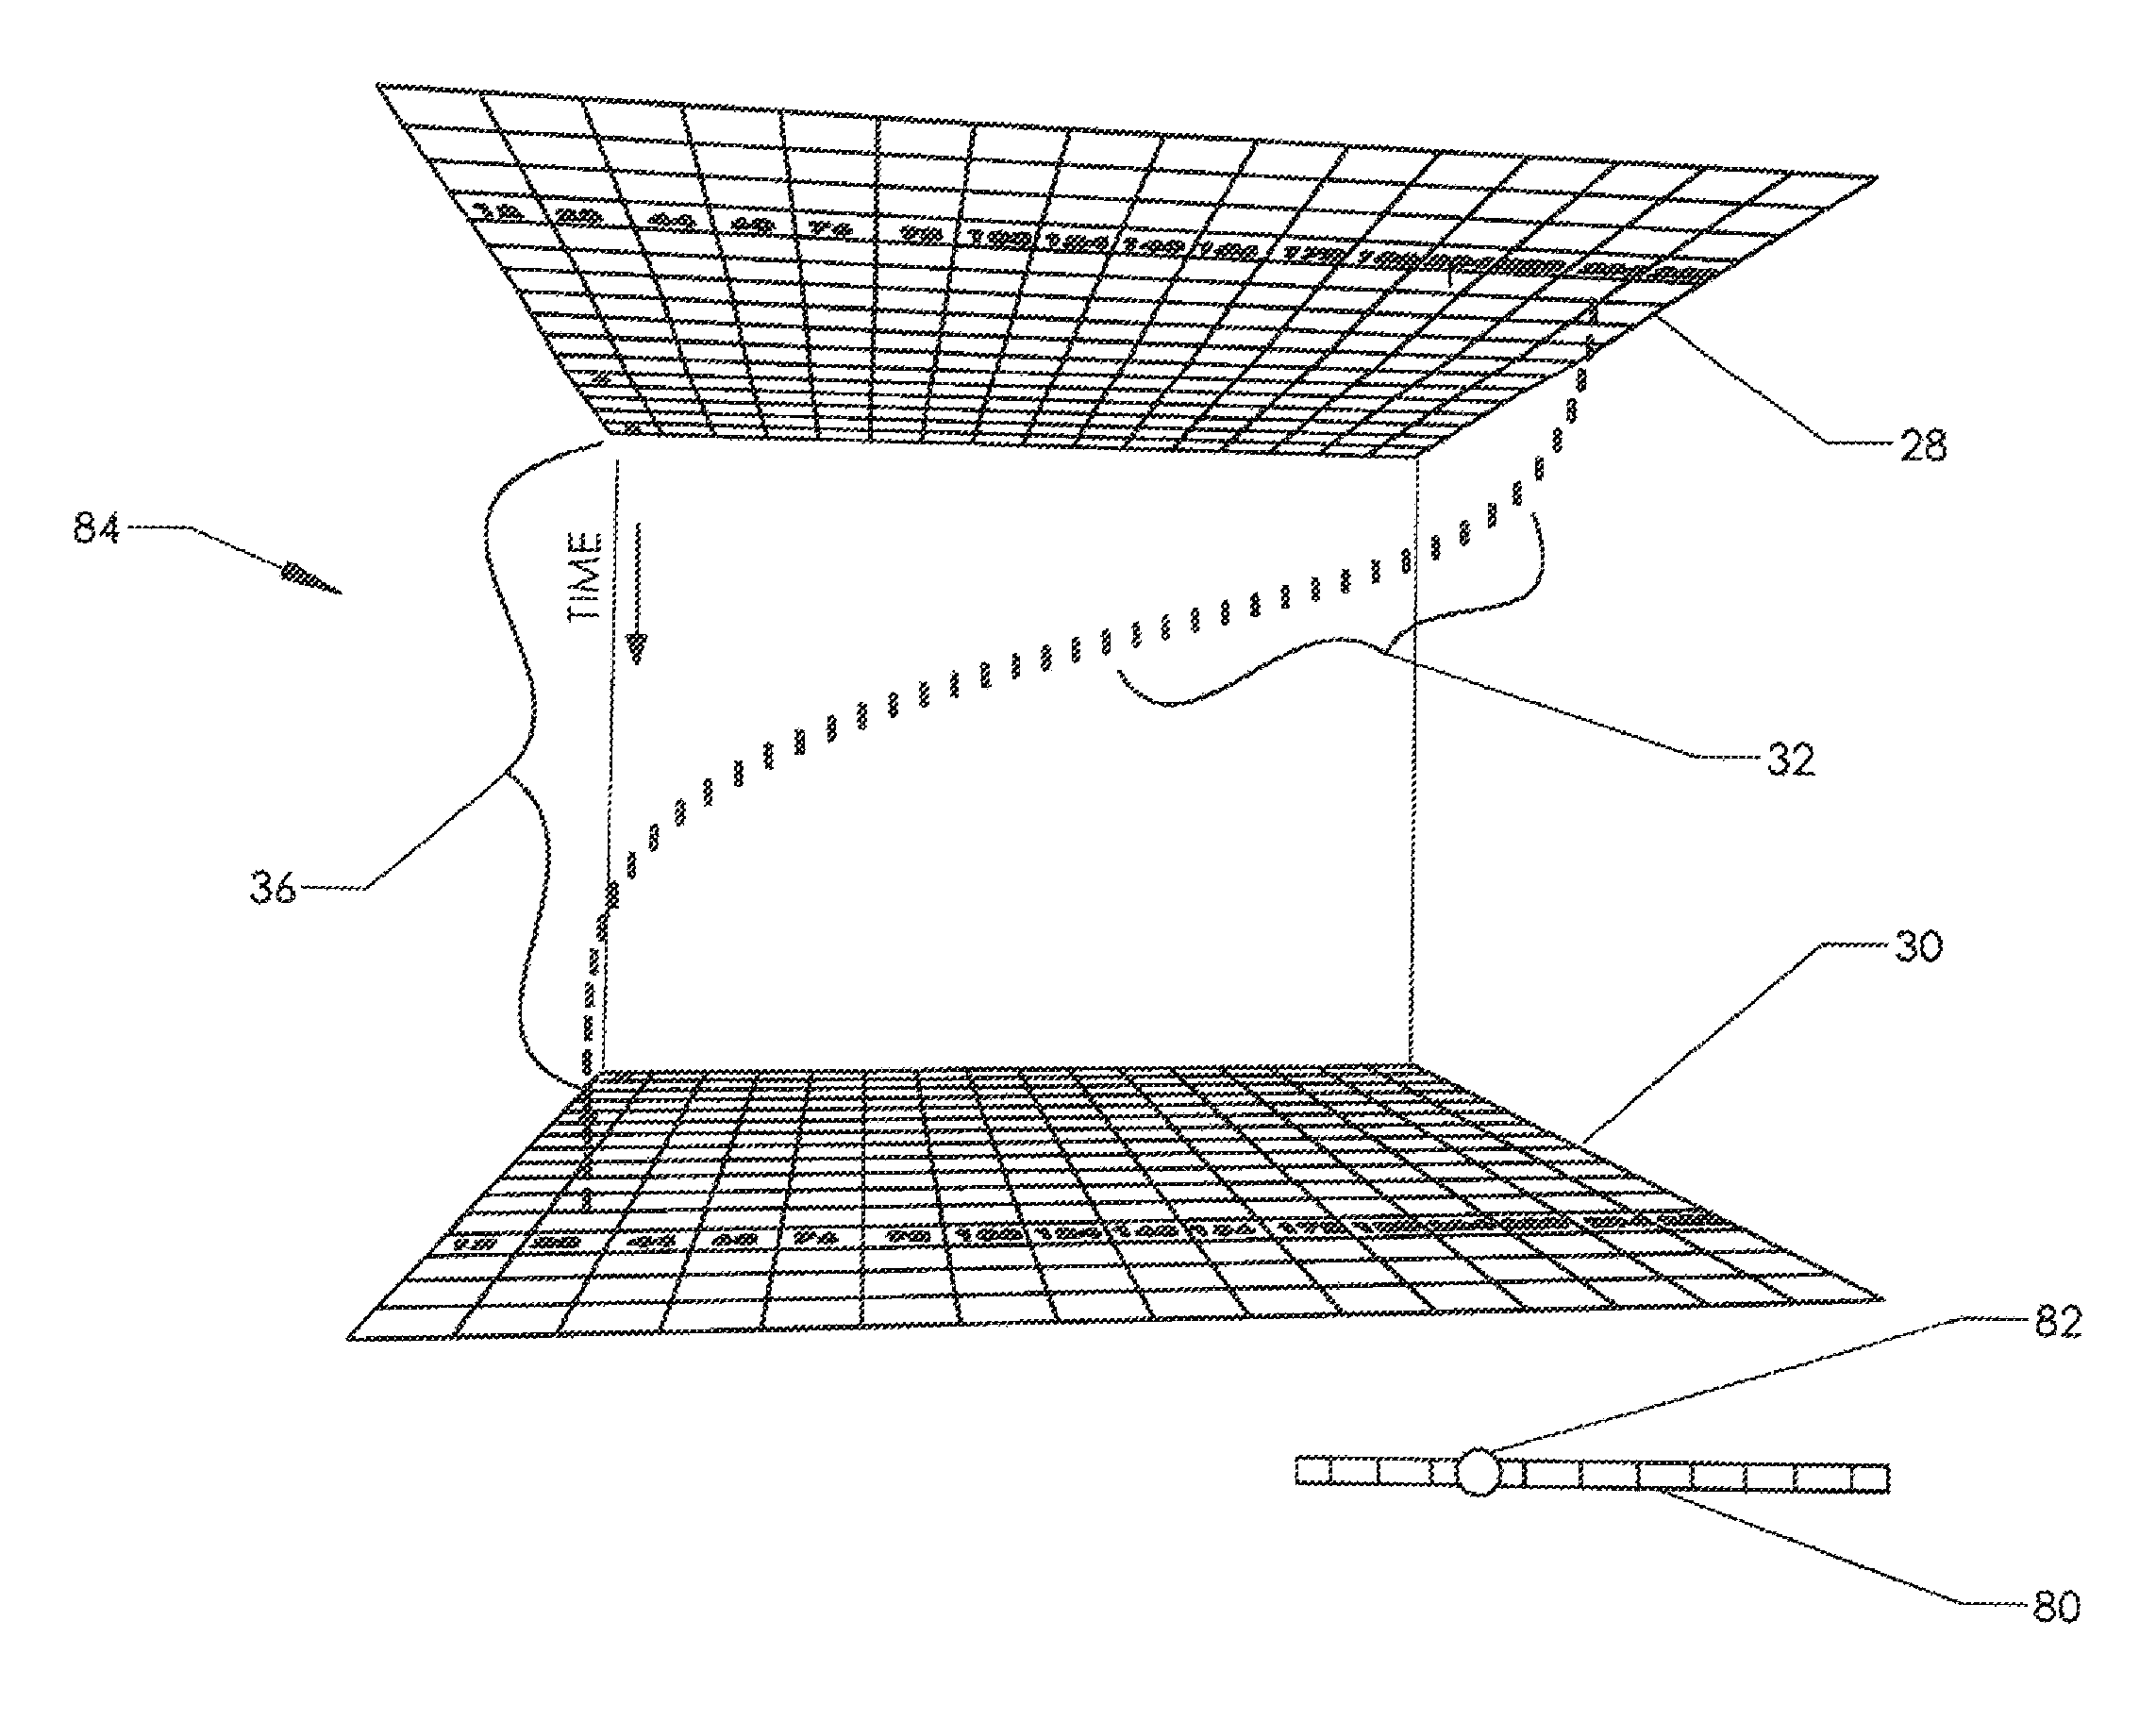
[0069]The present invention is a visualization tool that functions best when human operators work in conjunction with software agents. The human mind has the innate ability to quickly assimilate a large number of visual primitives in order to discern a pattern. The invention exploits several human traits. First, it uses the human ambient vision system—the same system that allows people to quickly and successfully navigate crowded hallways without conscious thought. Second, the invention exploits the human visual ability to perceive changes using movement to convey complex, correlated information.

[0070]Of course, even people who use advanced visualization systems can be overwhelmed by too much data. The primary purpose of the software agents is to collect, aggregate, correlate, and analyze data that is likely to be significant to the human operator and bring it to the operator's attention. The interaction of the software agents and the human operator allow the operator to perceive an...


PUM


Abstract

A method for visually depicting complex events. Software agents are preferably employed to assist the human operator by collecting, enriching, selecting, aggregating, and analyzing data so that patterns of interest can be visually flagged or otherwise emphasized in the visual display. Events are depicted as an “event flow” from a source surface to a destination surface. Intervening surfaces may also be defined. The point of origin on the source surface reveals some information about the event flow, as does the point of impact on the destination surface. The event flow may be mapped to one or more intervening surfaces in order to visually depict other characteristics of the event. The entire depiction is rendered in a simulated three-dimensional view. The user is preferably given the ability to pan, zoom, and reorient the vantage point from which the user “views” the depiction on the computer display.

Description

STATEMENT REGARDING FEDERALLY SPONSORED RESEARCH OR DEVELOPMENT[0001]This work has been sponsored by U.S. Department of Defense Contract #H98230-09-C-0357.CROSS-REFERENCES TO RELATED APPLICATIONS[0002]Not Applicable.MICROFICHE APPENDIX[0003]Not ApplicableBACKGROUND OF THE INVENTION[0004]1. Field of the Invention[0005]This invention relates to the field of visualization tools. More specifically, the invention comprises a method for visually depicting events in a way that allows one or more users operating in conjunction with software agents to quickly discern significant patterns from a much larger amount of information, and for these users to interact with software agents and the visual depiction in order to further refine the visual depiction.[0006]2. Description of the Related Art[0007]The present invention is useful in visually depicting a large number of events in a way that allows a user or users to intuitively focus on a subset of those events which is of interest. The inventi...

Claims


Application Information

Patent Timeline
Patent Type & Authority Patents(United States)
IPC IPC(8): G06T11/20
CPCG06T11/206
Inventor BRADSHAW, JEFFREY M.BUNCH, LAWRENCE K.CARVALHO, MARCO M.ESKRIDGE, THOMAS C.FELTOVICH, PAUL J.JOHNSON, MATTHEW
Owner FLORIDA INST FOR HUMAN & MACHINE COGNITION
Why Eureka
Try Eureka