
System for monitoring and diagnosis of cardiac electrogram signals using multi-dimensional analysis

a multi-dimensional analysis and electrogram signal technology, applied in the field of multi-dimensional analysis systems for monitoring and diagnosis of cardiac electrogram signals, can solve the problems of serious health problems, single-dimensional continuous ecg waveform, subjective time-consuming analysis of continuous waveform morphology and time domain parameter analysis, etc., to facilitate visual comparison

Active Publication Date: 2014-09-02
PIXART IMAGING INC
View PDF30 Cites 20 Cited by
  • Summary
  • Abstract
  • Description
  • Claims
  • Application Information

AI Technical Summary

Benefits of technology

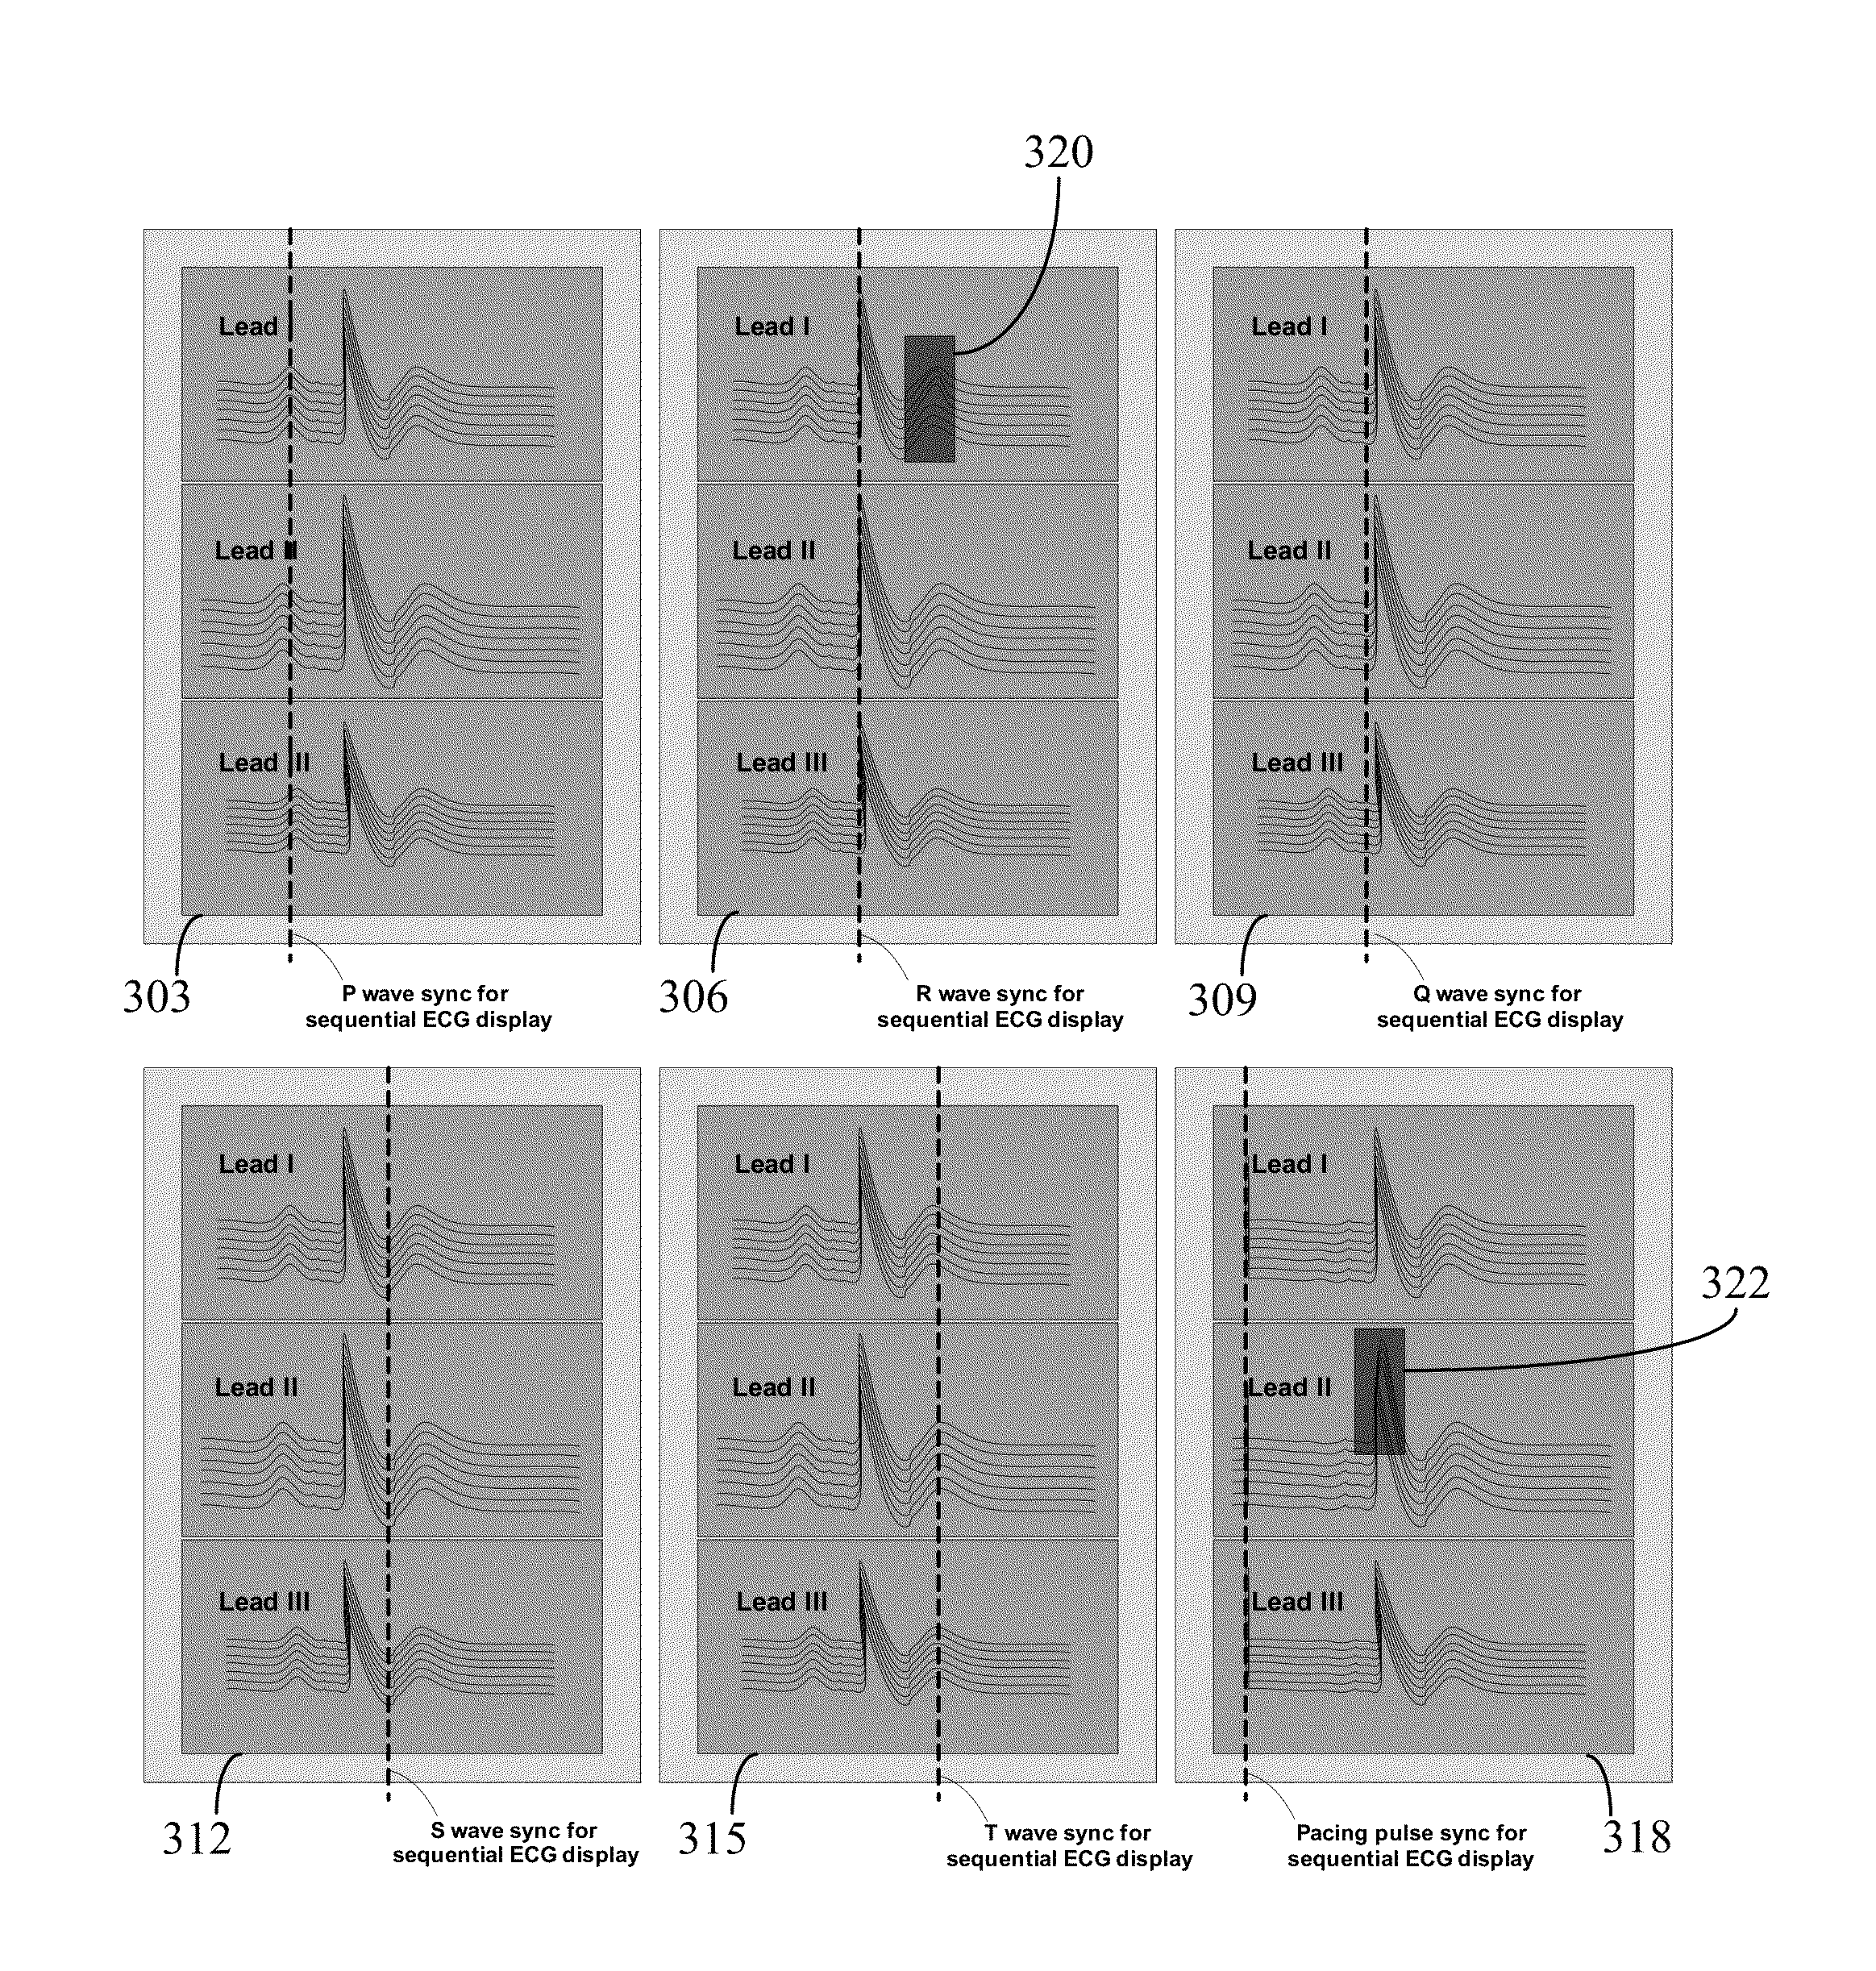
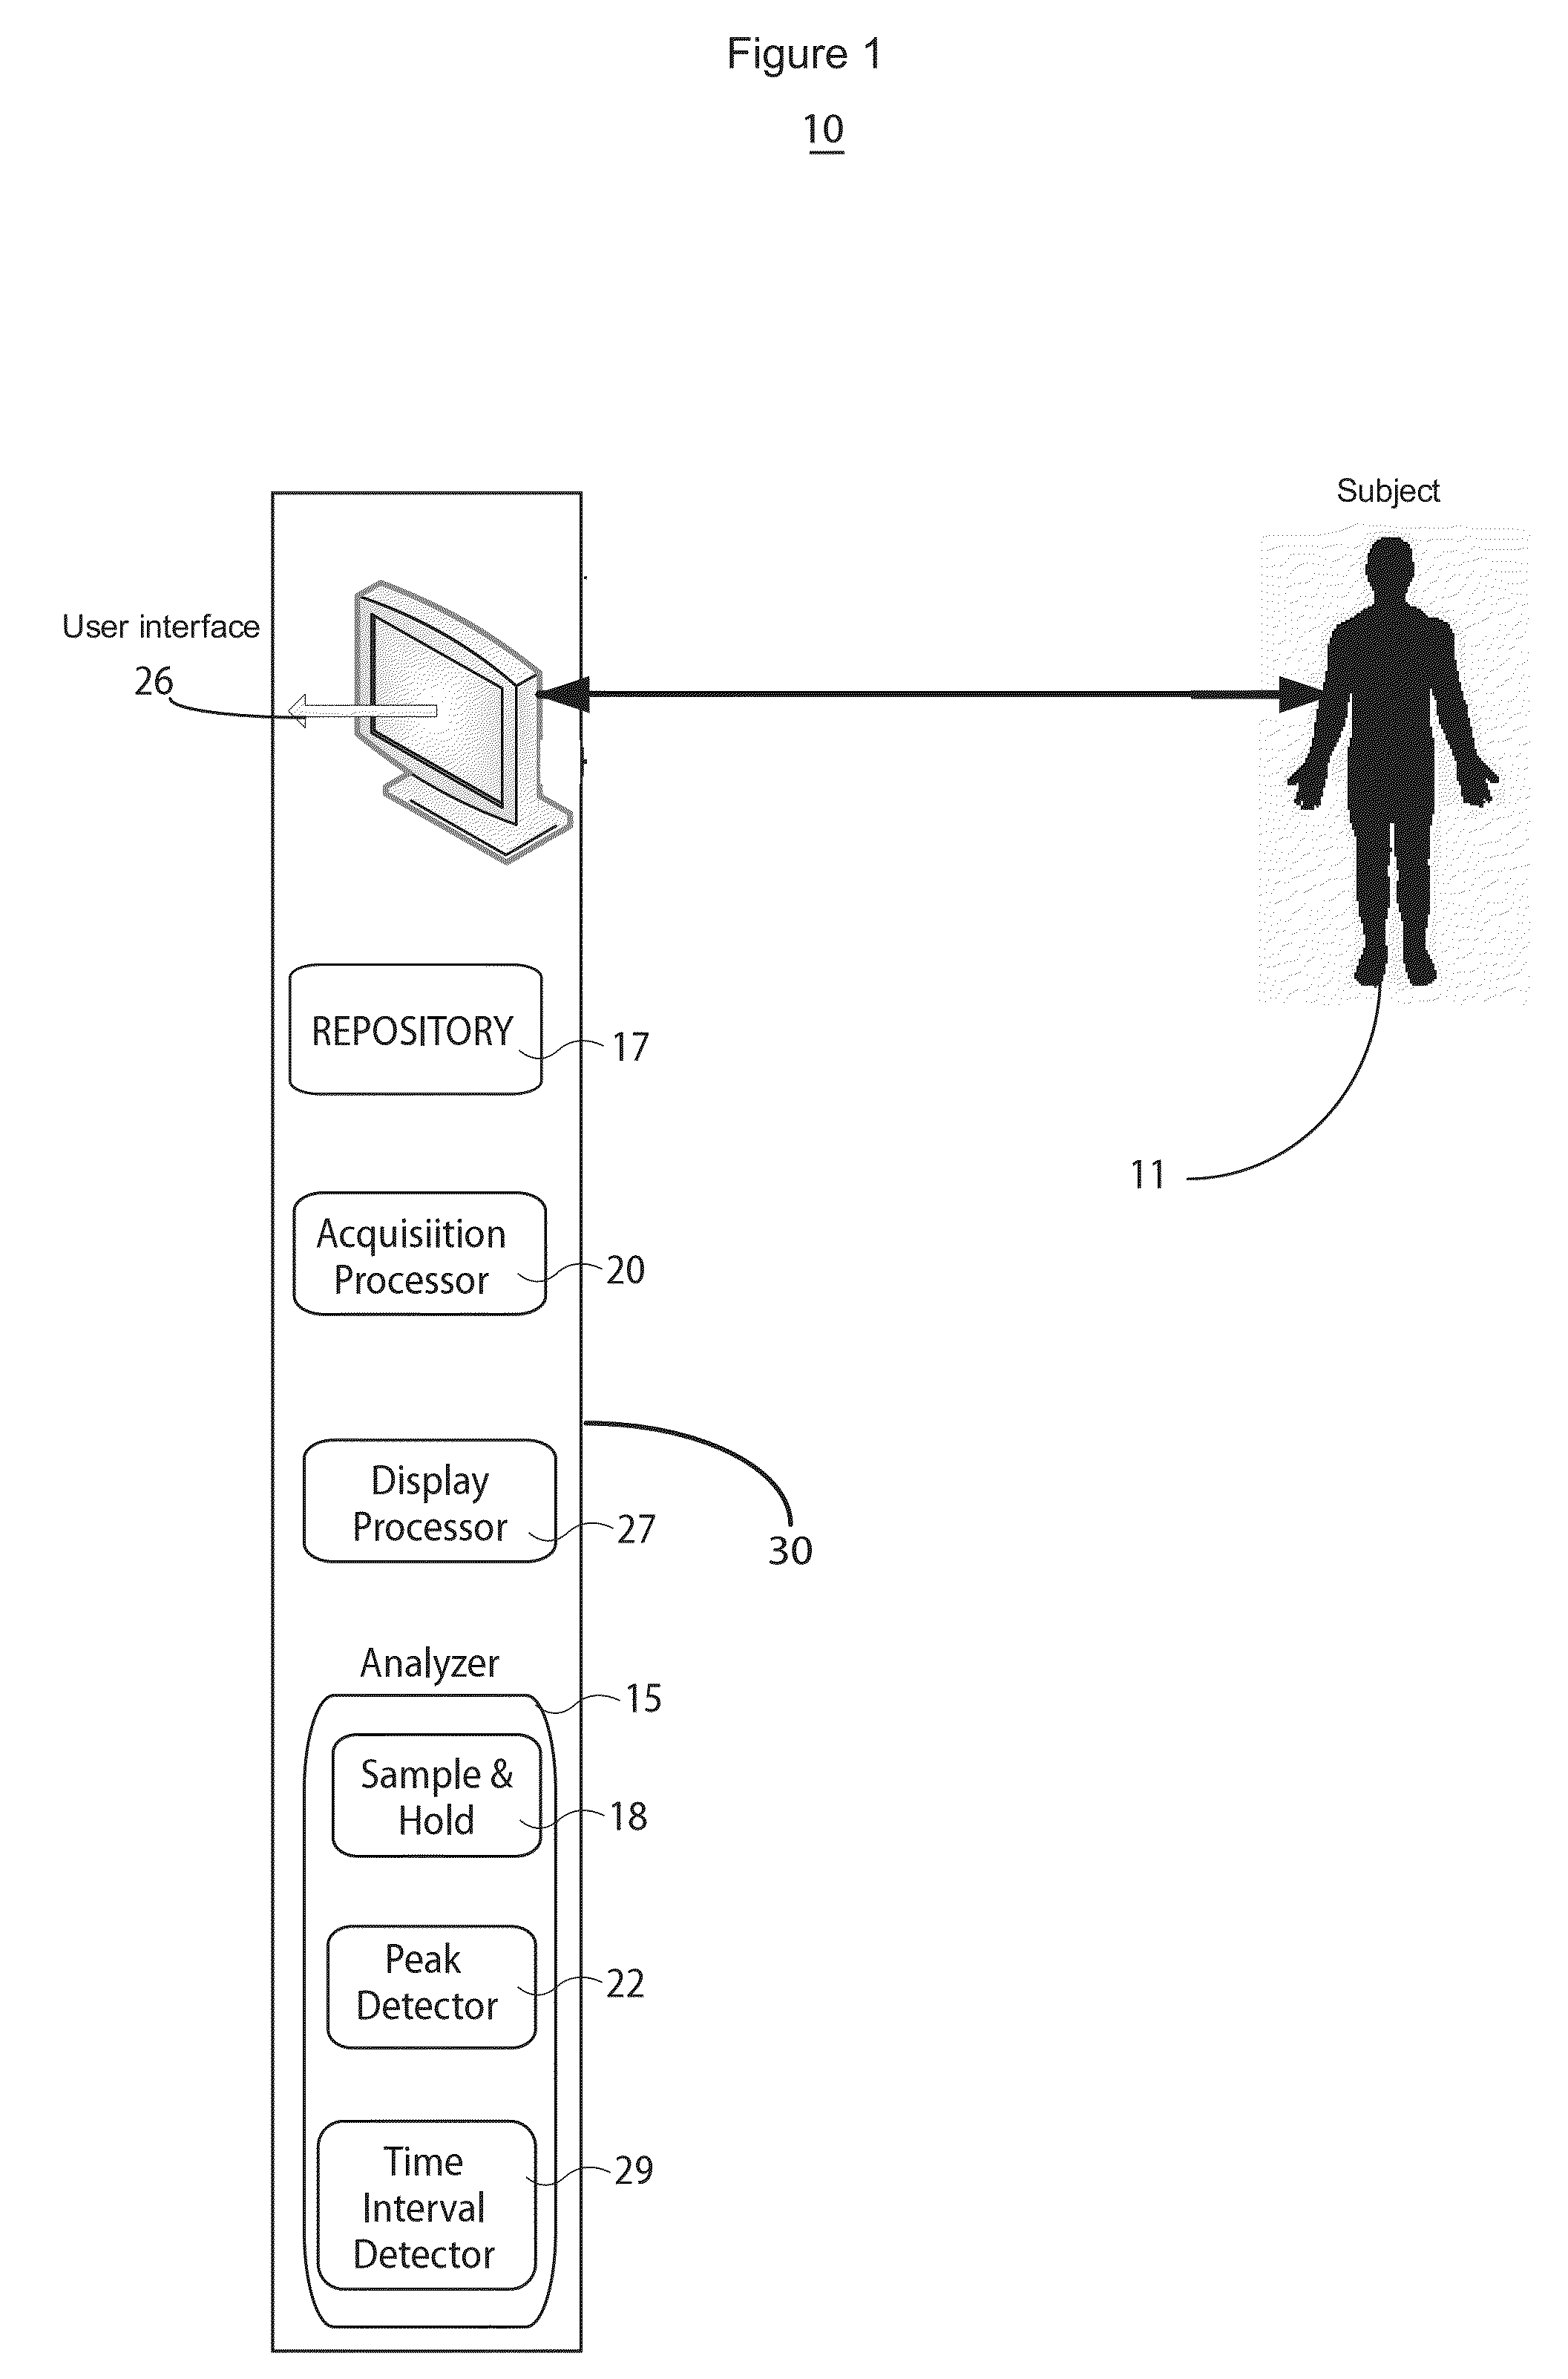
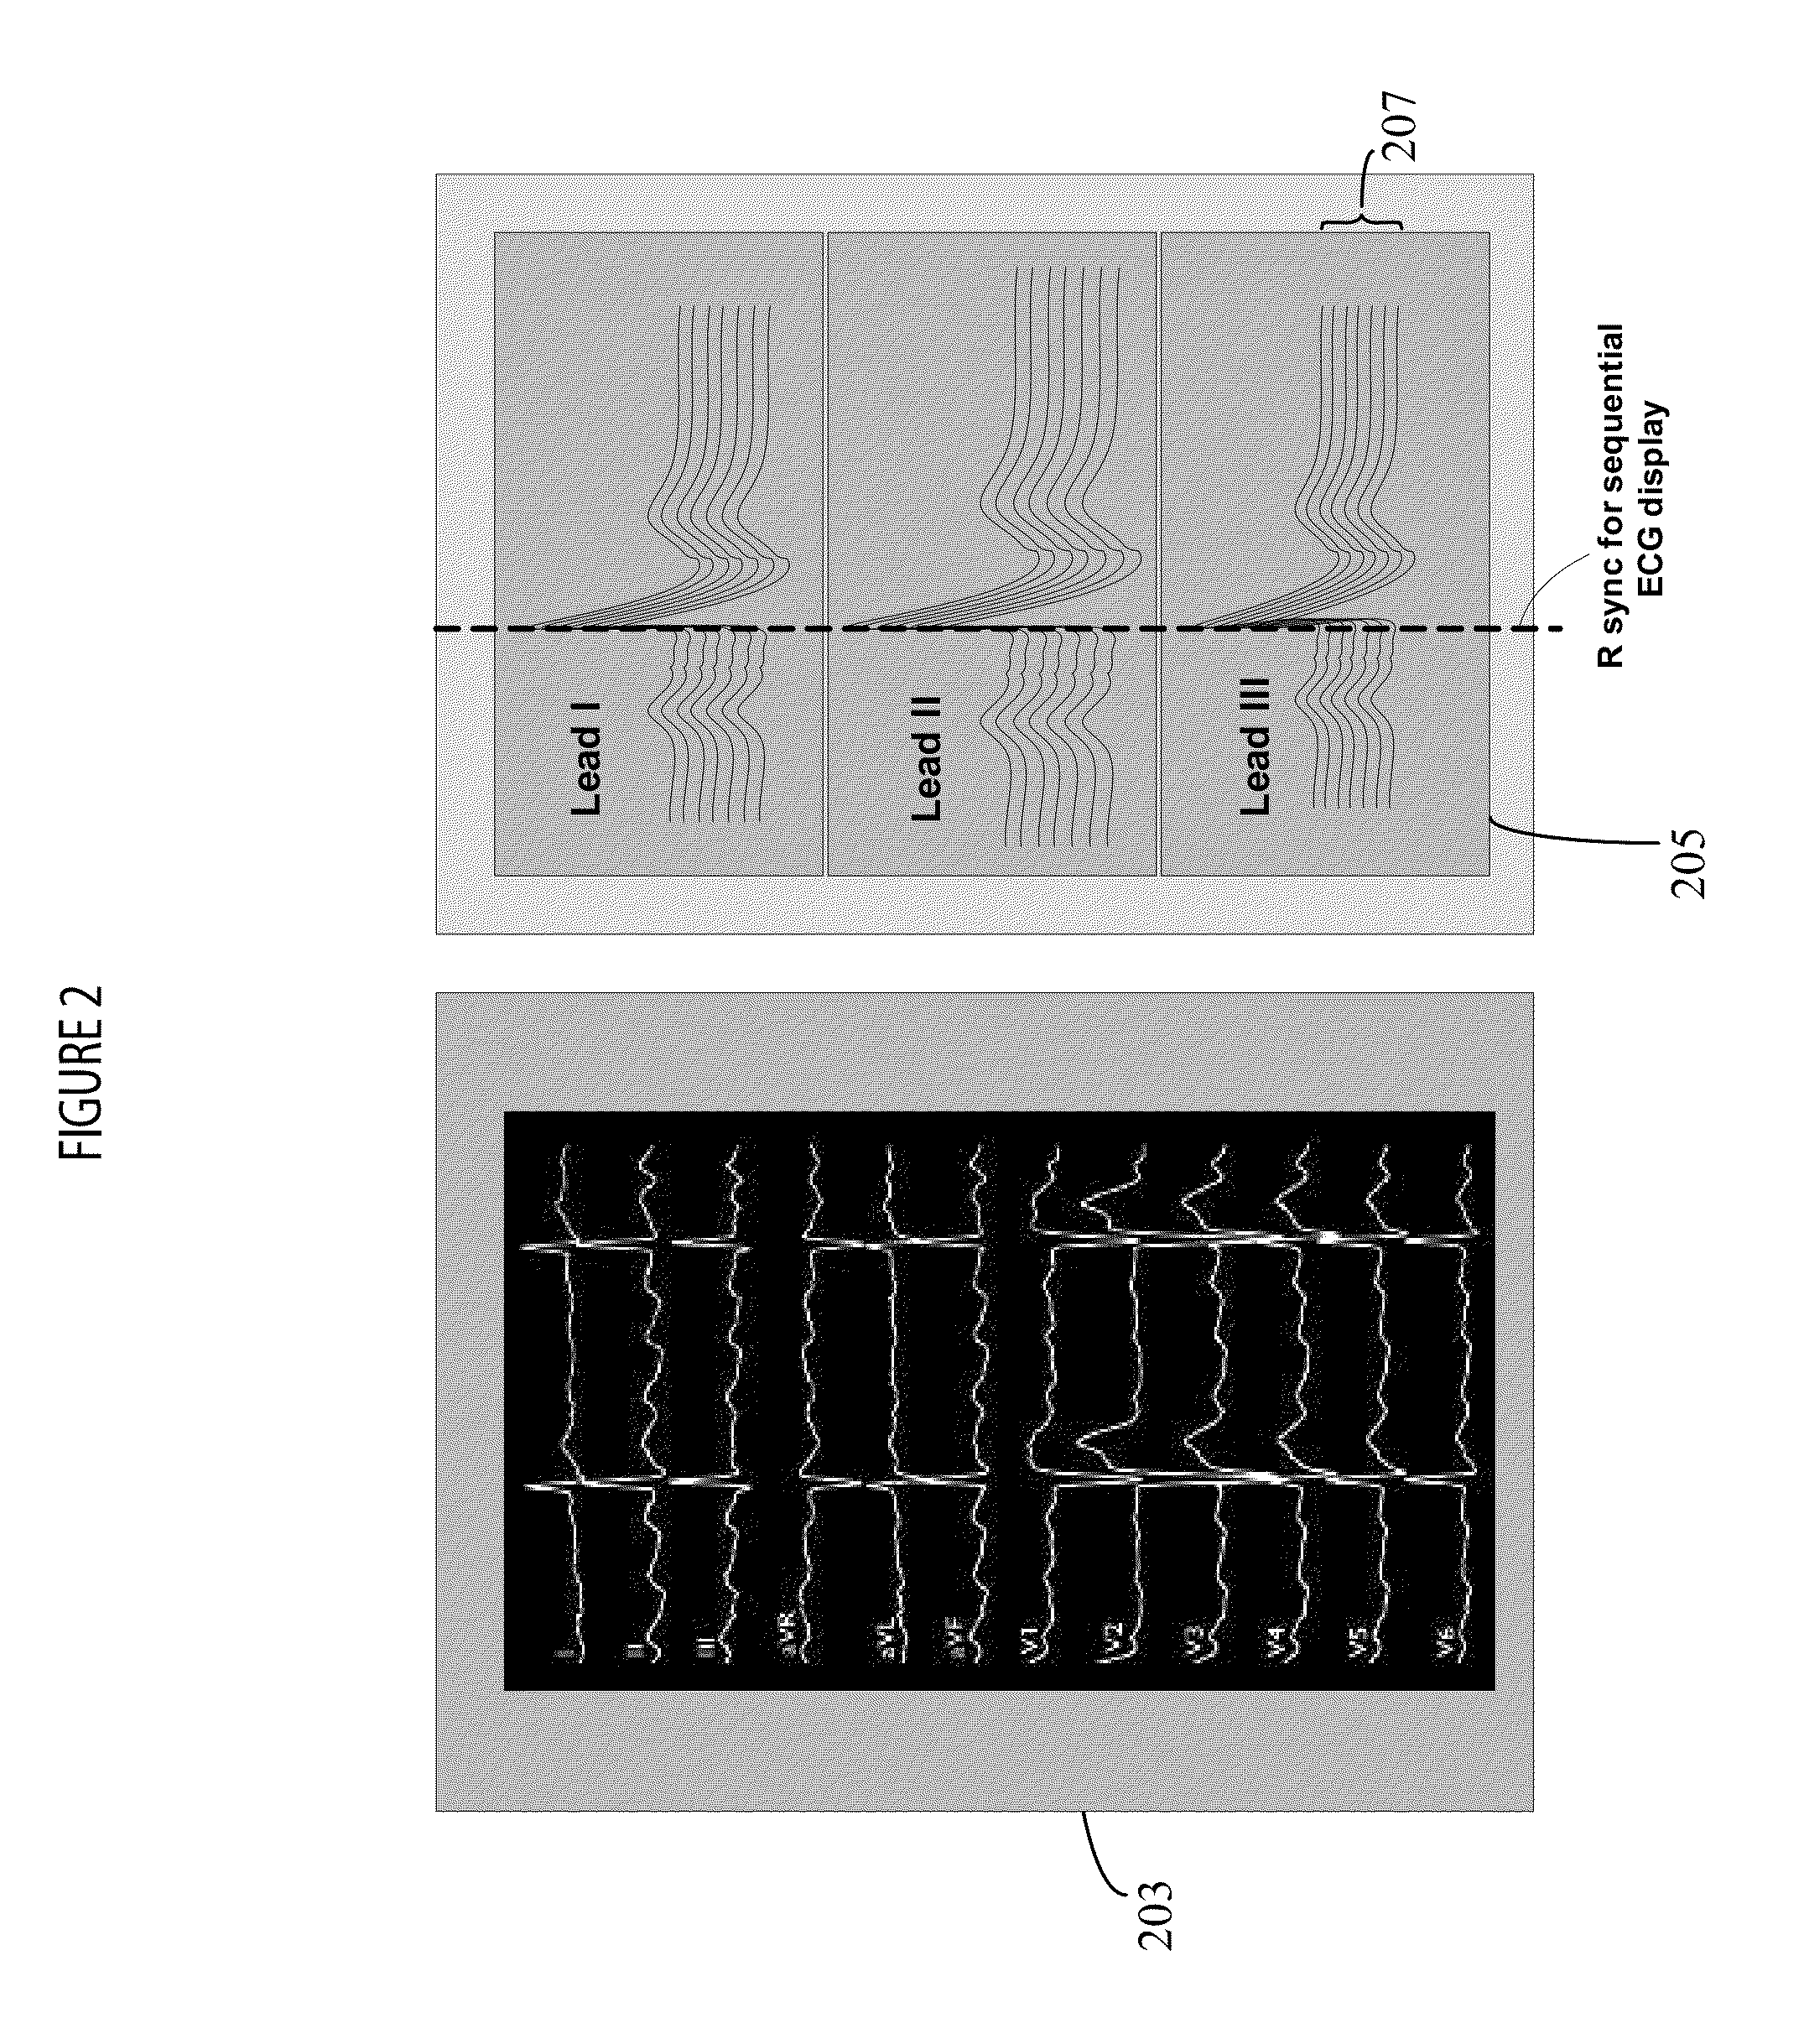
[0006]A system analyzes cardiac electrophysiological signals by employing different kinds of synchronization for sequential multi-dimensional cardiac portion signal comparison and abnormality identification in a corresponding image (X-ray, ultrasound, for example) indicating anatomical structure abnormality severity, location and type. A system analyzes cardiac electrophysiological signals using an acquisition processor for acquiring signal data representing heart electrical activity over multiple heart cycles. An individual heart cycle comprises multiple different signal portions between successive sequential R waves. An analyzer automatically analyzes both, a common portion of multiple successive heart cycles of the signal data synchronized with respect to a P wave and a common portion of multiple successive heart cycles of the signal data synchronized with respect to an R wave, to identify changes occurring in amplitude value and time duration of the common portion of the multiple successive heart cycles of the signal data. A display processor initiates generation of at least one display image showing the common portion of the multiple successive heart cycles synchronized in time, adjacent and mutually vertically displaced to facilitate visual comparison and highlighting an identified change by a visual attribute.

Problems solved by technology

However known analysis and interpretation of a continuous single dimensional ECG waveform is subjective and needs extensive clinical experience for CRM (cardiac rhythm management).
CAD (Coronary Artery Disease) and heart-related problems and cardiac arrhythmias are serious health problems.
However, continuous waveform morphology and time domain parameter analysis is sometimes subjective and time-consuming, and requires extensive expertise and clinical experience for accurate interpretation and proper cardiac rhythm management.
These known systems only use R wave synchronization for signal comparison and are unable to track the location of the arrhythmia and are unreliable or insensitive to early small signal changes and variation.
Additionally, cardiac electrophysiological activities and signals (ECG and ICEG) are time varying and known signal calculation and related analysis usually is unable to localize a precise malfunction severity and trend of the cardiac events (e.g., of myocardial ischemia and infarction), such as cardiac pathology irregularity stages and arrhythmia occurrence.
Known systems also lack criteria for quantitative diagnosis and characterization of a sequential ECG signal trend, especially in an early stage of cardiac events.

Method used


Image

  • System for monitoring and diagnosis of cardiac electrogram signals using multi-dimensional analysis
  • System for monitoring and diagnosis of cardiac electrogram signals using multi-dimensional analysis
  • System for monitoring and diagnosis of cardiac electrogram signals using multi-dimensional analysis

Examples


Embodiment Construction

[0016]A system improves analysis and interpretation of cardiac electrophysiological signals for cardiac patient diagnosis and treatment and quantitatively and automatically synchronizes sequential cardiac heart-beat signals for presentation in a multi-dimensional user-friendly visualization interface. The system employs different kinds of waveform and cardiac function signal based synchronization for sequential cardiac portion signal comparison and related calculation. The system further provides real time multi-dimensional cardiac signal monitoring, parameter calculation and mapping to identify heart function status and in conjunction with an image (X-ray, ultrasound, for example) indicates anatomical structure abnormality severity, location and type. The system facilitates monitoring and visualizing heart function, tissue and rhythm disorders, differentiates cardiac arrhythmias, characterizes pathological severity, predicts life-threatening events, and identifies drug delivery eff...


PUM


Abstract

An analyzer automatically analyzes both, a common portion of multiple successive heart cycles of electrophysiological signal data synchronized with respect to a P wave and a common portion of multiple successive heart cycles of the signal data synchronized with respect to an R wave, to identify changes occurring in amplitude value and time duration of the common portion of the multiple successive heart cycles of the signal data. A display processor initiates generation of at least one display image showing the common portion of the multiple successive heart cycles synchronized in time, adjacent and mutually vertically displaced to facilitate visual comparison and highlighting an identified change by a visual attribute.

Description

[0001]This is a non-provisional application of provisional application Ser. No. 61 / 590,356 filed Jan. 25, 2012, by H. Zhang et al.FIELD OF THE INVENTION[0002]This invention concerns a system for analyzing common portions of successive heart cycles of a cardiac electrophysiological signal to identify changes occurring in amplitude value and time duration of the common portion and visually highlighting changes in a display.BACKGROUND OF THE INVENTION[0003]Electrophysiological signal monitoring including ECG signal and intra-cardiac electrogram monitoring is commonly used for patient health status evaluation. ECG signal morphologies are used to diagnose patient cardiac rhythm and health status. However known analysis and interpretation of a continuous single dimensional ECG waveform is subjective and needs extensive clinical experience for CRM (cardiac rhythm management). CAD (Coronary Artery Disease) and heart-related problems and cardiac arrhythmias are serious health problems. A 12-...

Claims


Application Information

Patent Timeline
Patent Type & Authority Patents(United States)
IPC IPC(8): A61B5/044A61B5/352
CPCA61B5/0456A61B5/0452A61B5/044A61B5/339A61B5/352A61B5/349
Inventor ZHANG, HONGXUANUVAROV, MIKHAIL
Owner PIXART IMAGING INC
Learn More