Interactive visualization of temporal event data and correlated outcomes

a temporal event and interactive visualization technology, applied in the electrical, electronic and computer arts fields, can solve problems such as difficult analysis of data sets

Active Publication Date: 2014-09-30
INT BUSINESS MASCH CORP
View PDF4 Cites 29 Cited by
  • Summary
  • Abstract
  • Description
  • Claims
  • Application Information

AI Technical Summary

Problems solved by technology

The vast amount of information, however, can be overwhelming and makes these datasets difficult to analyze.

Method used


Image

  • Interactive visualization of temporal event data and correlated outcomes
  • Interactive visualization of temporal event data and correlated outcomes
  • Interactive visualization of temporal event data and correlated outcomes

Examples


Embodiment Construction

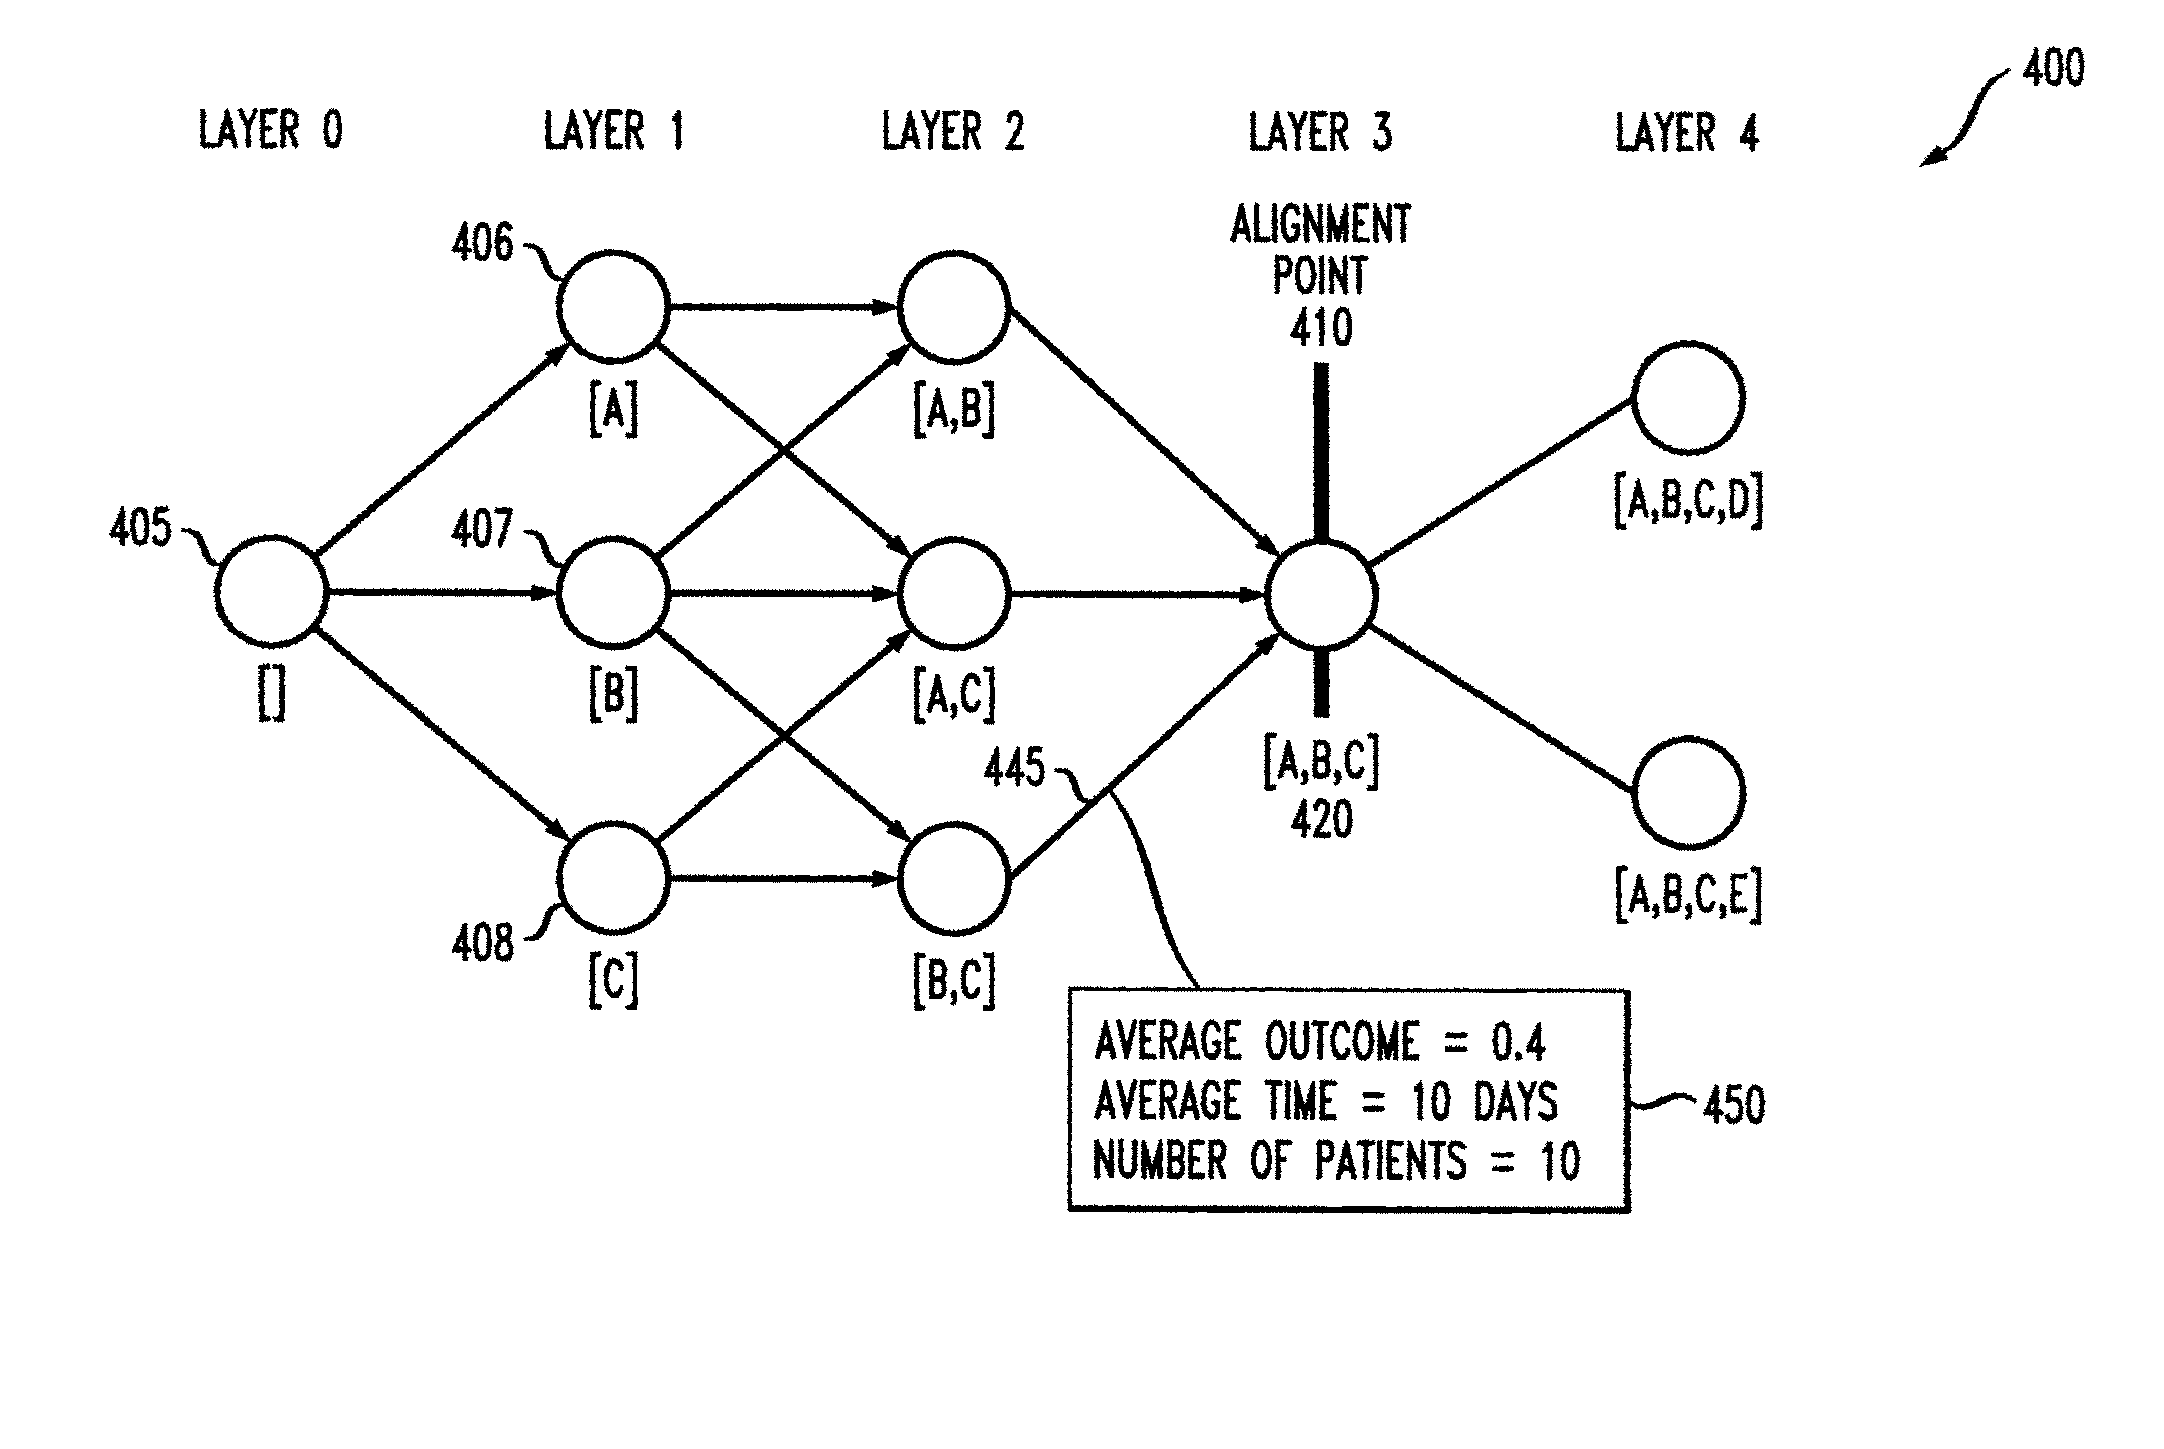
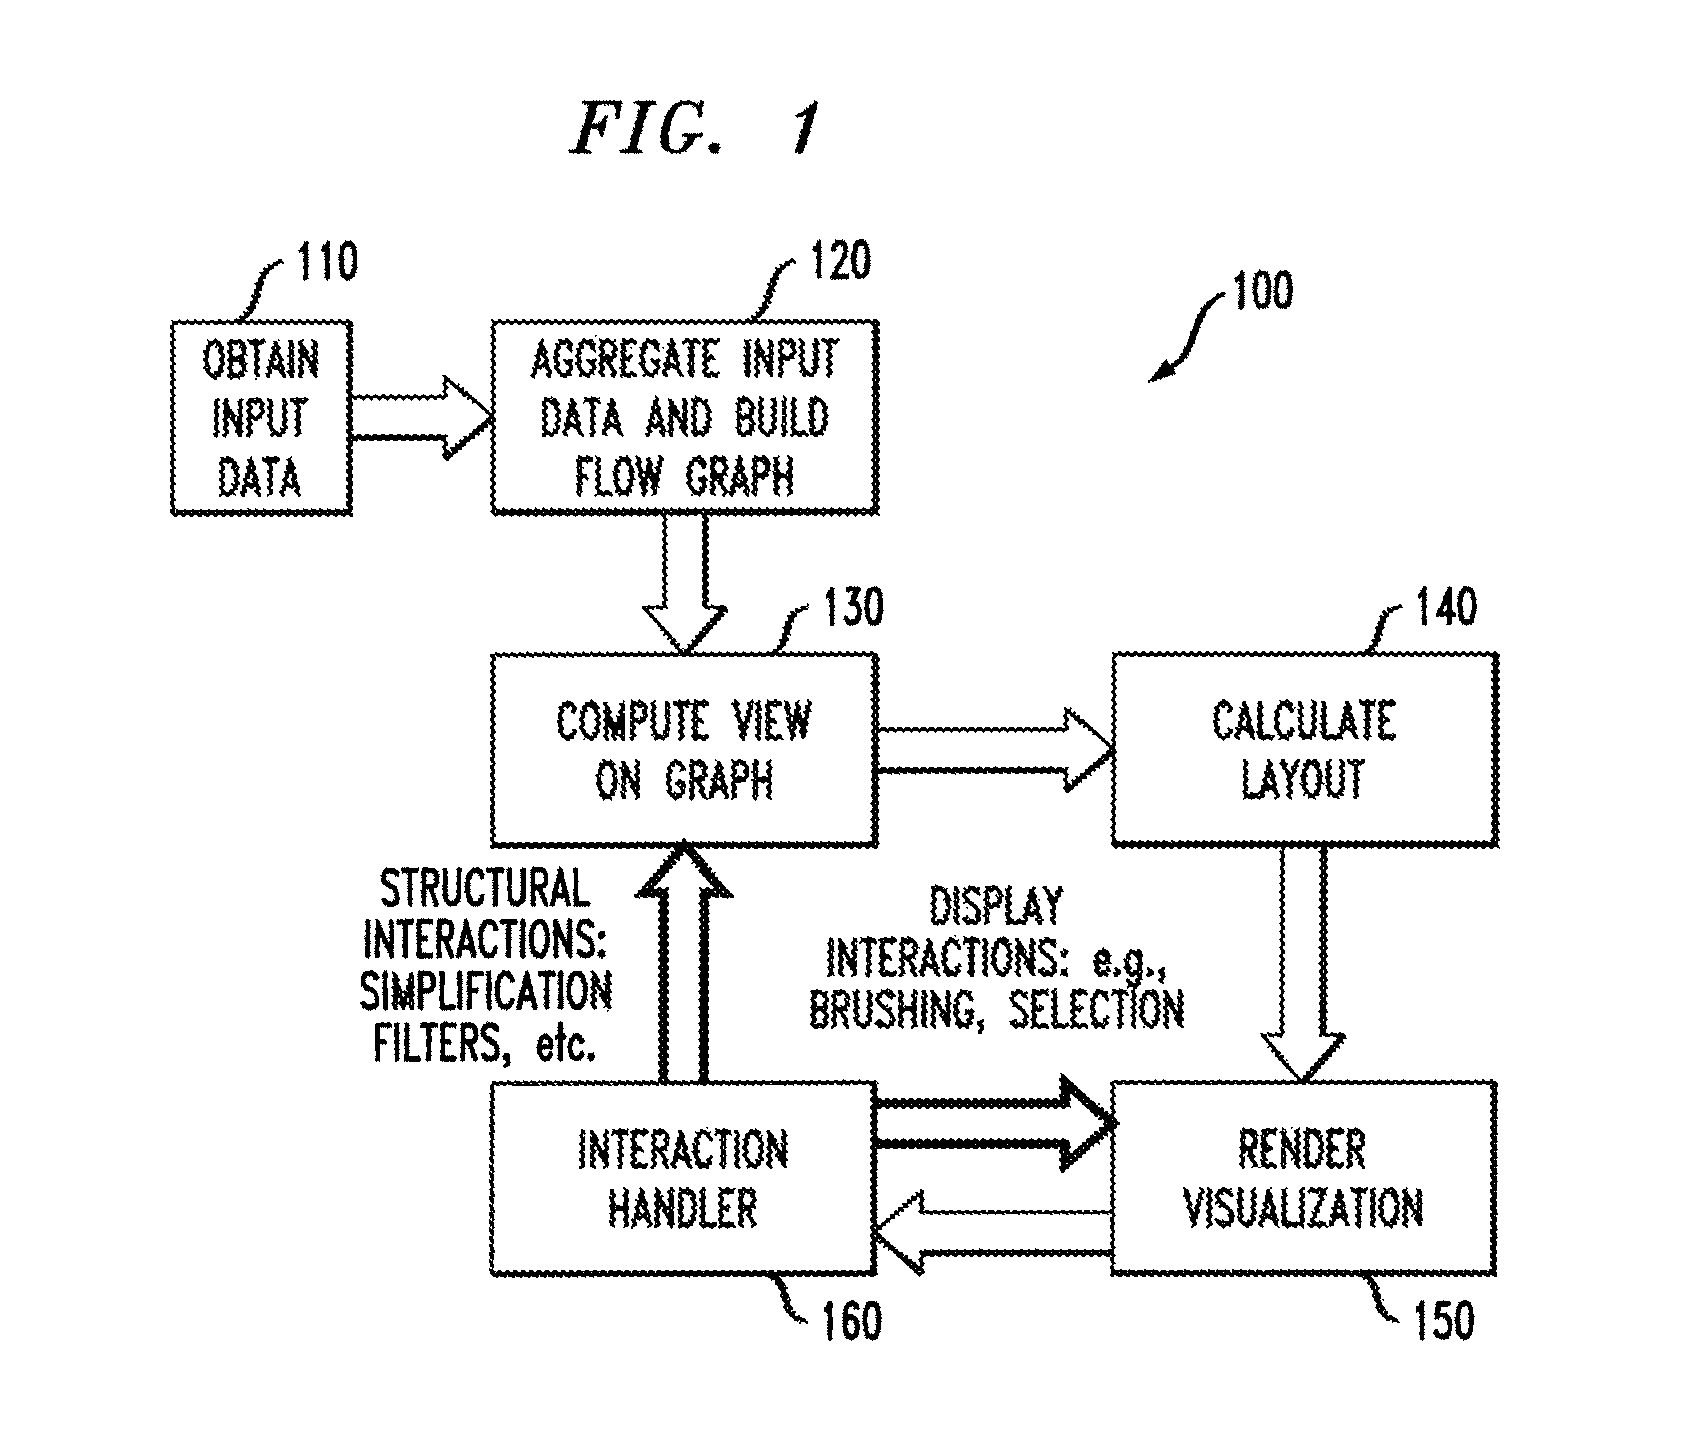
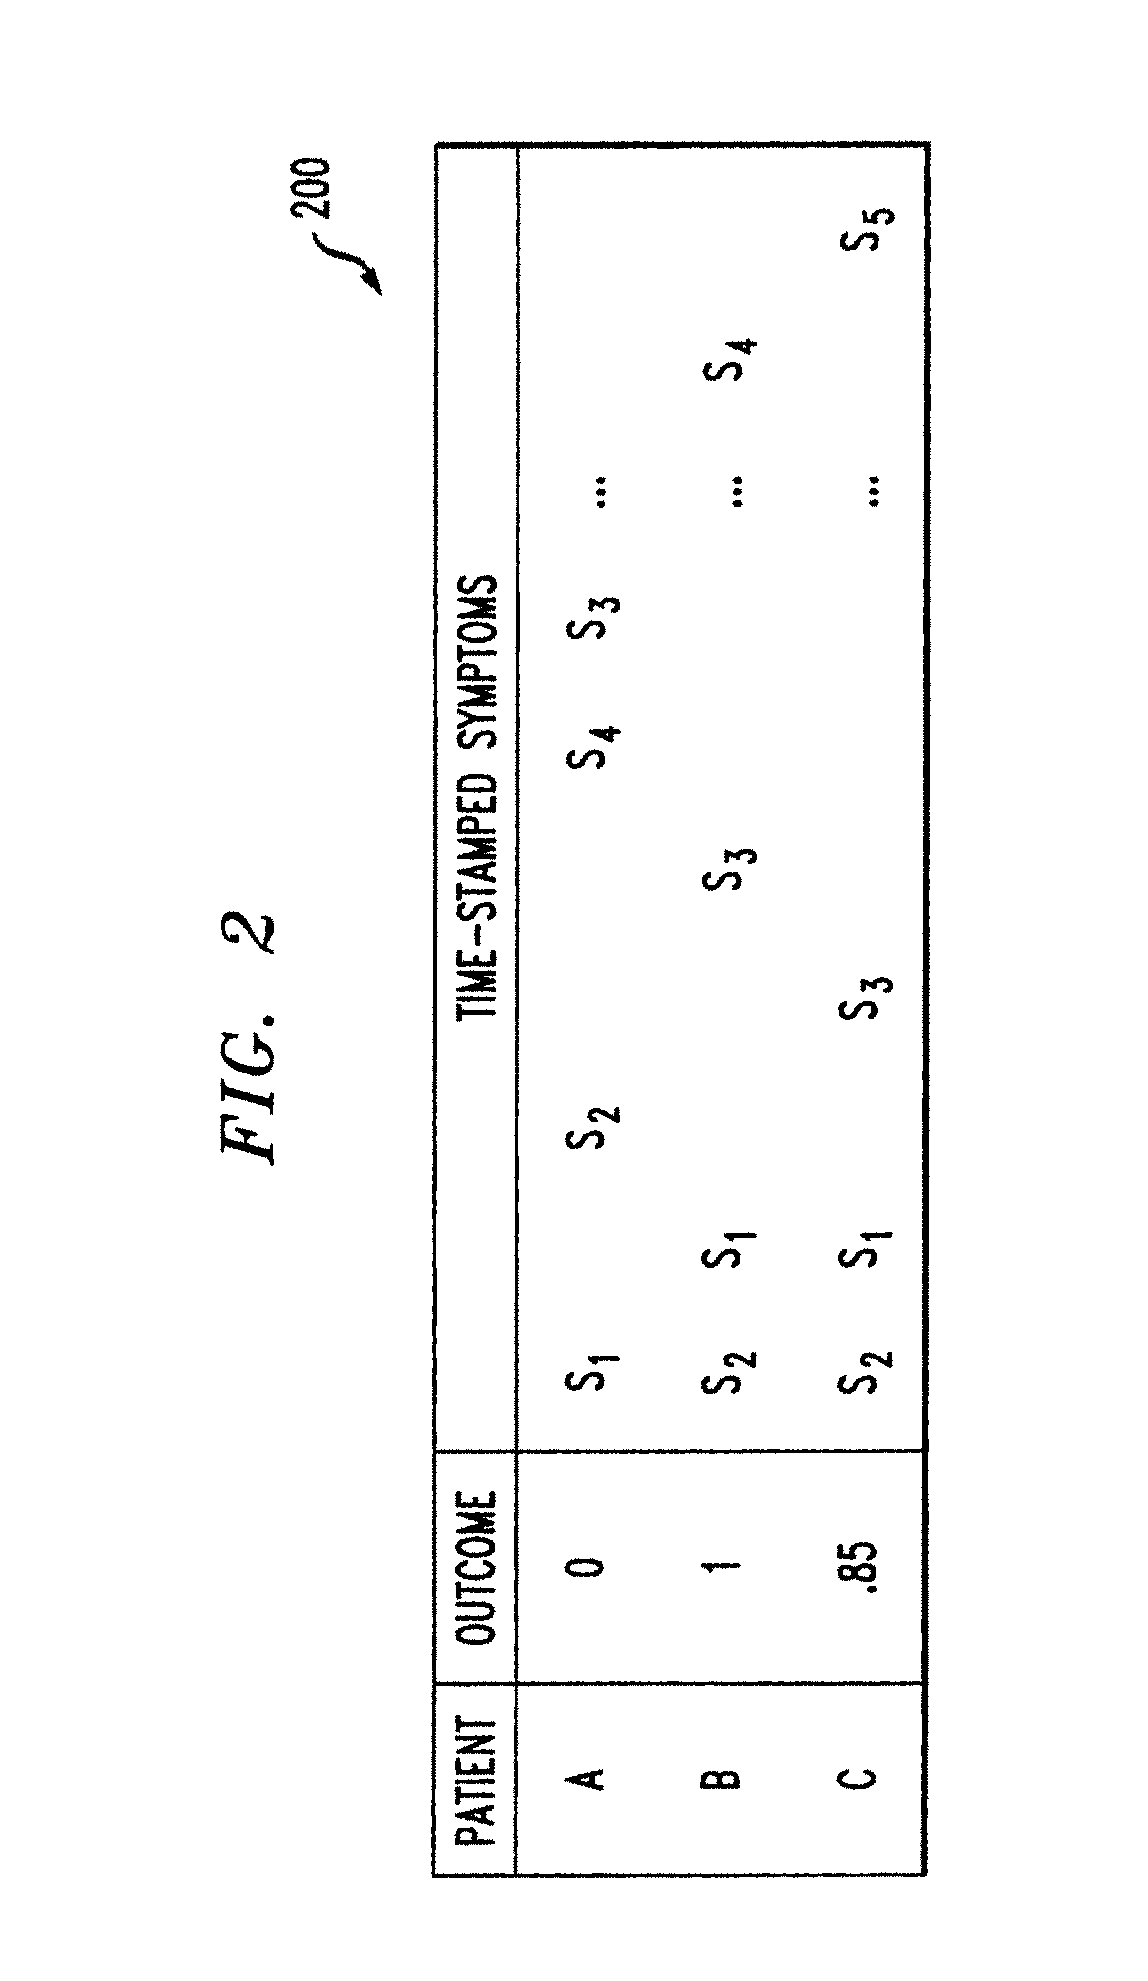
[0018]The present invention provides a tool for aggregating and visualizing temporal event data. According to one aspect of the invention, the aggregation of temporal event data allows common states to be identified, as well as the various transitions between states. In addition, methods and apparatus are provided for identifying correlations between pathways between states and the eventual outcomes. While the present invention is illustrated herein in the context of exemplary electronic medical records (EMRs), the present invention can be employed to aggregate and / or visualize any temporal event data, as would be apparent to a person of ordinary skill in the art.

[0019]According to one aspect of the invention, temporal event data extracted from multiple records is summarized to show aggregate evolution statistics for a number of records. Another aspect of the invention aggregates the temporal event data, such as multiple patient records, into a graph-based visual presentation. In th...


PUM


Abstract

Methods and apparatus are provided for interactive visualization of temporal event data and correlated outcomes. The temporal event data comprises a plurality of entities undergoing one or more events. The temporal event data is aggregated and a flow graph is generated to represent the aggregated temporal event data. The flow graph comprises a directed acyclic graph having a plurality of nodes connected by edges, wherein each of the nodes represents a group of entities in a given state. A view of the flow graph is generated and then a visualization of the flow graph view can be rendered to a user. The user can interact with the flow graph view and the visualization and / or the flow graph view can be updated based on the user interactions. The flow graph is sliced into layers, wherein a given layer i contains all nodes with i events.

Description

FIELD OF THE INVENTION[0001]The present invention relates generally to the electrical, electronic and computer arts, and, more particularly, to techniques for aggregation and / or visualization of temporal event data.BACKGROUND OF THE INVENTION[0002]Temporal event data is common in many fields. Temporal event data typically comprises a set of entities undergoing various events, such as patients that are diagnosed with various symptoms or call center tickets that move from an initial call state to a resolution state. Electronic medical records (EMRs), for example, are proliferating throughout the healthcare system and contain a large amount of temporal disease events such as diagnosis dates and the onset dates for various symptoms. At major medical institutions, such as hospitals, insurance companies and large medical groups, these databases contain large amounts of historical patient data complete with patient profile information, structured observational data (such as diagnosis codes...

Claims


Application Information

Patent Timeline
Patent Type & Authority Patents(United States)
IPC IPC(8): G06F19/00G06T11/20
CPCG06T11/206G06F19/3487G16H15/00
Inventor GOTZ, DAVIDWONGSUPHASAWAT, KRIST
Owner INT BUSINESS MASCH CORP
Why Eureka
Try Eureka