
Statistical analysis method for automatically selecting a statistical analysis algorithm based on data values and input parameters

a statistical analysis and automatic selection technology, applied in the field of statistical analysis methods for automatically selecting statistical analysis algorithms based on data values and input parameters, can solve the problems of difficult statistical software packages, complicated mastery of statistics fundamentals, and difficulty in achieving statistical analysis

Active Publication Date: 2016-06-28
GMG HLDG LLC
View PDF10 Cites 10 Cited by
  • Summary
  • Abstract
  • Description
  • Claims
  • Application Information

AI Technical Summary

Benefits of technology

The present disclosure is about a statistical software package that helps manufacturing and business applications collect and analyze data. The software provides a simplified interface for data entry and interpretation of results. It also supports user-conducted tests but determines which ones are relevant. The software package is web-based and has pre-configured analysis functions and reporting options. Overall, the software simplifies data collection, analysis, and reporting for various manufacturing and business needs.

Problems solved by technology

For many individuals, mastery of statistics fundamentals is further complicated by the required mastery of the software packages.
One of the reasons statistical software packages are difficult even for organizational experts to master is that the interfaces are cumbersome and non-intuitive.
Because no wizards are provided for important tools such as nonparametric hypothesis testing and nonlinear regression tests, existing packages are not very useful for manufacturing and business applications.
While many statistical software packages are feature-rich and very powerful, they provide far more functionality than is needed for many manufacturing and business applications and therefore, are very difficult to use.
In addition, for many unskilled users in statistics, they do not support automated statistical methods that are important for manufacturing and business process statistical analysis.

Method used


Image

  • Statistical analysis method for automatically selecting a statistical analysis algorithm based on data values and input parameters
  • Statistical analysis method for automatically selecting a statistical analysis algorithm based on data values and input parameters
  • Statistical analysis method for automatically selecting a statistical analysis algorithm based on data values and input parameters

Examples


Embodiment Construction

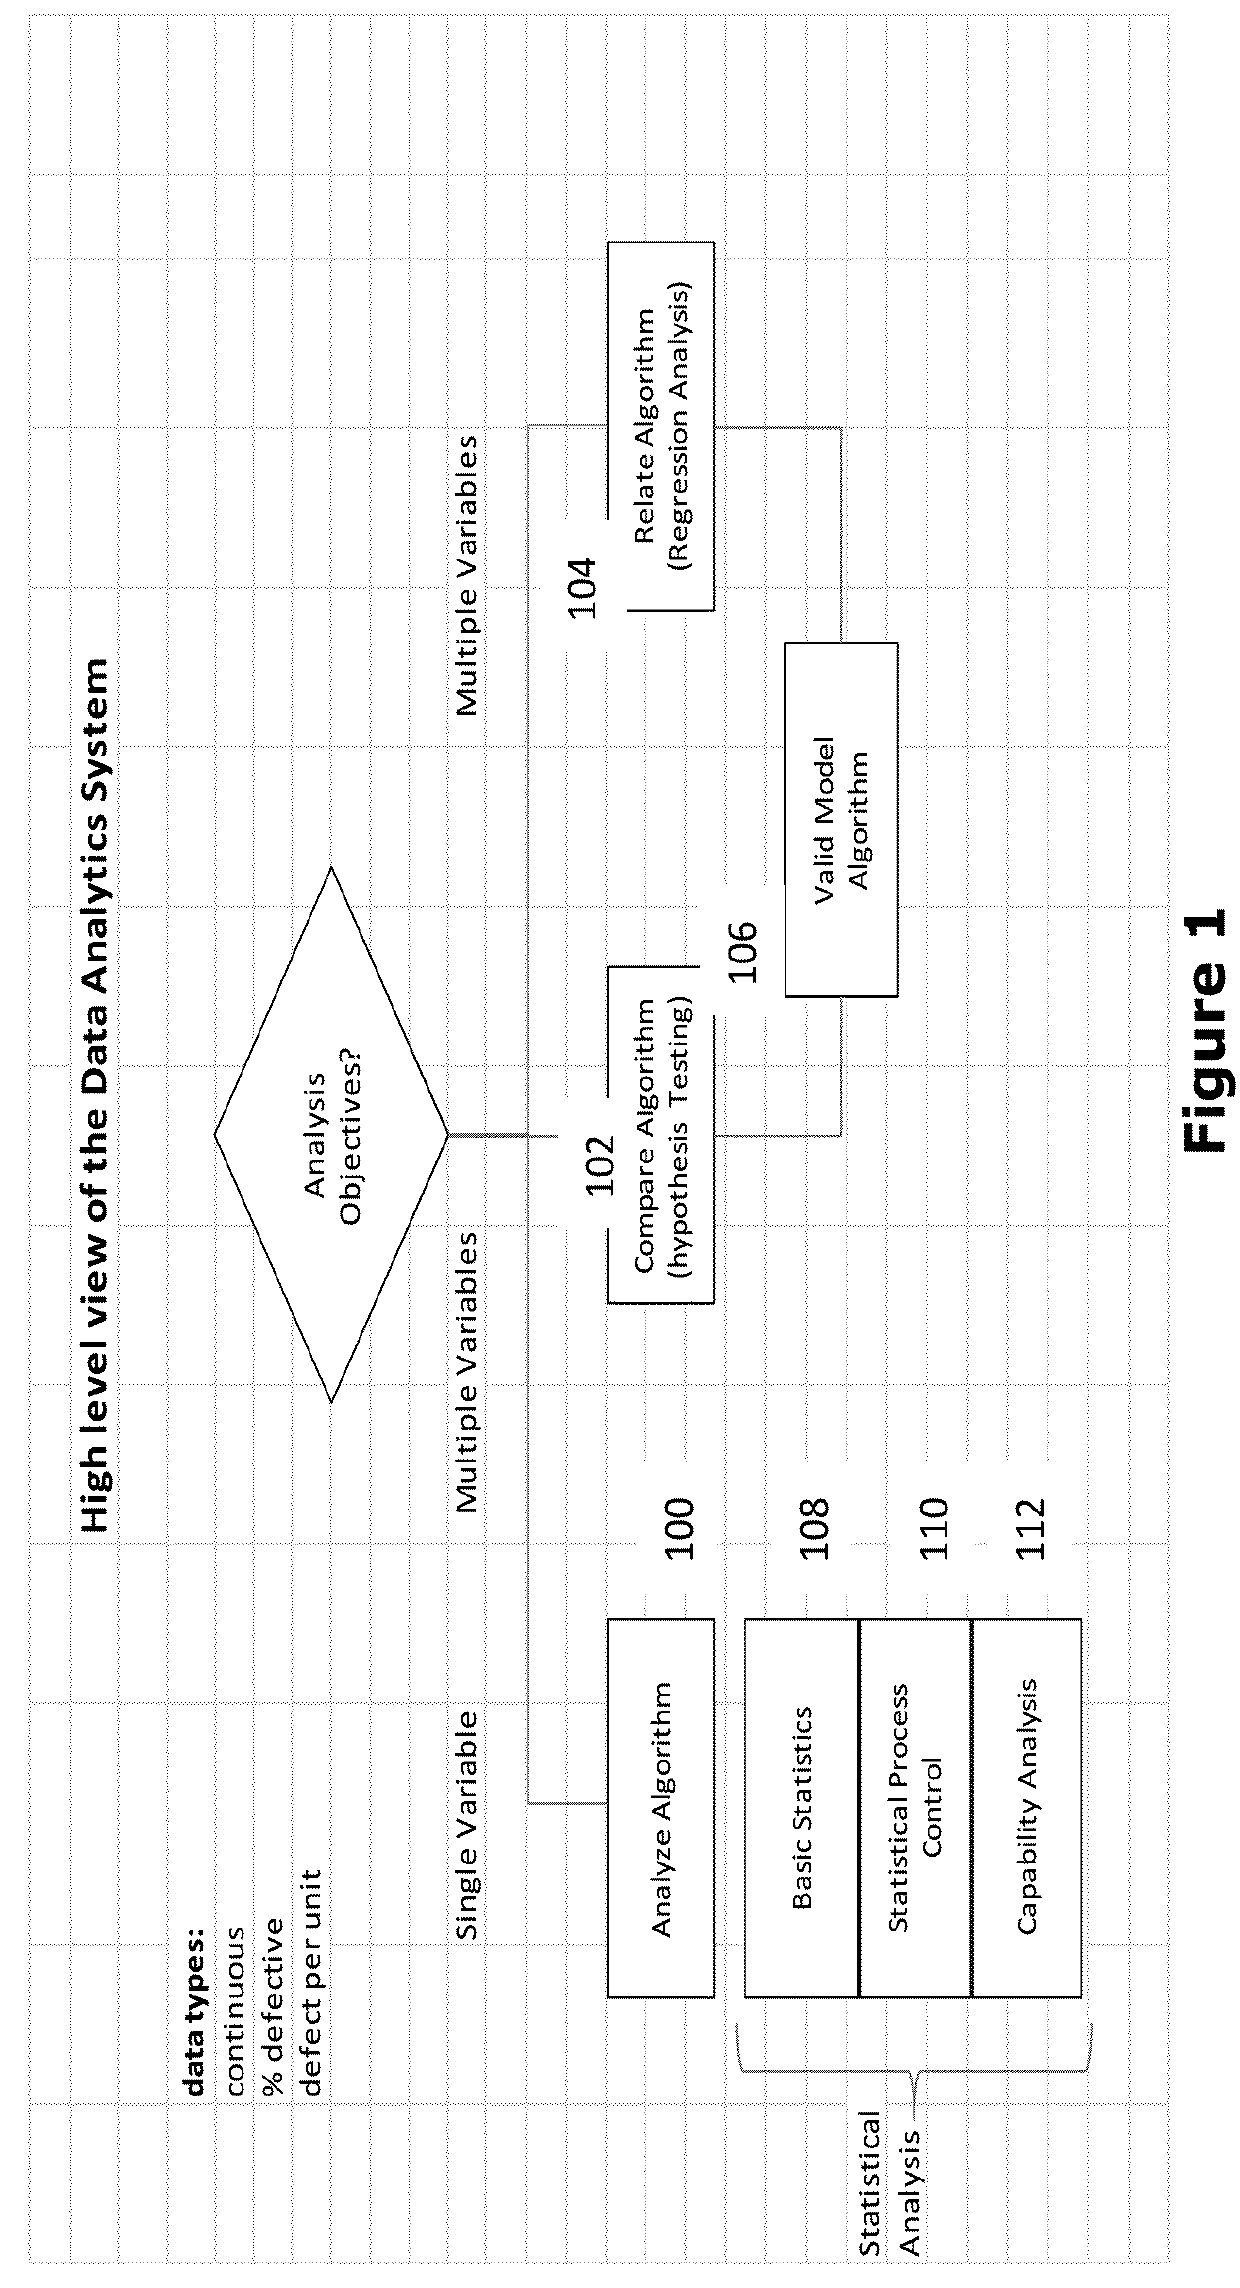
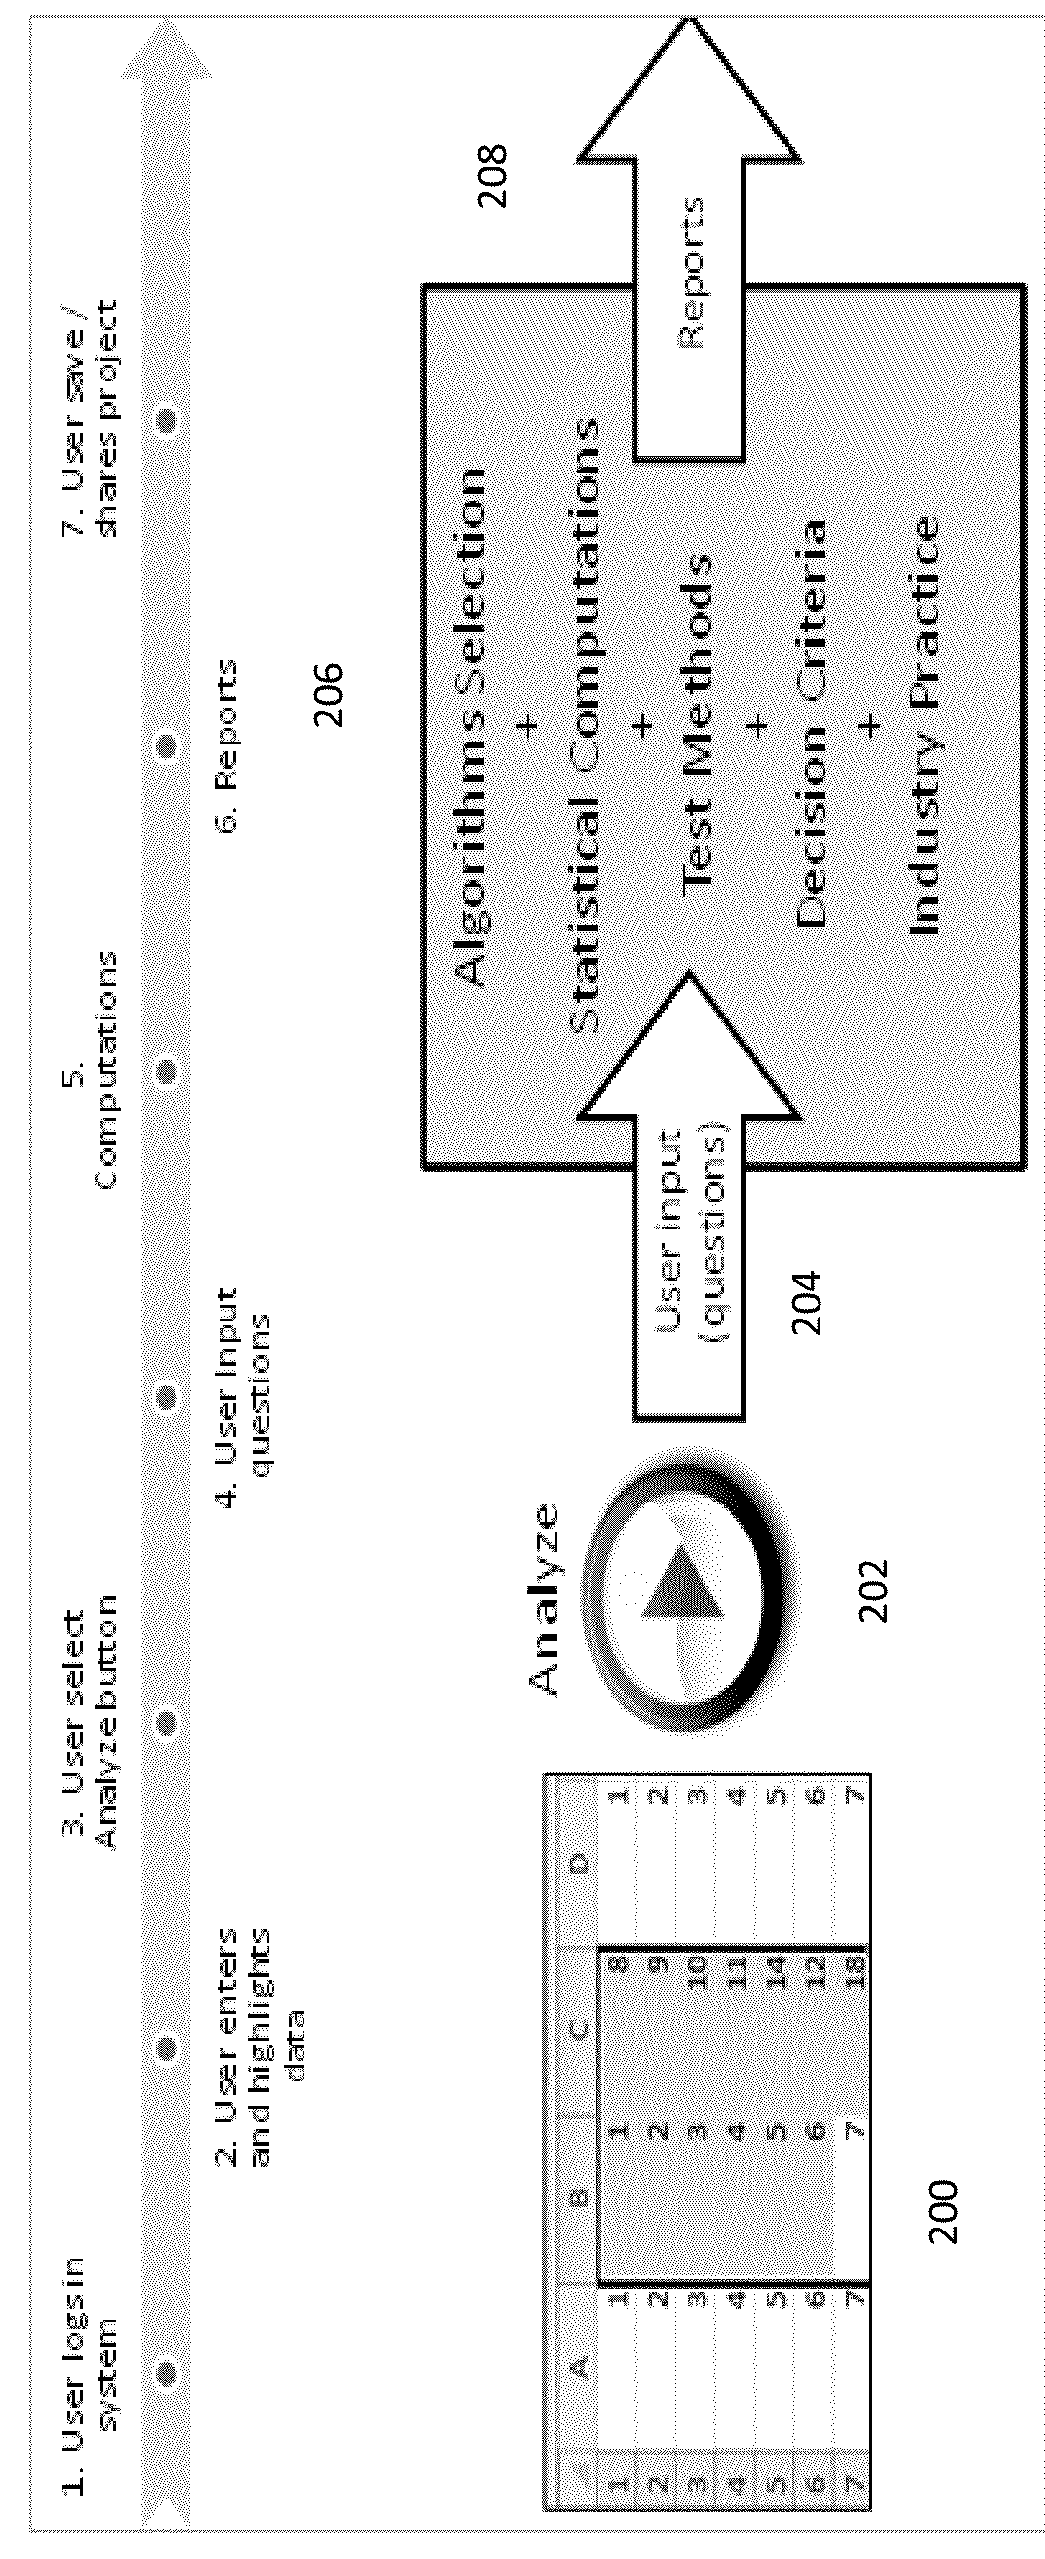
[0019]Referring to FIG. 1, a flow diagram of a data analytics system according to an example embodiment is shown. In an example embodiment, the system comprises four primary algorithms: analyze algorithm 100; compare algorithm (for both differences and associations between variables) 102; relate algorithm (for both observed and controlled experiments) 104; and valid model algorithm 106. The algorithms represent the most common statistical analyses used for quality improvement and data analysis. The analyses apply to both individual and multiple variable studies. In an example embodiment, a web-based software application may be used to analyze products and services outputs across numerous industries. Based on minimal user input, the system continually pares down the tool choices and eliminates tools that are not needed to move from general-to-specific tool selections for particular process data. The tool choices and data checks are made continuously without user involvement for each ...


PUM


Abstract

A statistical software package for manufacturing and business applications is disclosed. The software package comprises an improved user interface that supports data collection, entry, and analysis features for manufacturing and business applications. Data entry is simplified by prompting the user for no more data than is needed to perform calculations and analysis. The software completes complex data analysis, interprets the data in the background, and reports simple analysis results to the user about the data that has been entered. The software supports user conducted tests but decides which test or tests are appropriate test and which results are relevant for the user. In an example embodiment, the software package is implemented as a web-based application with a central database accessible through a web service to provide support to the user. In an example embodiment, the application provides data collection, data entry, analysis, interpretation, graphing, and reporting functionality.

Description

CROSS-REFERENCE TO RELATED APPLICATIONS[0001]None.BACKGROUND OF THE INVENTION[0002]Many business management strategies strive to improve the quality of process outputs by identifying and removing the causes of defects or errors and minimizing variability in the manufacturing and business processes. The strategies often use a set of quality management methods, including statistical methods, and suggest creating a special infrastructure of people within the organization (e.g., “Black Belts,”“Green Belts,” etc.) who are experts in these methods. Projects in the organization may be carried out according to a method and follow a defined sequence of steps toward a specified goal (e.g., a quantified manufacturing tolerance).[0003]Although application of statistical methods to manufacturing and business processes is known to be an effective way to achieve improvements, learning and developing appropriate skills in the application of statistical methods requires patience and diligence. Becau...

Claims


Application Information

Patent Timeline
IPC IPC(8): G06F15/00G06F17/24G06F17/18
CPCG06F17/246G06F40/18
Inventor GHANEM, GEORGE KHADER
Owner GMG HLDG LLC
Learn More