Calibrations and controls for droplet-based assays

a droplet-based assay and control technology, applied in the field of ##droplet-based tests for amplification, can solve the problems of false negatives and false positives, erroneous results, and negative effects of false positives

Active Publication Date: 2016-08-16
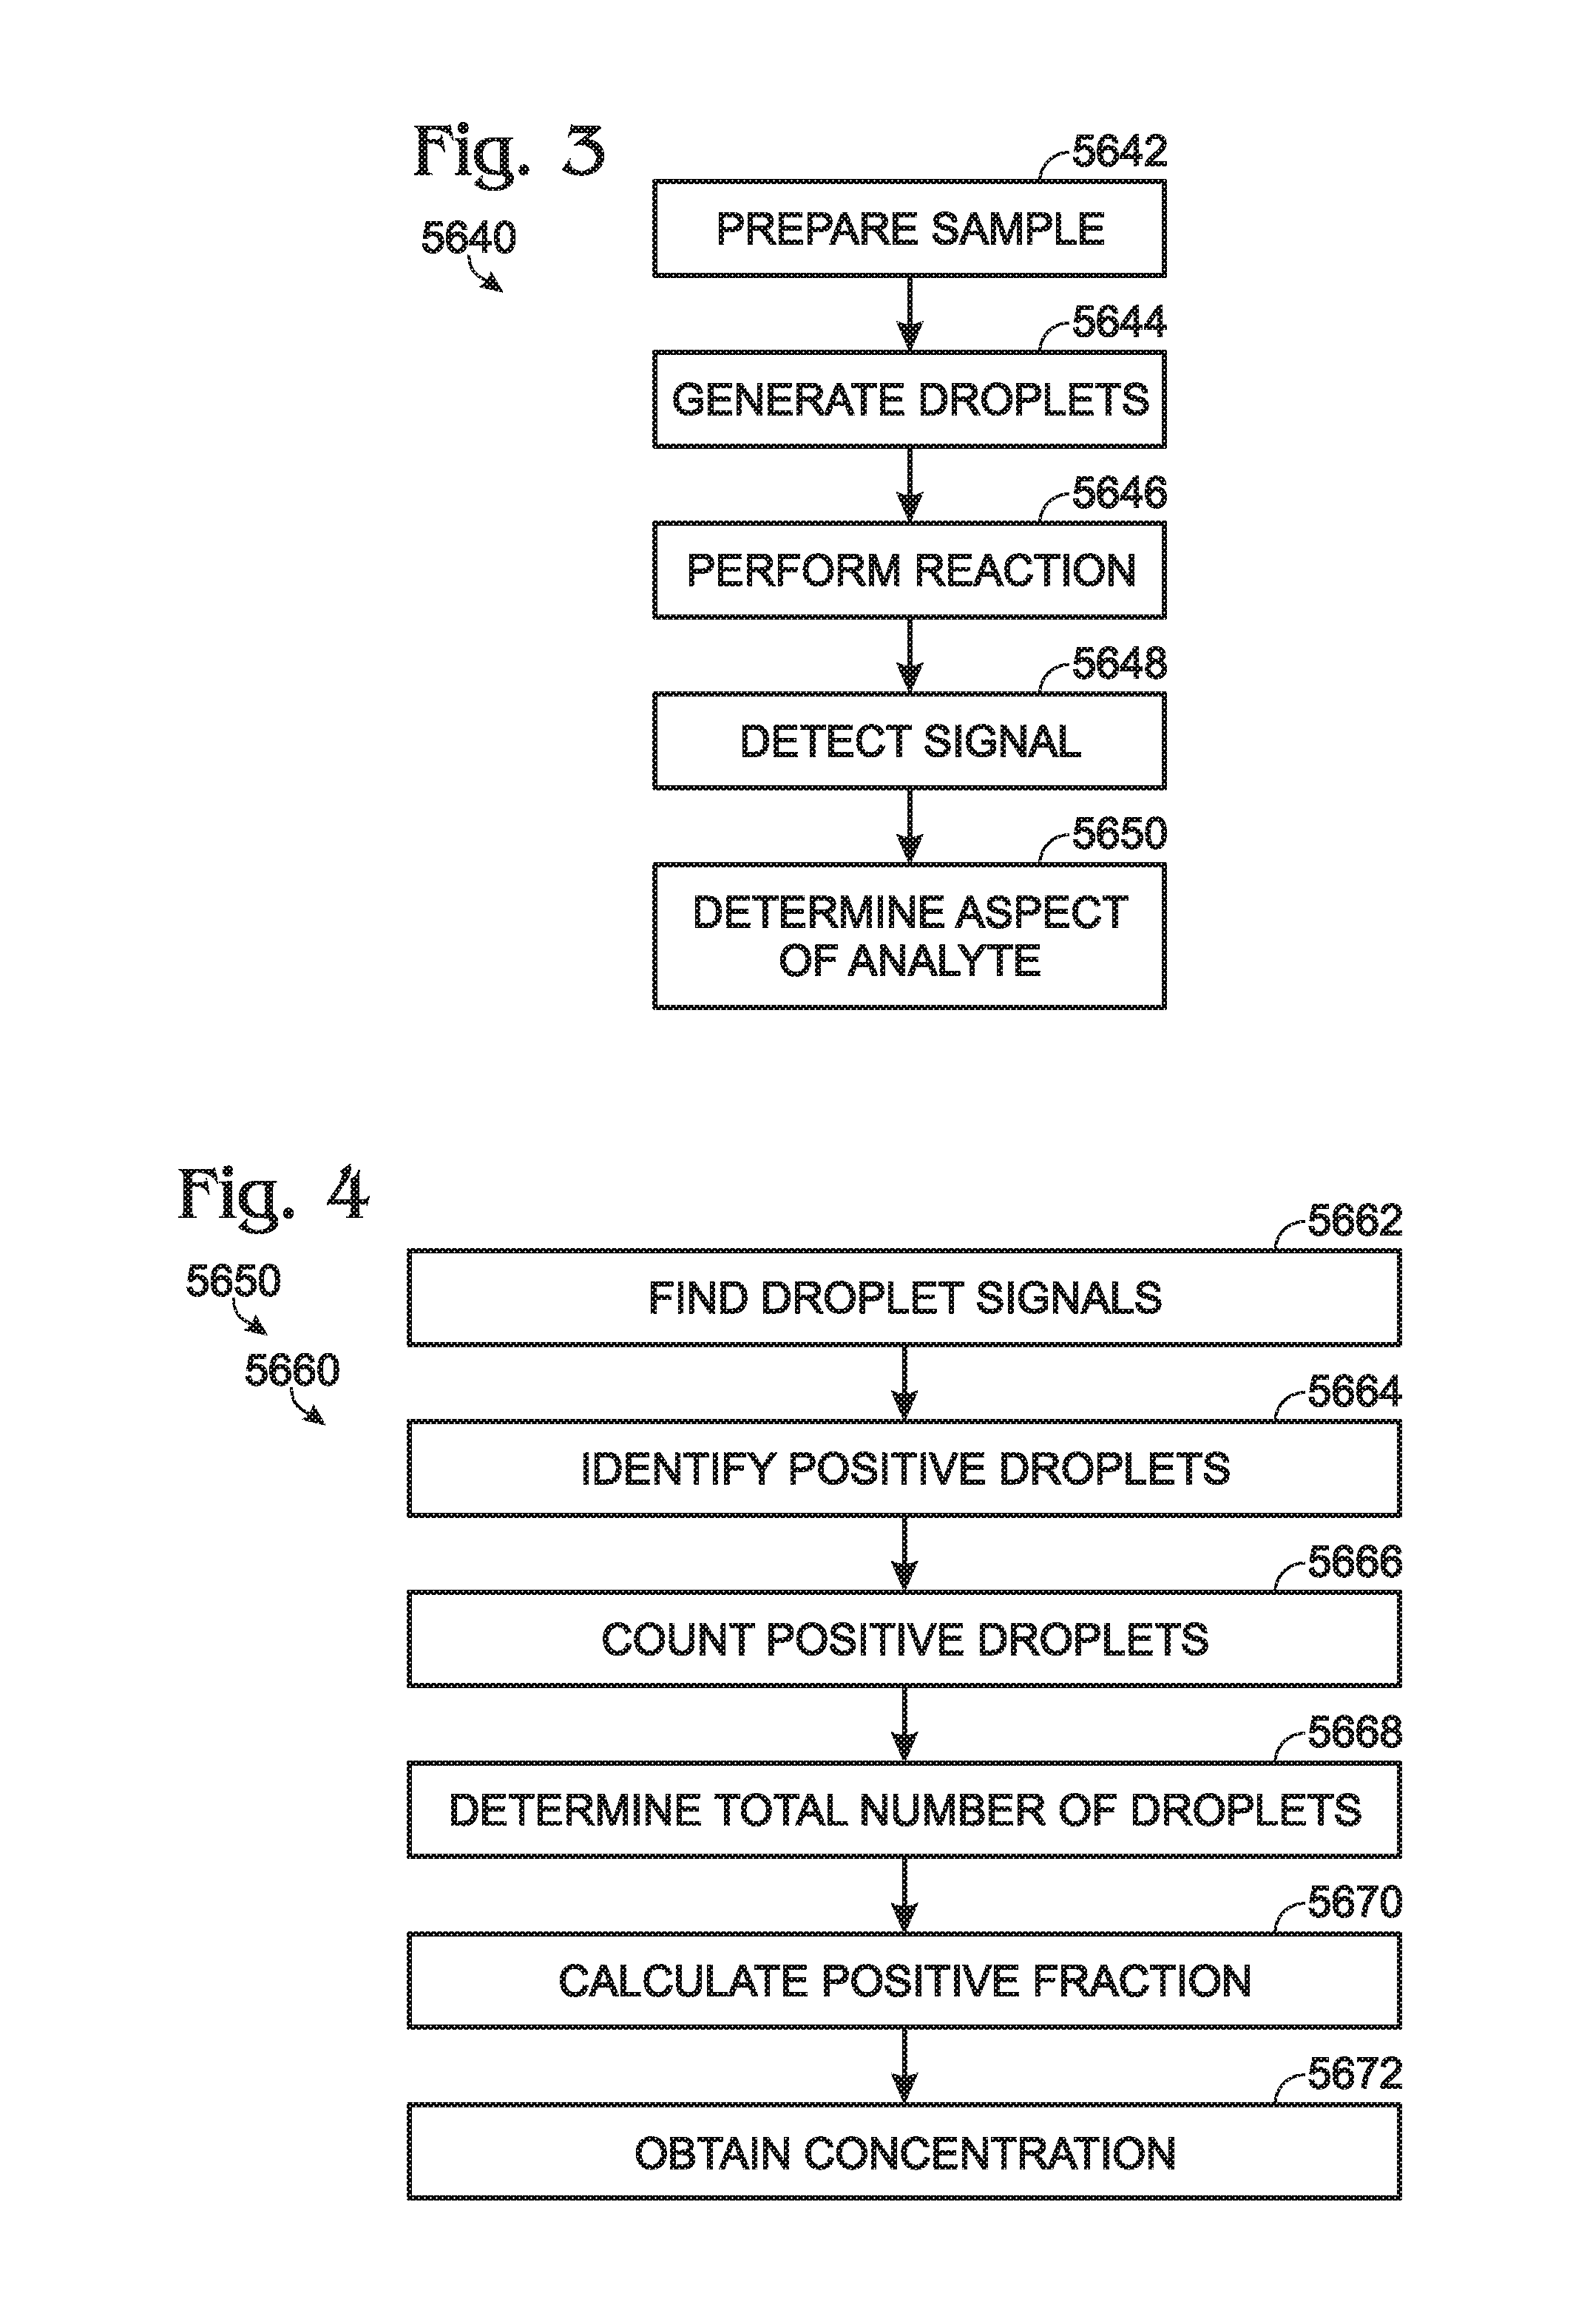
BIO RAD LAB INC
View PDF348 Cites 63 Cited by
  • Summary
  • Abstract
  • Description
  • Claims
  • Application Information

AI Technical Summary

Benefits of technology

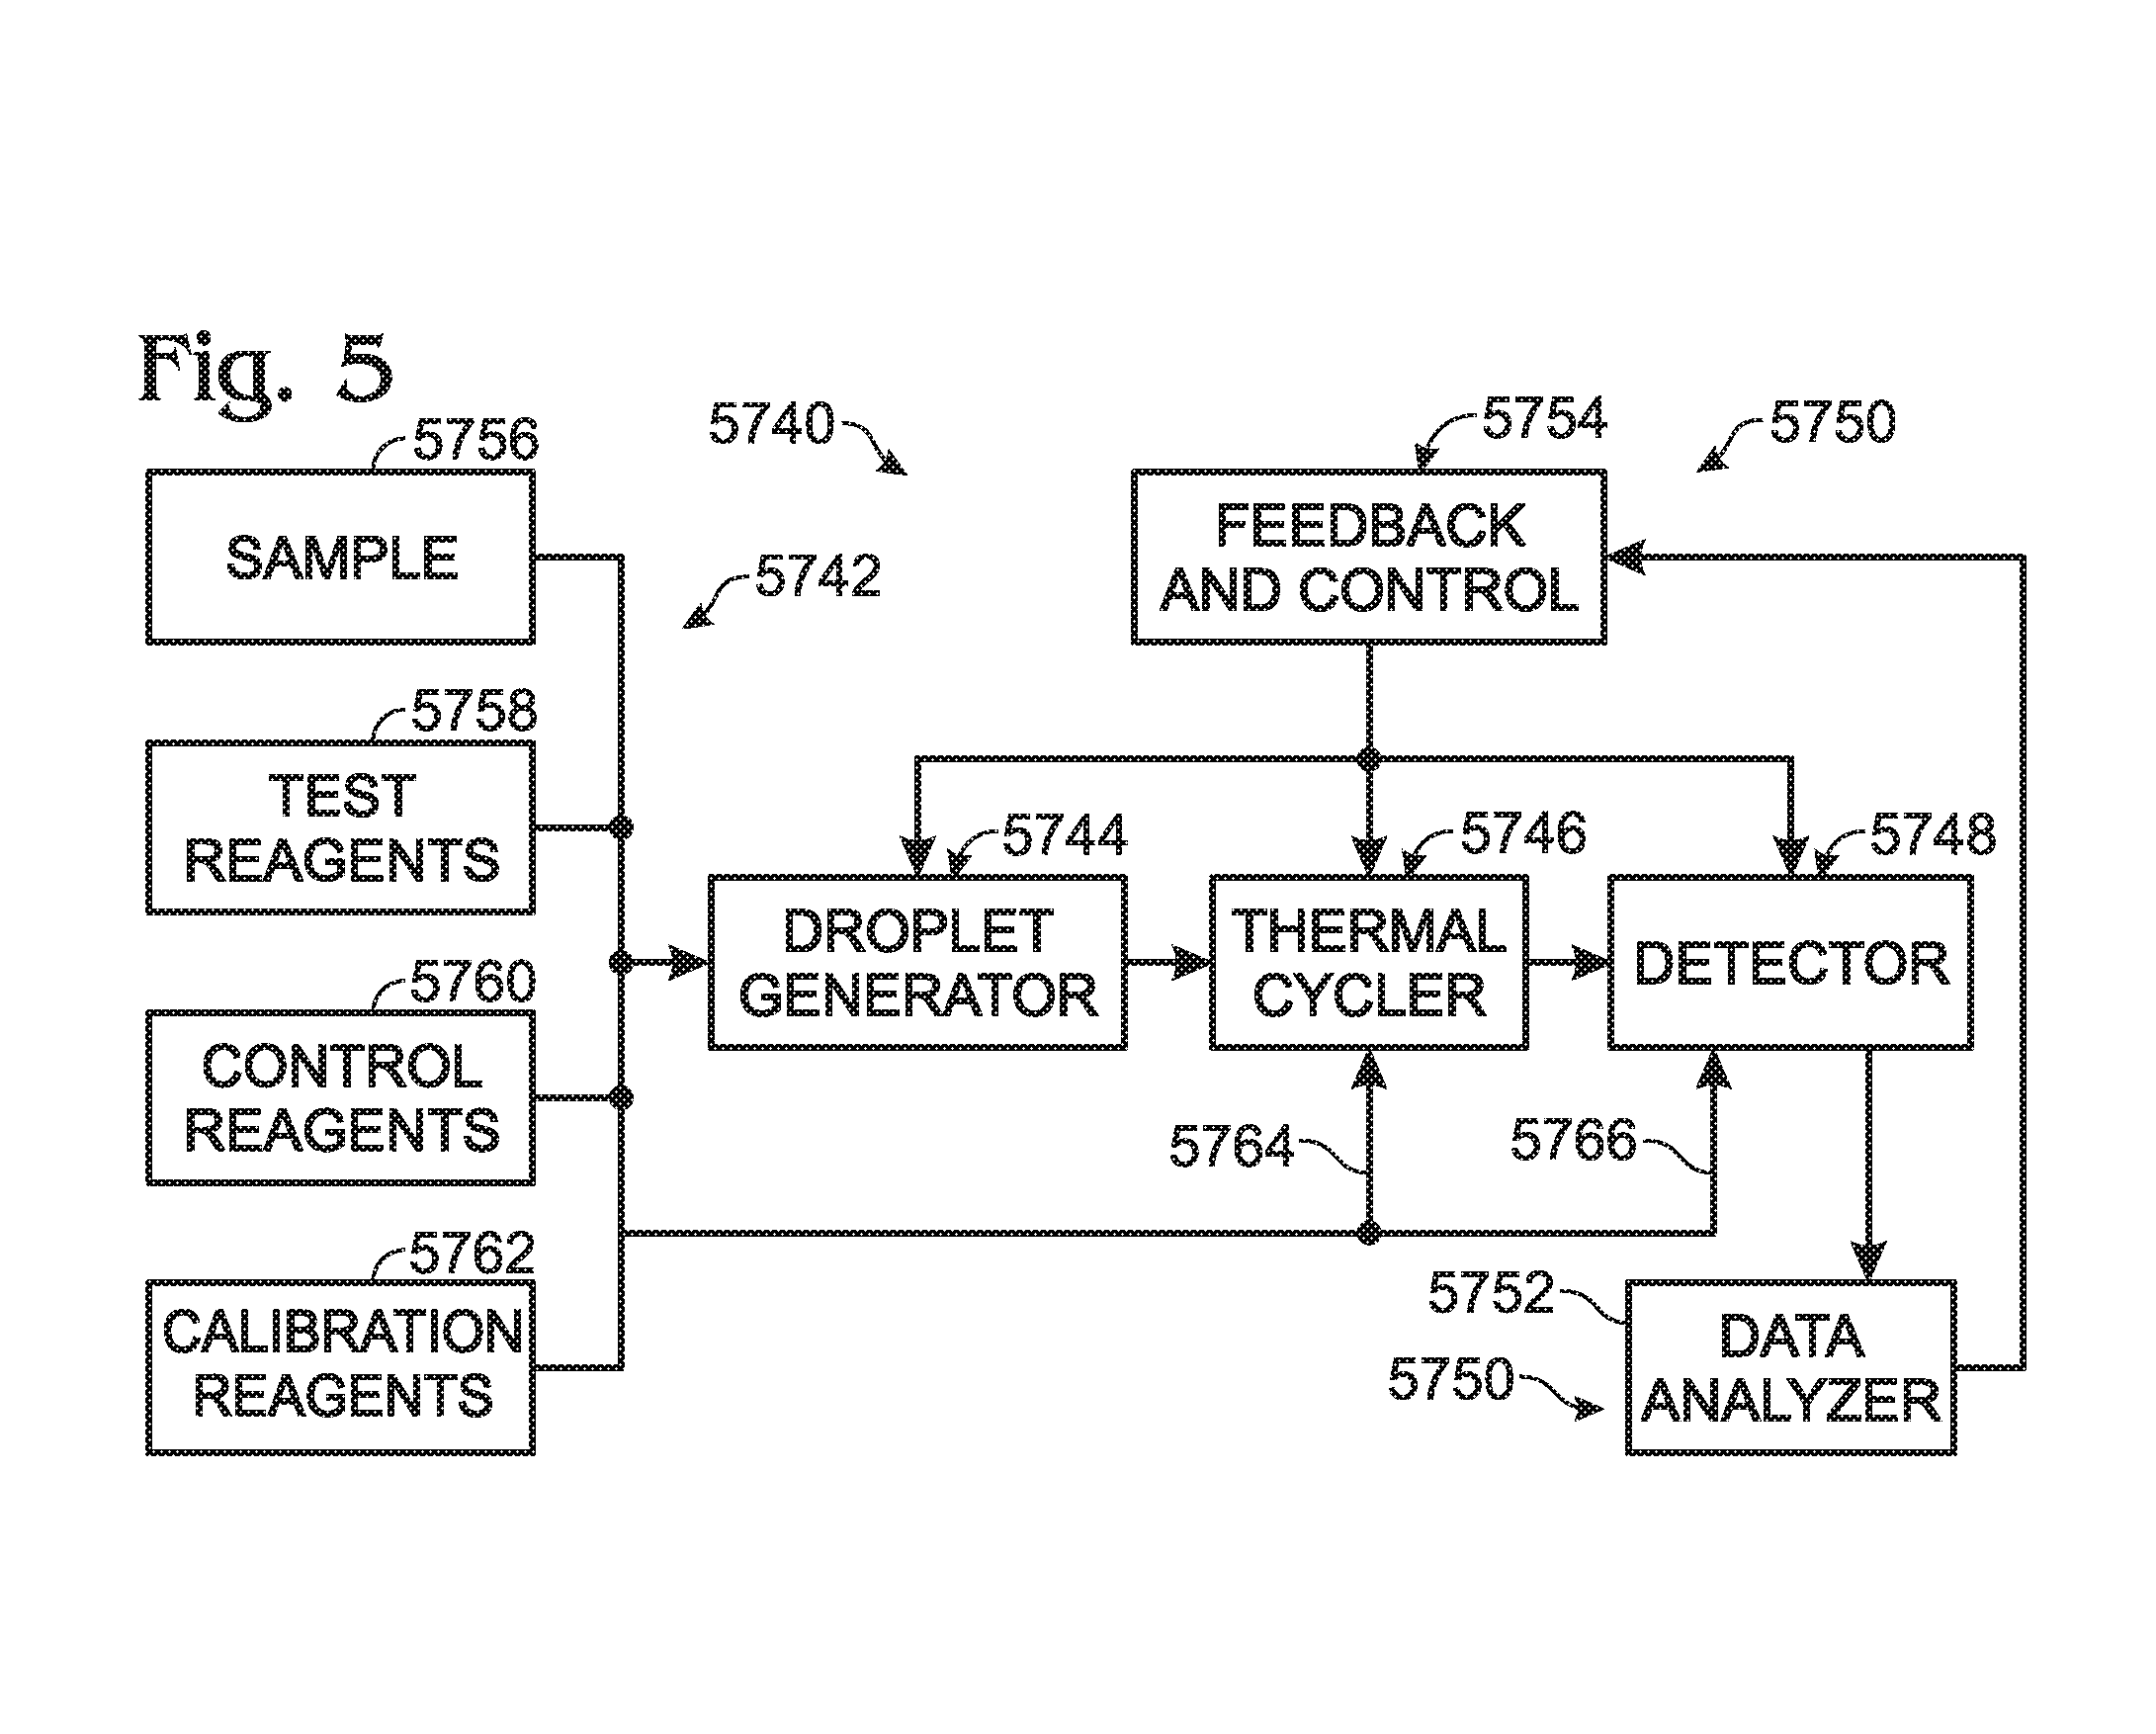
[0012]Thus, there is a need for improved accuracy and reliability in droplet-based amplification tests. For example, it would be desirable to have droplet-based controls for these tests, optionally, droplet-based controls that can be incorporated into test droplets or incorporated into control droplets that can be intermixed with test droplets. Such integrated controls may have the benefit of reducing cost by processing control reactions in parallel with test reactions, which may speed the analysis. It also would be useful to have one or more controls that can be used to verify hardware, reagent, and / or software (e.g., algorithm) performance.SUMMARY

Problems solved by technology

If inaccurate, these tests can generate erroneous results, that is, false negatives and false positives.
Each type of erroneous result can have detrimental consequences.
False negatives related to detection of a disease could mean that the disease is not treated early and is permitted to spread.
In contrast, false positives could cause unnecessary alarm, potentially triggering an unnecessary response that may be costly and disruptive.
To avoid problems associated with false negatives and false positives, inaccurate amplification tests must be repeated to improve their reliability, which increases cost and uses more sample and reagent, each of which may be precious.
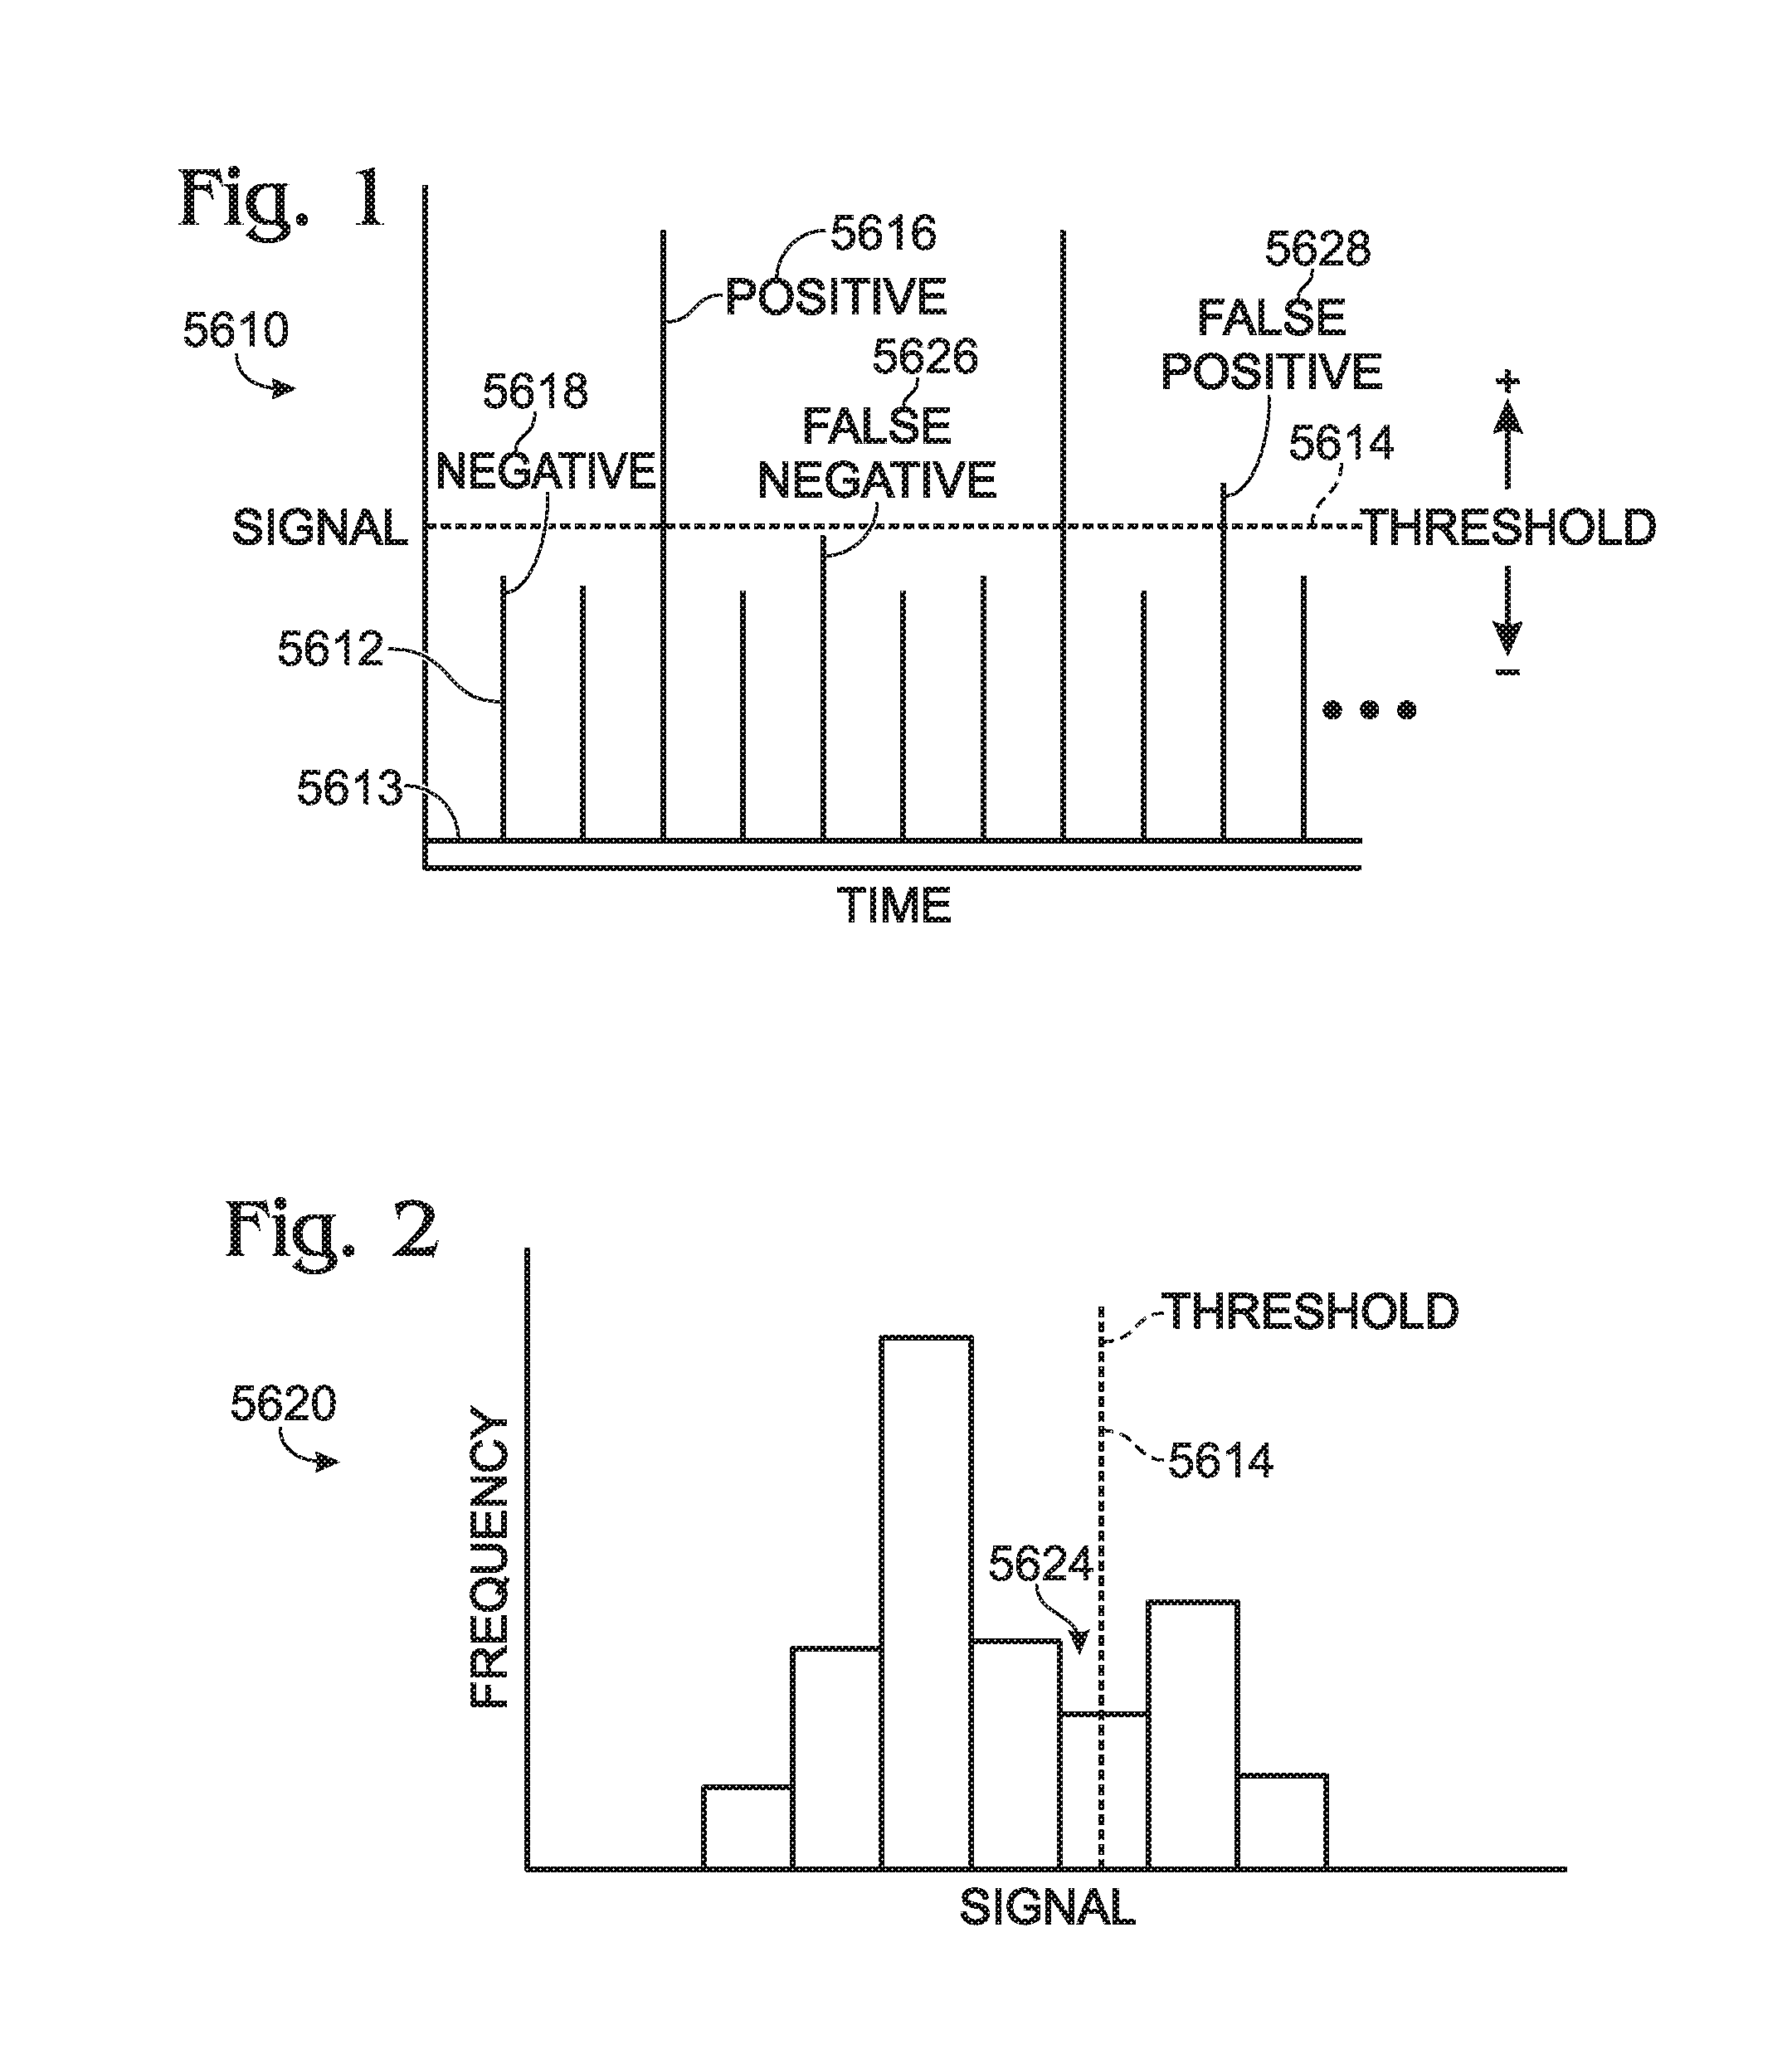
Conversely, some amplification-negative droplets may provide relatively strong droplet signals, such as false-positive signal 5628, that are greater than threshold 5614, resulting in incorrect identification of these negative droplets as positive.
Variations in these physical and chemical parameters can increase the overlap in the distribution of positive and negative droplet signals, which can complicate data interpretation and affect test performance (e.g., affect the limit of detection).

Method used


Image

  • Calibrations and controls for droplet-based assays
  • Calibrations and controls for droplet-based assays
  • Calibrations and controls for droplet-based assays

Examples


example 1

A. Example 1

Detection System 1

[0256]This example describes an optical detection system based on measuring the end-point fluorescence signal of each sample / reagent droplet after a PCR amplification process is complete. The exemplary system is suitable for making both qualitative and quantitative measurements; see FIGS. 28 and 29.

[0257]FIG. 28 depicts a cytometry-type optical detection system, generally indicated at 7200. The term “cytometry” refers to the fact that the detection system is configured to detect both scattered and fluorescence radiation. Detection system 7200 includes a radiation source 7202, transmission optics generally indicated at 7204, a forward scatter detector 7206, and a fluorescence detector 7208. The forward scatter detector may be replaced or augmented, in some embodiments, by side and / or back scatter detectors, among others, configured to detect light detected to the side or back of the sample, respectively. Similarly, the fluorescence detector may be replac...

example 2

B. Example 2

Detection Methods

[0270]This example describes a method of detecting fluorescence from sample-containing droplets that have undergone PCR thermocycling; see FIG. 30.

[0271]FIG. 30 is a flowchart depicting the steps of a fluorescence detection method, generally indicated at 7600, which may be performed in conjunction with a PCR system of DNA amplification according to the present disclosure. Although various steps of method 7600 are described below and depicted in FIG. 30, the steps need not necessarily all be performed, and in some cases may be performed in a different order than the order shown in FIG. 30.

[0272]At step 7602, sample-containing droplets are separated by a desired average distance. This may be accomplished, for example, by various flow focusing techniques such as those described above (i.e., by flow focusing the droplets as they are generated), and / or by generating droplets at a suitable rate. In cases of batch detection such as in a stop-flow system, it may...

example 3

C. Example 3

Additional Embodiments

[0279]This example describes additional aspects of sample detection, in accordance with aspects of the present disclosure, presented without limitation as a series of numbered sentences.

[0280]1. A method of detecting target molecule concentration in a sample, comprising (A) generating sample-containing droplets with a droplet generator; (B) amplifying target molecules within the droplets; (C) transferring the droplets through an intersection region where the droplets encounter radiation from a radiation source; (D) estimating the volume of each droplet based on a measurement performed as the droplet passes through the intersection region; (E) detecting fluorescence intensity emitted by each droplet; and (F) for each droplet, if the estimated volume of the droplet falls within a predetermined range then using the fluorescence intensity emitted by the droplet in a determination of target molecule concentration in the sample, and if the estimated volum...


PUM

PropertyMeasurementUnit
average volumeaaaaaaaaaa
diameteraaaaaaaaaa

Abstract

System, including methods and apparatus, for performing droplet-based assays that are controlled and / or calibrated using signals detected from droplets.

Description

CROSS-REFERENCES TO PRIORITY APPLICATIONS[0001]This application is a continuation-in-part of the following U.S. patent applications: Ser. No. 13 / 251,016, filed Sep. 30, 2011; Ser. No. 13 / 245,575, filed Sep. 26, 2011; and Ser. No. 12 / 976,827, filed Dec. 22, 2010.[0002]U.S. patent application Ser. No. 13 / 245,575, in turn, is a continuation of U.S. patent application Ser. No. 12 / 586,626, filed Sep. 23, 2009, which, in turn, is based upon and claims the benefit under 35 U.S.C. §119(e) of the following U.S. provisional patent applications: Ser. No. 61 / 194,043, filed Sep. 23, 2008; Ser. No. 61 / 206,975, filed Feb. 5, 2009; Ser. No. 61 / 271,538, filed Jul. 21, 2009; Ser. No. 61 / 275,731, filed Sep. 1, 2009; Ser. No. 61 / 277,200, filed Sep. 21, 2009; Ser. No. 61 / 277,203, filed Sep. 21, 2009; Ser. No. 61 / 277,204, filed Sep. 21, 2009; Ser. No. 61 / 277,216, filed Sep. 21, 2009; Ser. No. 61 / 277,249, filed Sep. 21, 2009; and Ser. No. 61 / 277,270, filed Sep. 22, 2009.[0003]U.S. patent application Ser. ...

Claims


Application Information

Patent Timeline
Patent Type & Authority Patents(United States)
IPC IPC(8): C12Q1/68G01N21/64
CPCG01N21/6486G01N21/6428G01N21/6456C12Q1/6848G01N2021/6441G01N2201/1242C12Q2545/101C12Q2563/107C12Q2563/159
Inventor HINDSON, BENJAMIN J.COLSTON, JR., BILLY W.NESS, KEVIN D.MASQUELIER, DONALD A.
Owner BIO RAD LAB INC
Why Eureka
Try Eureka