[0021] Embodiments of the present invention will be described in detail below in conjunction with the accompanying drawings.
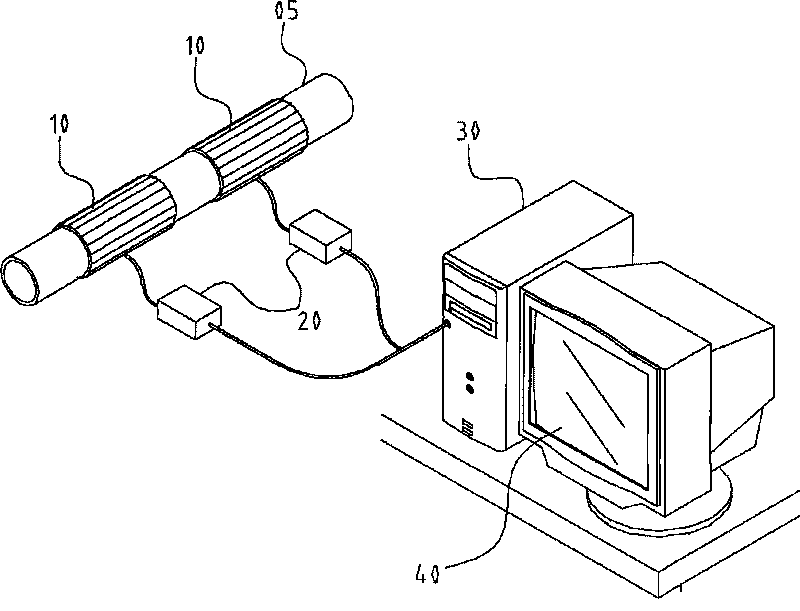
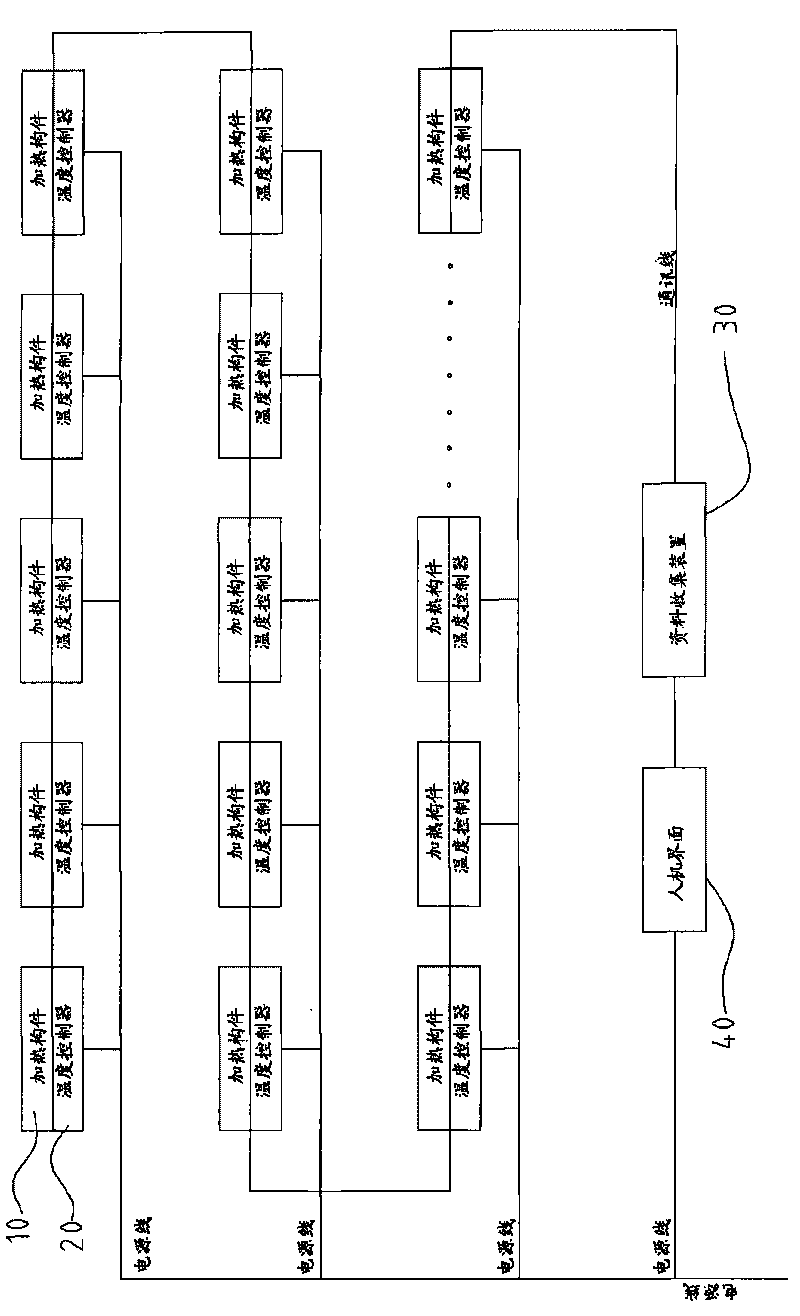
[0022] like figure 1 and figure 2 As shown, preferred embodiments of the pipeline blockage detection and early warning method of the present invention are shown, but these embodiments are for illustration purposes only, and are not limited by this structure in patent application.
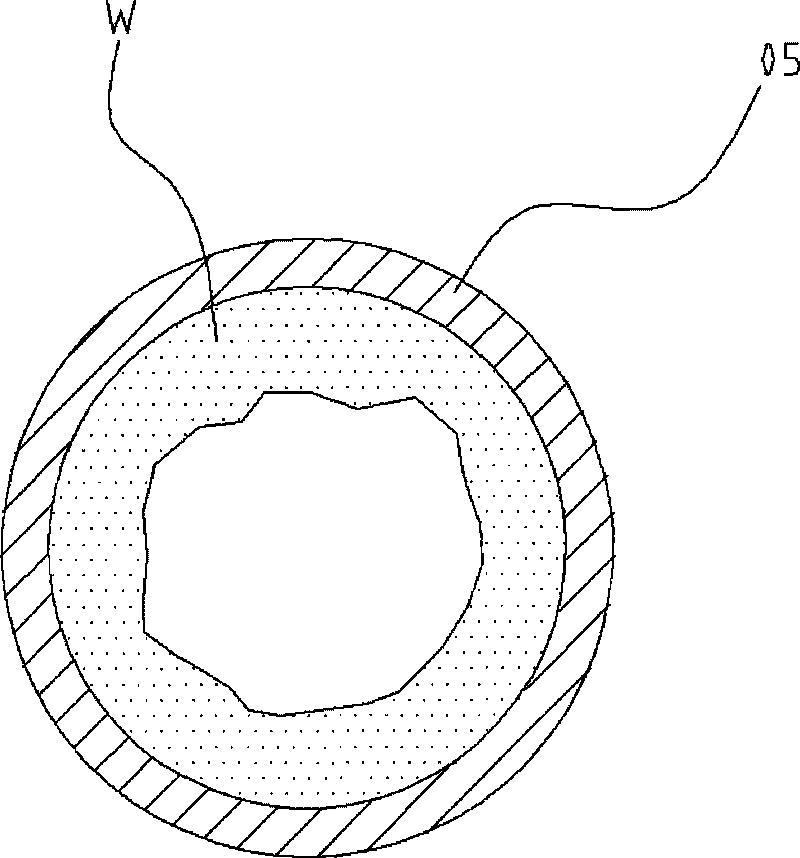
[0023] The pipeline clogging detection and early warning method provided by the present invention is used to detect the clogging state of the existing pipeline 05, so as to achieve an early warning function. The pipeline clogging detection and early warning method includes the following components in terms of its physical system :
[0024] At least one heating member 10 is assembled at a predetermined position of the pipeline 05 to be detected, so as to heat the pipeline 05. The heating member 10 can use a heating belt, so that the heating belt is wrapped on the pipeline 05 to be detected. Measure the outer circumference of the pipeline 05 to obtain a very uniform and efficient heating effect;
[0025] at least one temperature controller 20, used to control the heating frequency state of the heating member 10, and convert the heating frequency state into a signal output;
[0026] A data collection device 30, electrically connected with each of the temperature controllers 20, for collecting the temperature control signals of each of the temperature controllers 20;
[0027] A man-machine interface 40, used to visualize and present the data collected by the data collection device 30;
[0028] Both the man-machine interface 40 and the data collection device 30 can be independent two body types (such as figure 1 shown), can also be an integrated structure.
[0029] Based on the above, the pipeline blockage detection and early warning method of the present invention includes:
[0030] a. Install the heating component 10 and the temperature controller 20 at the predetermined position of the pipeline 05 to be detected, so as to use the heating component 10 to heat the pipeline 05, and further use the temperature controller 20 to control the the heating frequency of the heating member 10;
[0031] b. collecting the temperature signals of each of the temperature controllers 20 through the data collection device 30;
[0032] c. Through the man-machine interface 40, the data collected by the data collection device 30 is visualized;
[0033] Wherein, the man-machine interface 40 can display temperature change data through graphs or data;
[0034] d. During the initial operation of the pipeline 05 to be detected, a period of temperature heating change observation and data collection are carried out first, and the data is converted into a normal heating curve table;
[0035] e. The pipeline detection manager observes the temperature change state of each temperature controller 20 through the man-machine interface 40 and compares the aforementioned normal heating curve table. When the temperature changes to a relatively abnormal state, the pipeline can be known 05 is the blocking state.
[0036] Based on the above, the specific method of temperature heating change observation and data collection during the initial operation of the pipeline 05 to be detected is further explained as follows in conjunction with the drawings, as follows: image 3 As shown, the pipeline 05 to be detected is schematically blocked (W in the figure is a blockage), such as Figure 4 Shown is the schematic diagram of the unblocked state of the pipeline 05 to be detected; Figure 5 , Image 6 As shown, it is a schematic diagram of the curve table corresponding to the blocked state of the pipeline and the unblocked state of the pipeline. The curve table shows that the Y-axis takes temperature as the unit, and the X-axis takes time as the unit, and the temperature controller 20 is set as 100 degrees; when starting the normal temperature test at 10:00, first set the heating member 10 to 100 degrees, then the actual temperature value of the pipeline 05 in the blocked state (such as Figure 5 As shown in L, hereinafter referred to as L) maintains a stable situation of 100 degrees, while the heating frequency (such as Figure 5 As shown in L1, hereinafter referred to as L1), there are occasional fluctuations, but it tends to be stable; however, the actual temperature value of pipeline 05 in the unblocked state (such as Image 6 As shown in L2, hereinafter referred to as L2) maintains a stable situation of 100 degrees, while the heating frequency (such as Image 6 As shown in L3, hereinafter referred to as L 3) Occasionally fluctuates but tends to be stable, there is not much difference between the two; while the simulated heating zone is in a vacuum state at 13:30, at this time L and L2 continue to maintain a state of 100 degrees , while L1 raises the curve slightly, but L3 rises to a height by a large margin, and then stays fixed at this height without falling, which is obviously different from L1; from the curve table, it can be known that at room temperature, the two displays are almost the same, and There is no difference, but when the vacuum is started (that is, the internal temperature of the pipeline is removed), the temperature of the pipeline 05 in the blocked state is not easy to lose, so the heating times are not much different. If the vacuum is drawn, the temperature in the original pipeline 05 will be lost rapidly, resulting in the need to increase more heating frequency to reach the 100 degrees set by the pipeline 05, so that the curve table data obtained from the differential test results can be created in advance The so-called "normal heating curve table" and the corresponding curve table state when the pipeline 05 is blocked are based on the data obtained from the previous test during the detection process of the pipeline 05 in the future as a reference.
[0037] From the above simulation test results, it can be proved that the internal flow and blockage of the pipeline 05 can be quite accurate through the data collection and analysis of the temperature control state changes of the external heating member 10 and the establishment of preset data and historical data. early warning effect.
[0038] In summary, the advantages of the present invention are as follows:
[0039] The pipeline blockage detection and early warning method disclosed in the present invention can be introduced without affecting the operation of the existing system, coexist with it, and operate independently. Its composition is extremely simple and easy to integrate into the existing pipeline system. Therefore, , the present invention is convenient for those skilled in the art to implement and apply, and has good practical progress.
[0040] The above is only a specific embodiment of the present invention, but the scope of protection of the present invention is not limited thereto. Anyone skilled in the art can easily think of changes or substitutions within the technical scope disclosed in the present invention. Should be covered within the protection scope of the present invention. Therefore, the protection scope of the present invention should be based on the protection scope of the claims.