Method for generating Gantt chart based on graphics processing unit (GPU)
A Gantt and object technology, applied in the graphic application field of project planning, can solve the problems of not being able to use the Internet, not being able to see, and not being able to lock tabs, etc., to achieve better user experience, concise and beautiful interface, and fast loading display Effect
Inactive Publication Date: 2012-11-28
TIANYU SOFTWARE
View PDF3 Cites 8 Cited by
- Summary
- Abstract
- Description
- Claims
- Application Information
AI Technical Summary
Problems solved by technology
[0003] For now, the existing Gantt chart generation methods include two types based on B/S mode and C/S mode. The Gantt chart in C/S mode has certain requirements on the client's GPU, and the generation speed is slow. The system resources take up a lot and cannot be applied to the Internet, while the B/S mode Gantt chart has no restrictions on the client's GPU, the generation speed is fast, and the system resource occupation is small, but the known B/S mode Gantt charts on the market Tetu's method has the following problems:
[0005] 2. The header part of the Gantt chart and the tab part that controls whether the header and its columns are gene
Method used
View moreImage
Smart ImageViewing Examples
Examples
 PUM
 Abstract
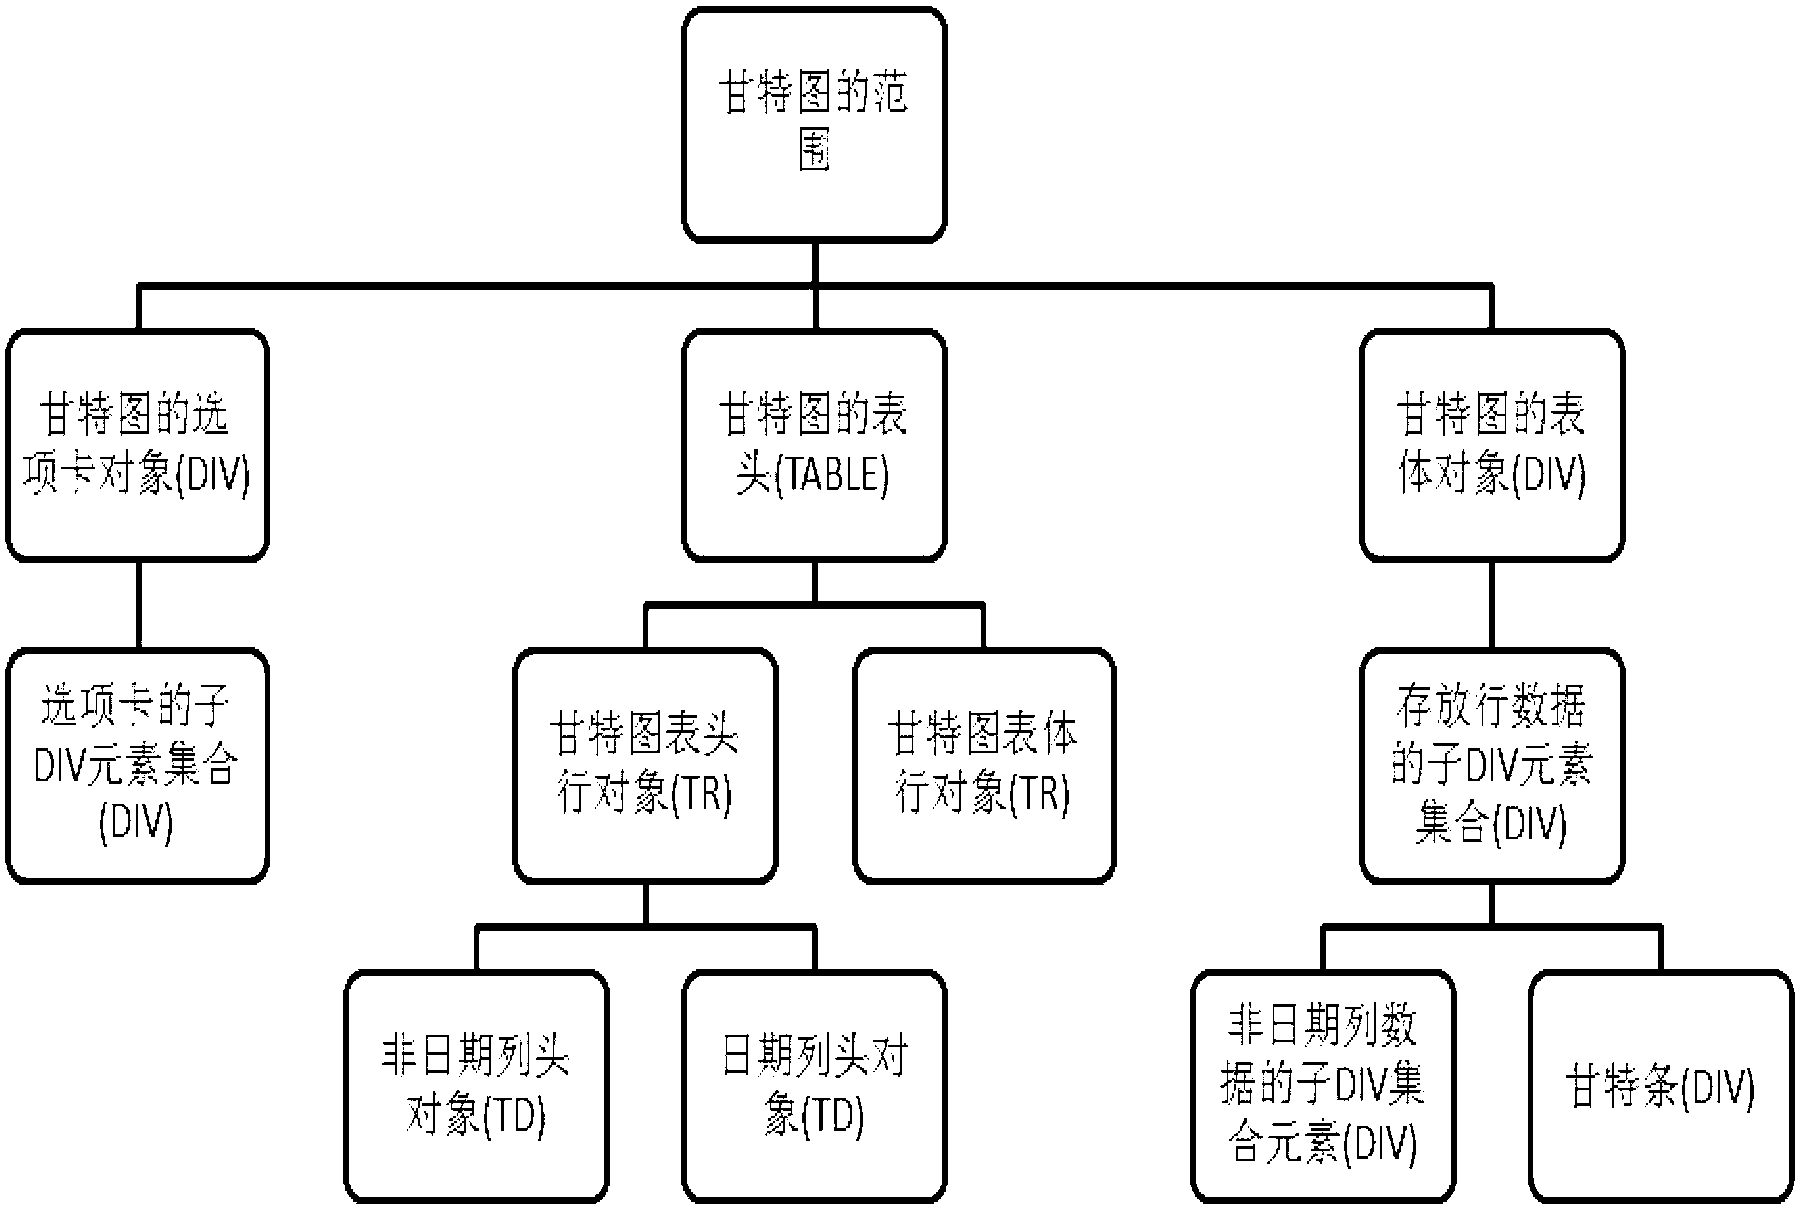
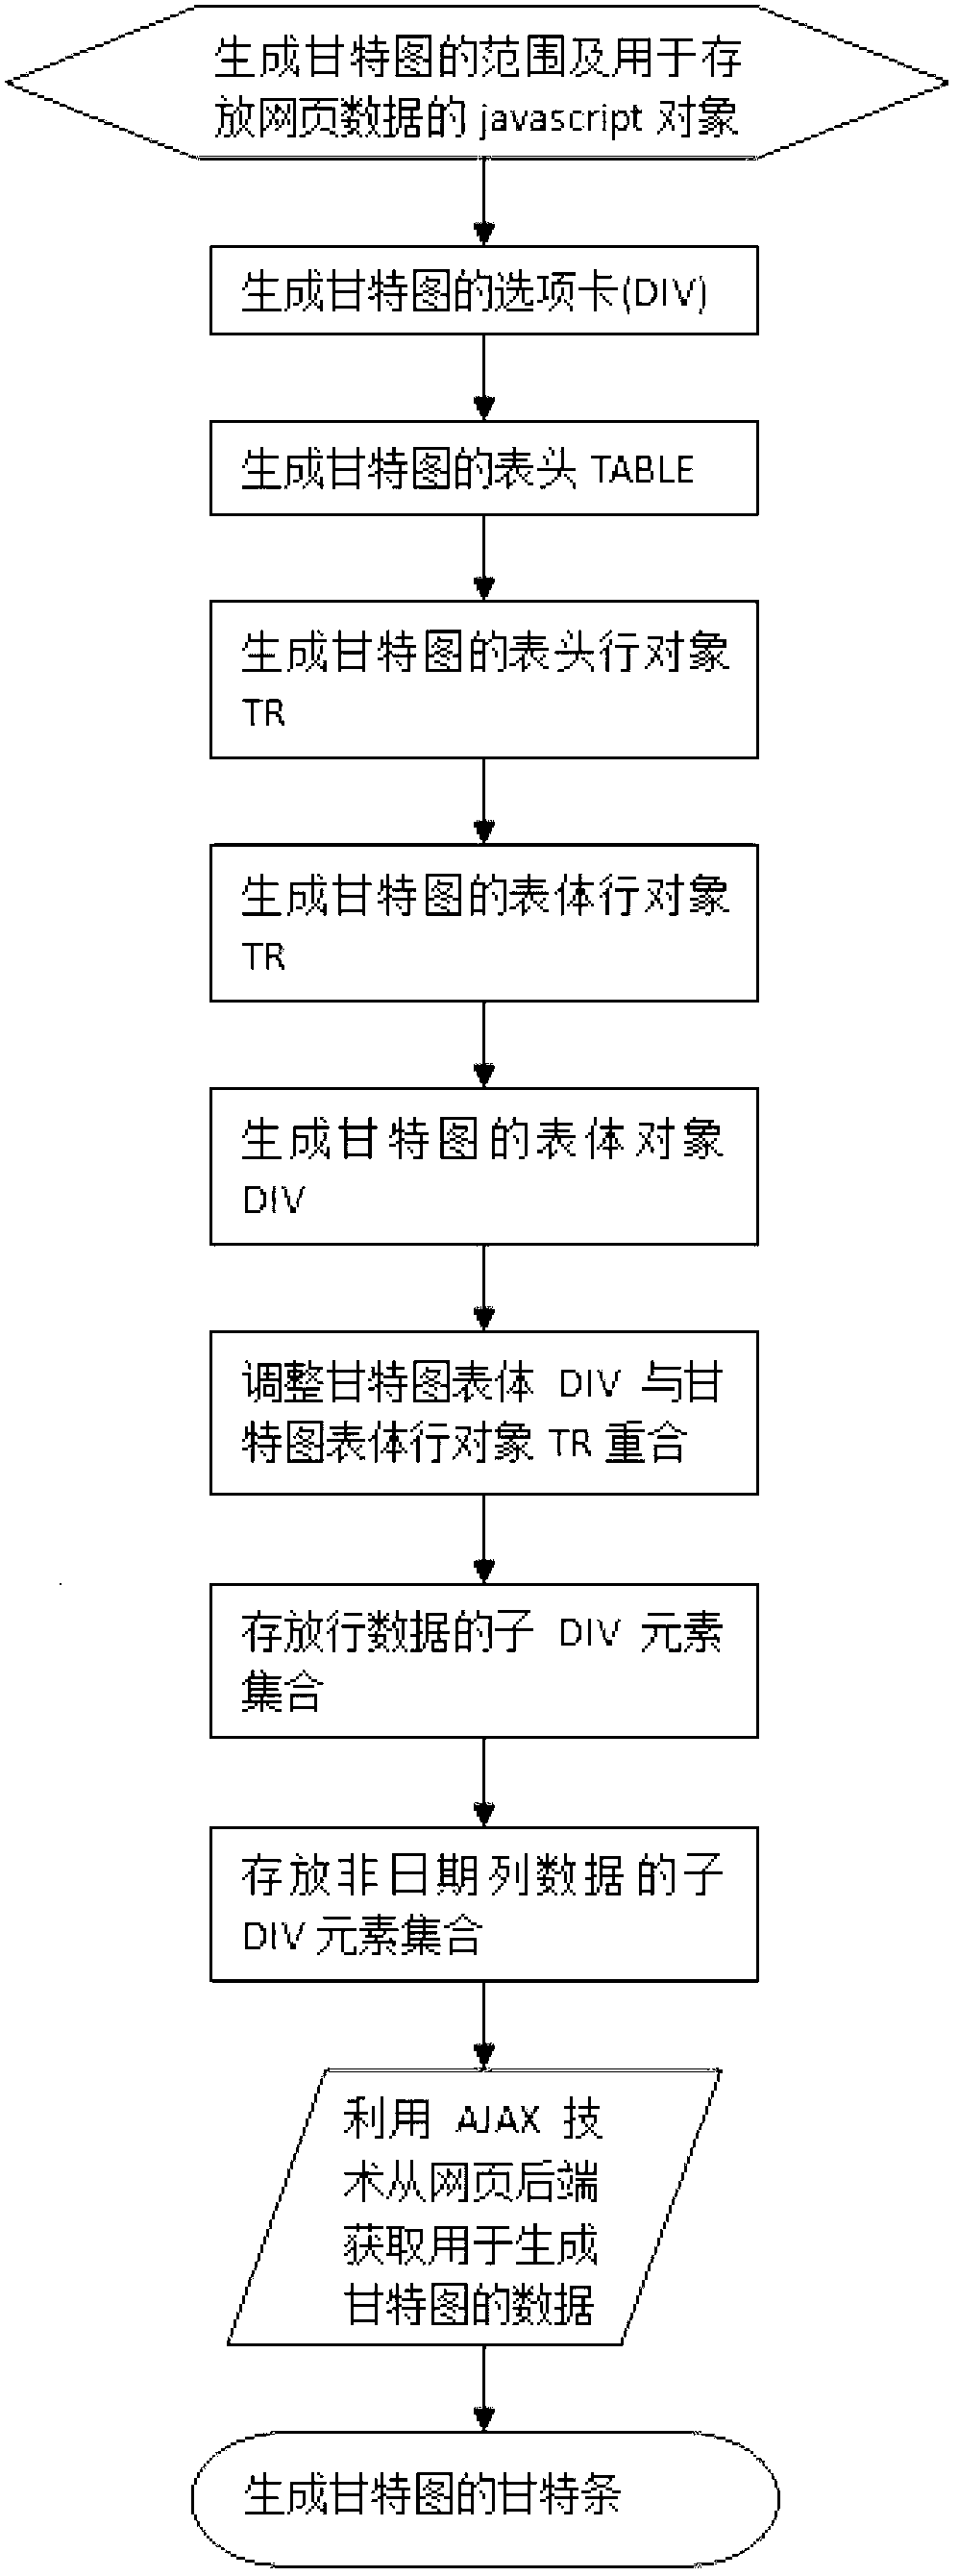
The invention discloses a method for generating a Gantt chart based on a graphics processing unit (GPU). The method comprises the following steps of: generating a range of the Gantt chart and a javascript object for storing web data by the GPU, generating a tab and a header of the Gantt chart by the GPU, generating a body of the Gantt chart by the GPU, and generating Gantt bars of the Gantt chart. By the method, related problems of linkage of rolling events of scroll bars due to separate layout are solved, the interface layout is compact and attractive, the operation is convenient, user experience comfort is high, specific filled data rows are constructed by adopting data in voice (DIV) for replacing the conventional TABLE, and step-by-step loading display of interface elements is realized; and the list part comprises a tree structure, and data of next sub-nodes are loaded according to node-by-node temporary expanded events, so that infinite step loading is realized, and even the data of the ultrahigh-volume tree structure can also be quickly loaded and displayed.
Description
Technical field [0001] The present invention belongs to the graphics application field of project planning, and more specifically, relates to a method for generating Gantt charts based on GPU. Background technique [0002] Gantt chart is an effective tool for construction schedule and task control for engineering projects. For the management of large-scale engineering projects, it is a complex and arduous system engineering. Communication and coordination are difficult, and a large amount of information needs effective management; however, the use of Gantt chart technology can intuitively and accurately display and adjust The data of each task in the engineering project, and the results can be calculated in a graphical manner, which is convenient for users to use, and effectively controls and manages the entire project. [0003] For now, the existing Gantt chart generation methods include two types based on B / S mode and C / S mode. The Gantt chart in C / S mode has certain requirement...
Claims
Login to View More Application Information
Patent Timeline
 IPC IPC(8): G06F9/44
Inventor 熊一粟
Owner TIANYU SOFTWARE
Features
- R&D
- Intellectual Property
- Life Sciences
- Materials
- Tech Scout
- Unparalleled Data Quality
- Higher Quality Content
- 60% Fewer Hallucinations
Learn More Browse by: Latest US Patents, China's latest patents, Technical Efficacy Thesaurus, Application Domain, Technology Topic, Popular Technical Reports.
© 2025 PatSnap. All rights reserved.Legal|Privacy policy|Modern Slavery Act Transparency Statement|Sitemap|About US| Contact US: help@patsnap.com


