Visualization method for multivariable spatio-temporal data under polar region projection mode

A spatiotemporal data, projection mode technology, applied in the computer field, can solve problems such as the inability to maintain continuity and integrity, efficient, real-time, and interactive visualization methods are rare, and the distribution of variables cannot be effectively observed and analyzed.

Inactive Publication Date: 2012-12-19
TSINGHUA UNIV
View PDF3 Cites 16 Cited by
  • Summary
  • Abstract
  • Description
  • Claims
  • Application Information

AI Technical Summary

Problems solved by technology

Since the shapes of the South and North Pole regions change greatly in the two-dimensional latitude and longitude space and cannot maintain continuity and integrity, it is not effective to directly visualize the physical quantities of sea ice or atmospheric motion in the polar regions simulated by the model in the two-dimensional longitude and latitude space. Observing and analyzing the distribution of variables over polar regions
[0003] At present, there are a large number of methods and systems that can support the visualization of multivariate spatiotemporal data in two-dimensional orthogonal latitude and longitude space, but in the polar projection mode, efficient, real-time, interactive visualization methods are still rare
Traditional geoscience visualization tools that support two-dimensional display space, such as NCL and GrADS, do not support parallel control, and can only be controlled through scripts, and cannot directly interact in the display window
Interactive software systems that support large-scale data visualization, such as VisIt and Paraview, transform the two-dimensional longitude and latitude coordinate space into the three-dimensional spherical coordinate space, and then use the method of transforming the orthographic projection into the polar projection space, although the continuity and stability of the polar region are guaranteed. Integrity, but the transformation process has a large amount of calculation, real-time and interactive performance are far from enough, and the supported projection methods are relatively limited

Method used


Image

  • Visualization method for multivariable spatio-temporal data under polar region projection mode
  • Visualization method for multivariable spatio-temporal data under polar region projection mode
  • Visualization method for multivariable spatio-temporal data under polar region projection mode

Examples


Embodiment Construction

[0021] Embodiments of the present invention are described in detail below, and examples of the embodiments are shown in the drawings, wherein the same or similar reference numerals denote the same or similar elements or elements having the same or similar functions throughout. The embodiments described below by referring to the figures are exemplary only for explaining the present invention and should not be construed as limiting the present invention.

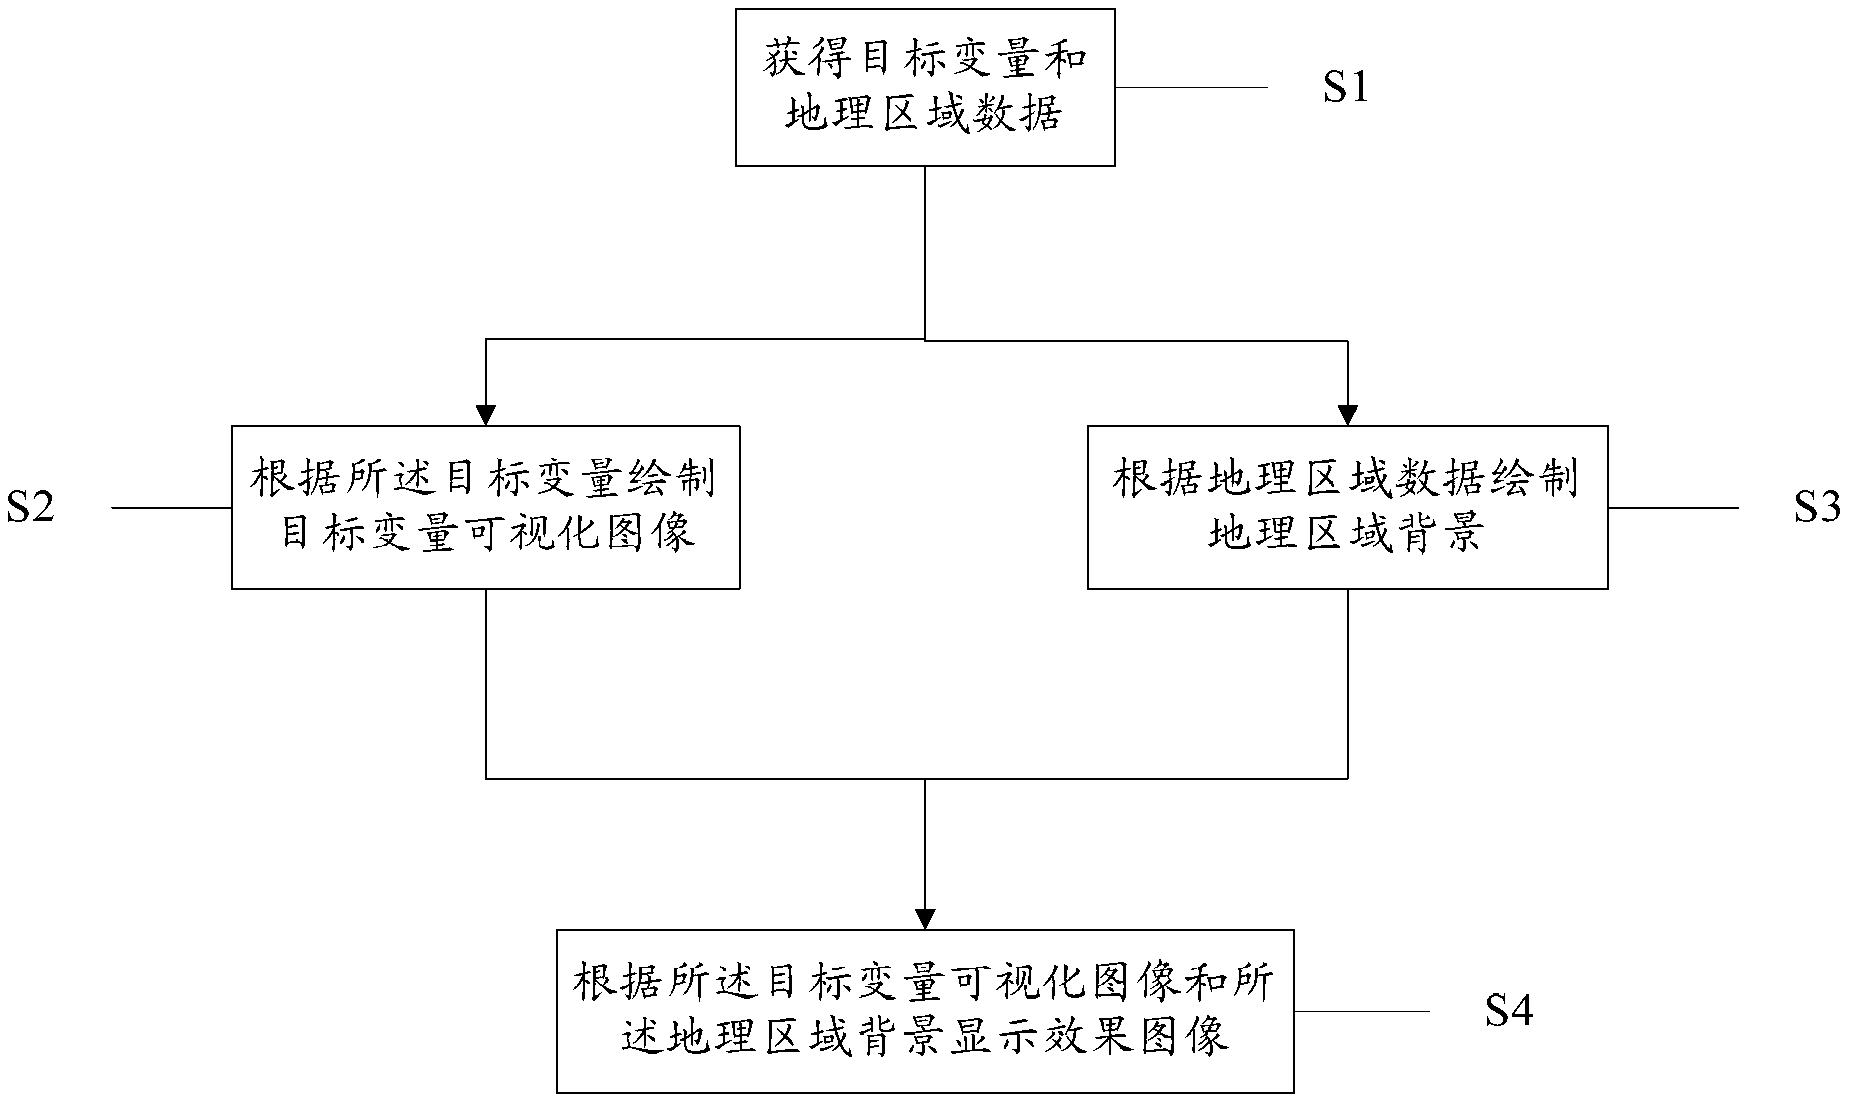
[0022] Such as figure 1 As shown, a visualization method for multivariate spatiotemporal data in a polar projection mode according to an embodiment of the present invention includes the following steps:

[0023] S1, Obtain target variable and geographic area data. In an embodiment of the present invention, the target variable can be a scalar or a vector.

[0024] S2, draw a target variable visualization image according to the target variable. In one embodiment of the present invention, according to the target variable, the ...


PUM


Abstract

The invention provides a visualization method for multivariable spatio-temporal data under a polar region projection mode. The visualization method comprises the following steps of: obtaining an objective variable and geographic region data; drawing an objective variable visualization image according to the objective variable; drawing a geographic region background according to geographic region data; and displaying an effect image according to the objective variable visualization image and the geographic region background. According to the method of the embodiment of the invention, three polar region projection conversion methods from a two-dimensional orthogonal longitude and latitude space to a two-dimensional polar region projection space are realized, a uniform vector representation mode and a drawing method in the two-dimensional orthogonal longitude and latitude space and the two-dimensional polar region projection space are supported, and auxiliary positioning information of the geographic region background is provided, therefore, the problem that polar regions in the two-dimensional orthogonal longitude and latitude space are discontinuous is overcome for a user, and the distribution situations of variables in polar regions can be observed and compared efficiently and interactively in real time.

Description

technical field [0001] The invention relates to the field of computer technology, in particular to a visualization method for multivariate spatio-temporal data in a polar projection mode. Background technique [0002] The Earth System Model is an important tool for studying global climate change. By dividing the Earth’s surface into grids at certain intervals in the two-dimensional orthogonal latitude and longitude space in the horizontal direction, the earth’s layers (mainly the atmosphere) are divided in the vertical direction. , ocean, sea ice, and land surface) are layered according to different height intervals, and then the numerical simulation dynamic framework and parameterization scheme of different circles are constructed and programmed, and then the numerical simulation is performed on a high-performance computer. Since the shapes of the South and North Pole regions change greatly in the two-dimensional latitude and longitude space and cannot maintain continuity a...

Claims


Application Information

Patent Timeline
Patent Type & Authority Applications(China)
IPC IPC(8): G06T11/00
Inventor 邓俊辉袁国栋邹衡
Owner TSINGHUA UNIV
Why Eureka
Try Eureka