Method of producing voltage deviation accuracy detection waveform
A technology for detecting waveform and voltage deviation, which is applied in the field of power quality index detection, and can solve the problems that the accuracy of voltage deviation does not meet the standard requirements.
- Summary
- Abstract
- Description
- Claims
- Application Information
AI Technical Summary
Problems solved by technology
Method used
Image
Examples
Embodiment 1
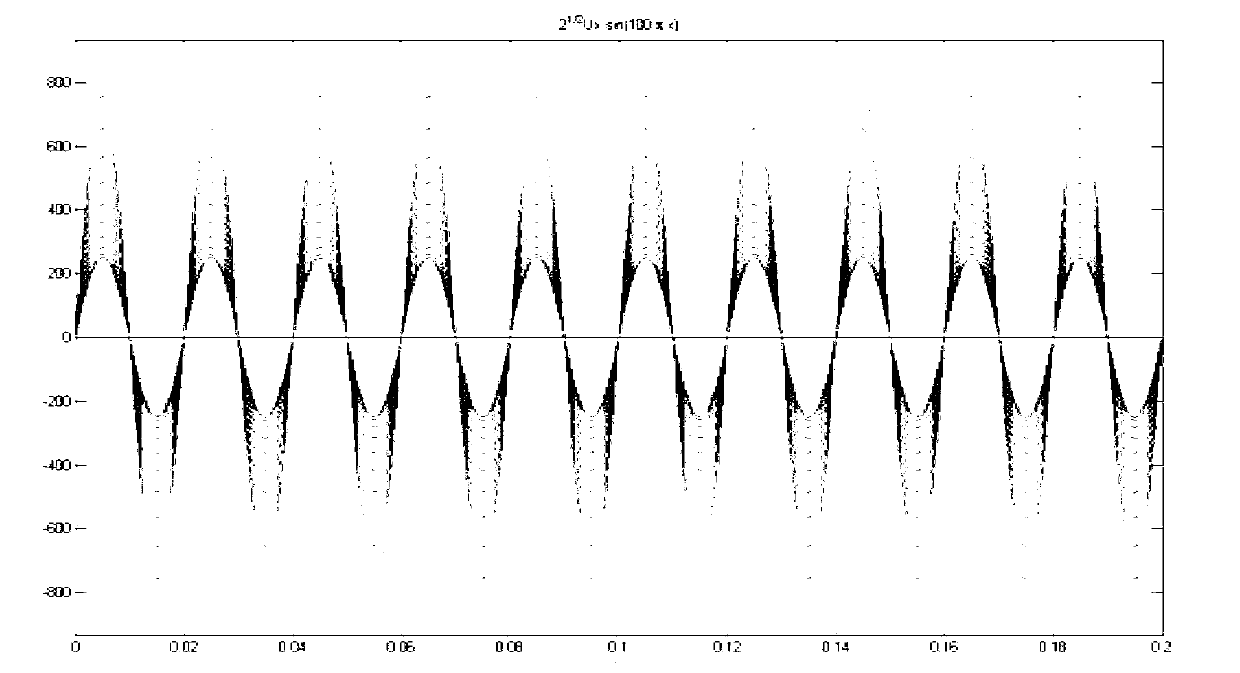
[0030] Embodiment 1, in this example, the nominal voltage U N =220V, a set of detection waveforms is set as: the effective value of the basic waveform is U 1 =0; mark waveform f x =50Hz, U x Value range: 176V≤U x ≤264V, interval ΔU between adjacent waveform voltage RMS x = 8V, U x They are: 176, 184, 192, 200, 208, 216, 224, 232, 240, 248, 256. in figure 1 Draw the waveform group corresponding to the above valid values.
Embodiment 2
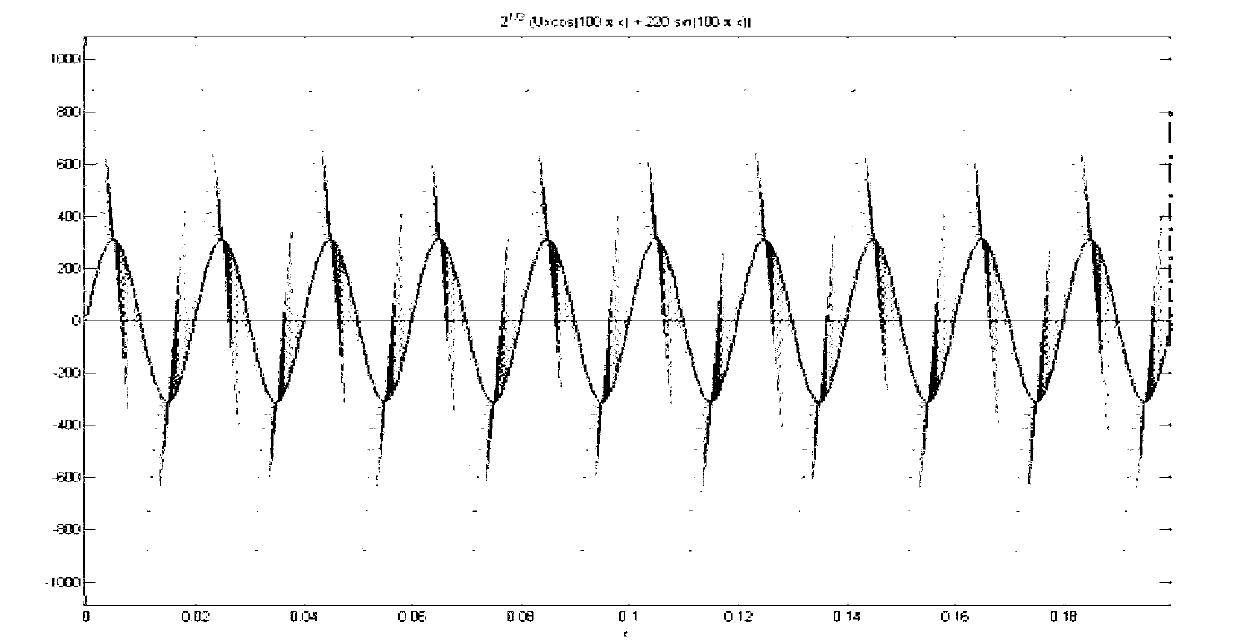
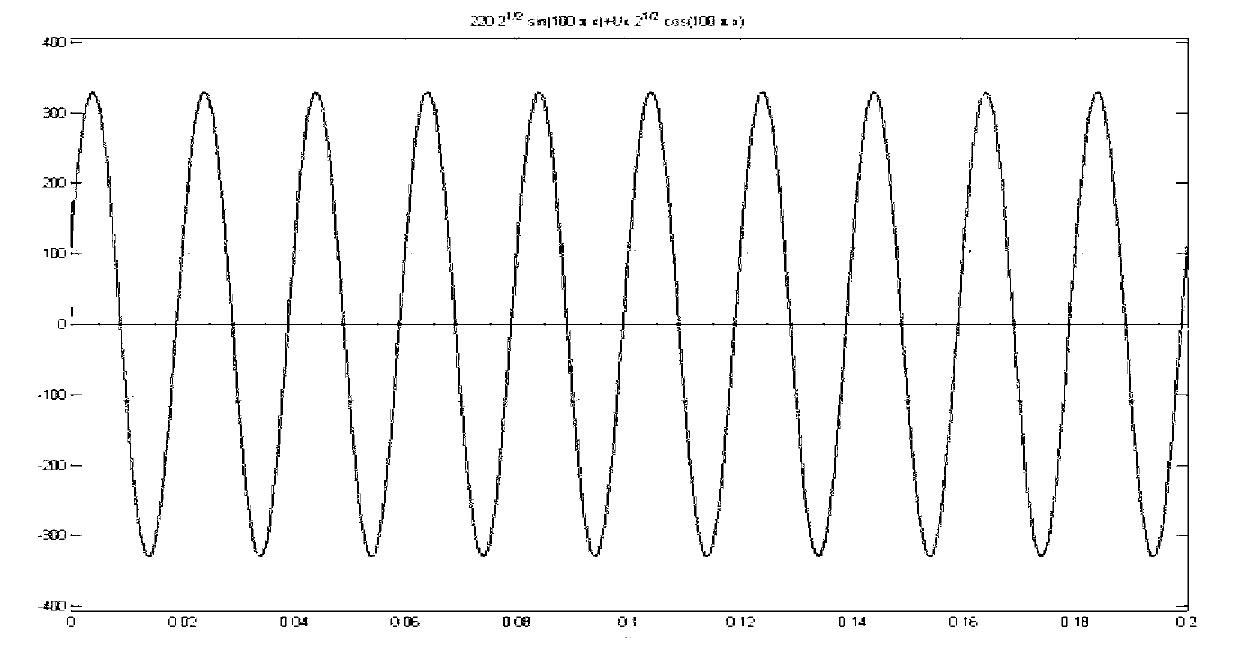
[0031] Embodiment 2, in this example, a set of detection waveforms is set as: the effective value U of the basic waveform 1 =U N =220V, the frequency is f=50Hz; the marked waveform Mark the frequency f of the waveform x =50Hz, U x Value range: 0≤U x ≤145, the interval between adjacent waveform voltage RMS values is ΔU x =13V, choose U discretely and evenly x value, U x The values are 0, 13, 26, 39, 52, 65, 78, 91; 104, 117, 130 respectively. in figure 2 is the detection waveform group corresponding to the effective value of the above-mentioned marked waveform, image 3 is drawn separately figure 2 U in x =78V detection waveform, including basic waveform and marker waveform, the dotted line in the figure is the fundamental wave, the thin solid line is the marker waveform, and the thick solid line is the detection waveform.
Embodiment 3
[0032] Embodiment 3, in this example, a set of detection waveforms is set as: the effective value U of the basic waveform 1 =0; mark waveform u x =220V, frequency f x The range satisfies: 0x ≤575Hz, discrete uniform selection of f x , select the frequency interval Δf between adjacent waveforms x =5Hz, the selected first marker waveform frequency is f x0 =75Hz, the selected frequency values are: 75, 80, 85, 90, 95, 100, 105, 110, 115, 120. Figure 4 Indicates the effective value of the basic waveform U 1 =0 and mark waveform u x =220V, f x is a set of sinusoidal waveforms containing the above values.
PUM
 Abstract
Description
Claims
Application Information
 - R&D
- Intellectual Property
- Life Sciences
- Materials
- Tech Scout
- Unparalleled Data Quality
- Higher Quality Content
- 60% Fewer Hallucinations
Browse by: Latest US Patents, China's latest patents, Technical Efficacy Thesaurus, Application Domain, Technology Topic, Popular Technical Reports.
© 2025 PatSnap. All rights reserved.Legal|Privacy policy|Modern Slavery Act Transparency Statement|Sitemap|About US| Contact US: help@patsnap.com


