Method for identifying lithology of whole well section

A technology for lithology identification and whole well section, applied in earthwork drilling, wellbore/well components, etc., can solve the problems of coarse interpretation results, poor accuracy of identification results, poor pertinence, etc., achieving a high degree of automation, accurate and reliable methods Effect

Active Publication Date: 2014-05-07
CHINA NAT OFFSHORE OIL CORP +1
5 Cites 19 Cited by

AI-Extracted Technical Summary

Problems solved by technology

The purpose of the conventional logging data interpretation method is mainly to determine the shale content of the formation. The interpretation results are only two lithologies of sandstone and mudstone. The interpretation results are too coarse to reflect the geological heterogeneity; It is common, but the representativeness of the original sample data and the comprehensiveness of the indicators affecting the lithology category are relatively high, and the pertinence is poor. Due to the influence of fluid properties and other factors, the reliability is also poor, ...

Method used

Fig. 1 a is GR-DT intersect diagram, promptly take GR as abscissa scale, take DT as ordinate scale, the lithology sample through naming in table 1 is scaled in intersect diagram, as can be seen, the same rock The sample points with different particle sizes are concentrated in the GR-DT intersection map, and the lithology of different particle sizes is distributed in different areas of the cross map, showing that the particle size is from fine to coarse (from fine to coarse: siltstone, fine sandstone, Medium-coarse sandstone, coarse sandstone, pebble-containing coarse sandstone, and glutenite) GR gradually decreases, while DT gradually increases, showing obvious regularity. This figure shows that GR and DT have a good correlation with lithological grain size. Fig. 1b is the GR-RHOZ intersection diagram, that is, GR is the abscissa scale and RHOZ is the ordinate scale, and the named lithology samples in Table 1 are scaled in the intersection diagram. It can be seen that the samples of the same lithology The points are concentrated in the GR-RHOZ crossplot, and the lithology of different particle sizes is distributed in different areas of the crossplot, showing that the particle size ranges from fine to coarse (the order from fine to coarse is: siltstone, fine sandstone, medium-coarse Sandstone, coarse sandstone, pebble-bearing coarse sandstone, glutenite) GR and RHOZ all gradually decrease, showing obvious regularity. This figure shows that GR and RHOZ have a good correlation with lithological gr...

Abstract

The invention relates to a method for identifying the lithology of a whole well section. The method comprises the steps of taking out multiple rock core samples from multiple deep positions, and determining the granularity data and the lithology type of each rock core sample; determining the values of multiple types of well logging parameters of the multiple deep positions, and selecting N types of well logging parameters which are increased or decreased with increase in the granularity of the rock core samples, wherein N is more than or equal to 2; according to the lithology types of rock core sample points in the multiple deep positions and the values of N types of characteristic parameters, determining a corresponding relationship between each N-dimensional cell and the lithology type in the N-dimensional space of characteristic parameter coordinates; according to the values of the characteristic parameters and the corresponding relationship of each deep position within the whole well section, determining the representative lithology type of each deep position. According to the method, the advantages of a traditional geological analysis method and a method for identifying the lithology types through logging process are incorporated; the established interactive multi-dimension histogram lithology identification is correct and reliable, particularly applicable for use in the case of fewer rock core data.

Application Domain

Borehole/well accessories

Technology Topic

Multiple dimensionHistogram +6

Image

  • Method for identifying lithology of whole well section
  • Method for identifying lithology of whole well section
  • Method for identifying lithology of whole well section

Examples

  • Experimental program(1)

Example Embodiment

[0036] In order to make the purpose, technical solutions, and beneficial effects of the present invention clearer, the embodiments of the present invention will be described below in conjunction with the accompanying drawings. It should be noted that, in the case of no conflict, the embodiments and the embodiments in the present application The features in can be combined with each other arbitrarily.
[0037] A lithology identification method for the entire well section, including:
[0038] Take multiple core samples from multiple depth positions, determine the particle size data and lithology type of each core sample;
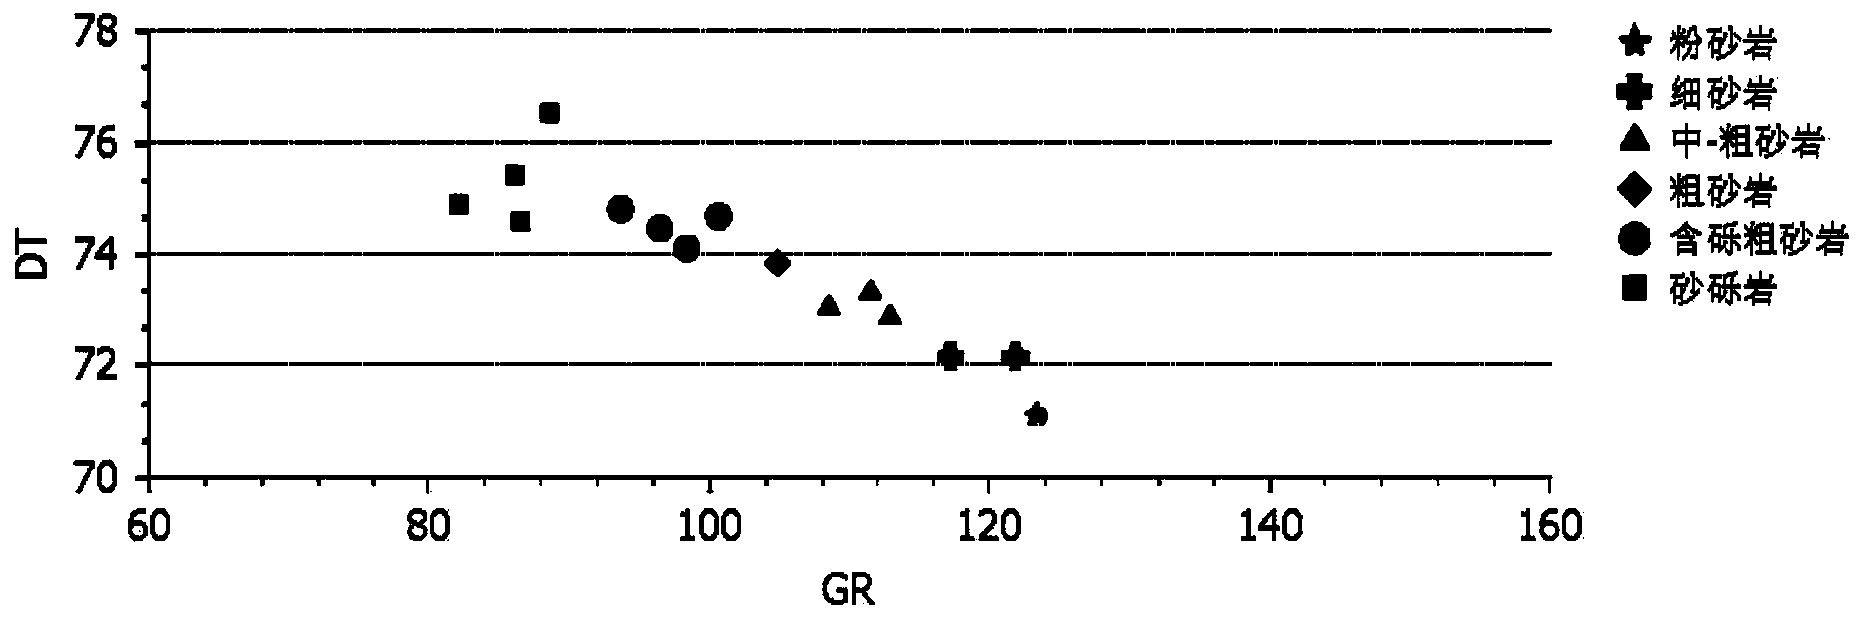
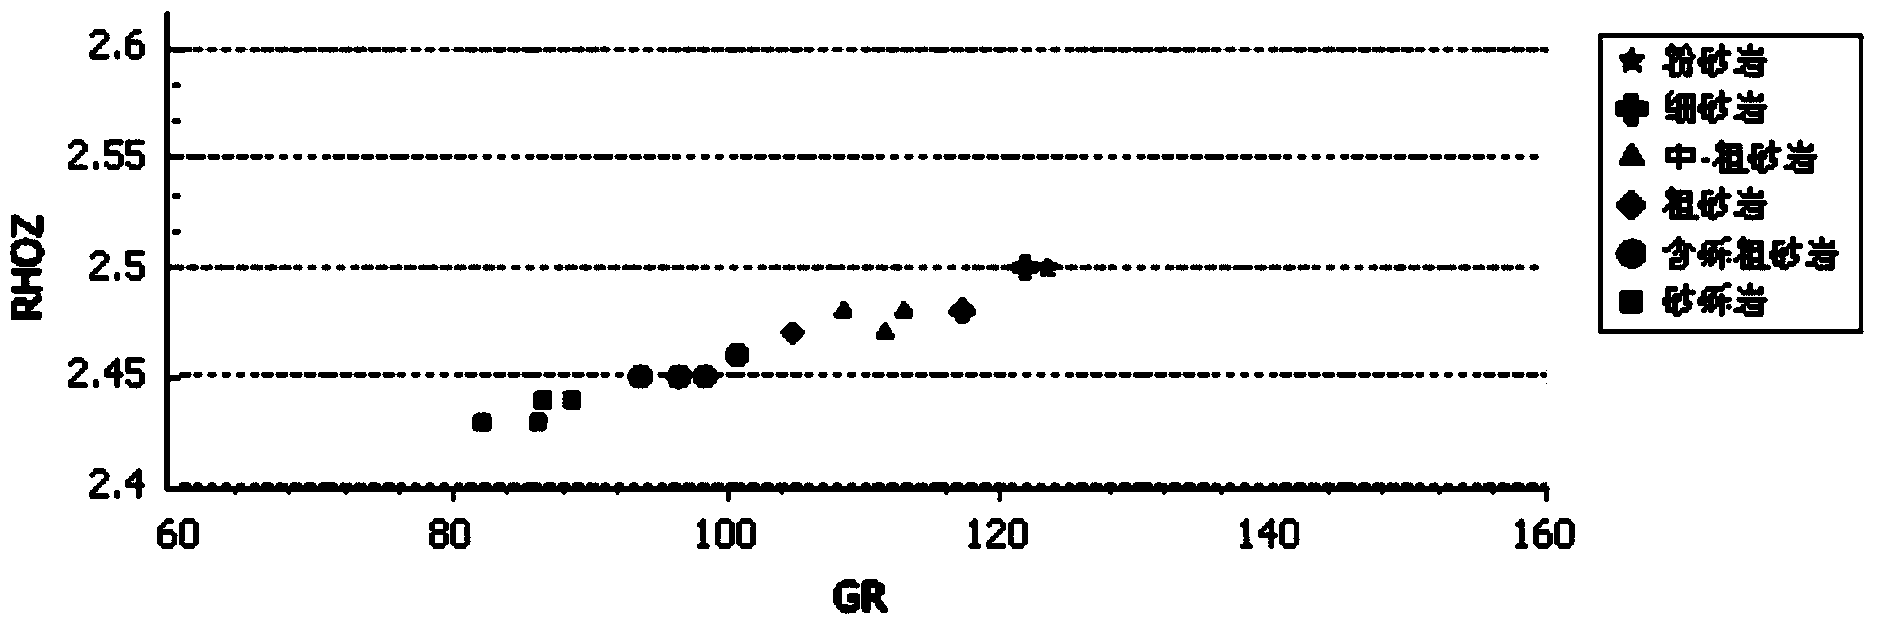
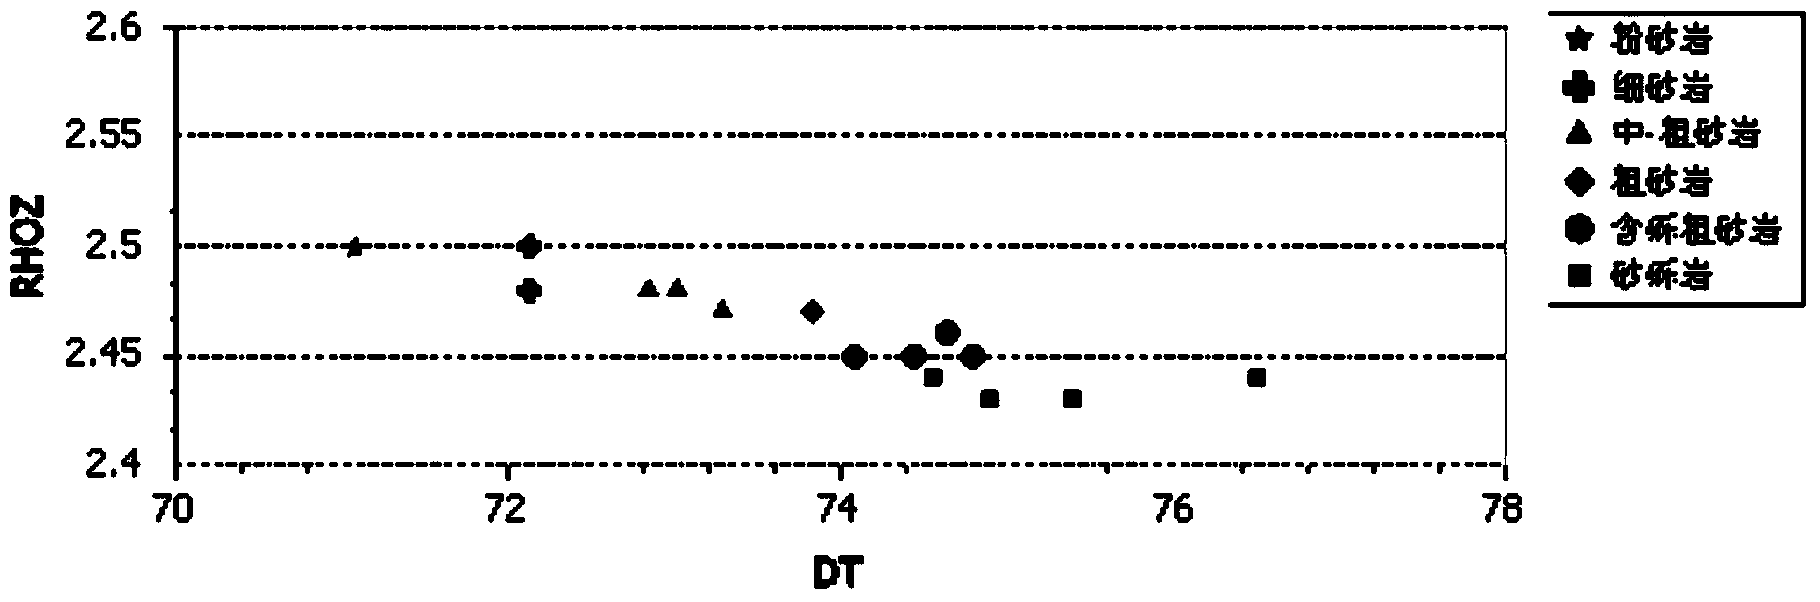
[0039] Determine the values ​​of multiple logging parameters at the multiple depth positions, and select N types of logging parameters that increase or decrease with the increase of the lithological sample size as the characteristic parameters, N≥2;
[0040] According to the lithology types of the core sample points at the multiple depth positions and the values ​​of the N characteristic parameters, determine the distance between each N-dimensional cell and the lithology type in the N-dimensional space of the characteristic parameter coordinates Correspondence;
[0041] According to the value of the characteristic parameter at each depth position of the entire well section and the corresponding relationship, the representative lithology type at each depth position is determined.
[0042] Further, the method for determining the correspondence between the characteristic parameter and the lithology type in the N-dimensional space is:
[0043] For each of the multiple depth positions, the lithology type at the depth position is determined as a lithology type corresponding to the N-dimensional cell pointed to by the N characteristic parameter values ​​at the depth position, by This obtains one or more lithology types corresponding to one or more N-dimensional cells in the N-dimensional space and the number of shares of each lithology type;
[0044] For N-dimensional cells that do not have a corresponding lithology type in the N-dimensional space, the corresponding one or more lithology types and the number of copies thereof are generated by interpolation by the nearest interpolation method.
[0045] Further, the representative lithology type at each depth position is the most common lithology type among all lithology types at this depth position.
[0046] Further, the size data capacity of the core sample point is not less than five.
[0047] Further, the logging parameters are natural gamma parameters, density parameters, acoustic parameters and neutron parameters.
[0048] Another alternative technical solution is to use an interactive multi-dimensional histogram to identify the lithology of the entire well section. In this embodiment, the depth range of the sample point is selected from -3712.0 meters to -3915.0 meters. The specific implementation steps are as follows :
[0049] Step 1: Take multiple core samples from multiple depth positions, determine the particle size data of each core sample, and determine the lithology type according to the core sample particle size data;
[0050] Based on core sample data, classify lithology types according to the particle size data of core sample points;
[0051] In order to ensure the representativeness of the sample, the particle size data of the core sample point is not less than five depth points, and the number of samples selected in this embodiment is 15 as shown in Table 1 below. Table 1 is the naming table of lithology samples. The depth range of the sample points selected in this embodiment is -3712.0 meters to -3915.0 meters. See the second column of the table. The various components (gravel, gravel, The weight percentages of coarse sand, medium sand, fine sand, silt and mud) are shown in columns 3 to 8 in the table. Then, according to the lithology type rules in sedimentology, the sample points from fine to coarse are named siltstone (below) Sequence 11 in the table), fine sandstone (sequences 7 and 10), medium-coarse sandstone (8, 12 and 15), coarse sandstone (sequence 2), pebbly coarse sandstone (sequence 1, 4, 13 and 14), gravel Rocks (sequences 3, 5, 6 and 9) see column 9 in the table.
[0052] Table 1 Nomenclature of lithological samples
[0053]
[0054]
[0055] Step 2: Use the lithology type at the same depth to scale the values ​​of multiple logging parameters, and establish an intersection diagram between the logging parameters and the lithology type;
[0056] According to the theory of good correlation between lithology and particle size and conventional logging parameters, the named core sample points are used to scale conventional logging parameters. In this example, natural gamma (GR), density parameters (RHOZ), and acoustic waves are selected. Parameters (DT) and neutron parameters (tnph). In the actual detection process, other conventional logging parameters can also be selected according to needs, and the intersection of different parameters and lithological samples can be established to determine the correlation between each parameter and lithological grain size . See Figure 1a~Figure 1d , Figure 1a~Figure 1d It is the intersection diagram of four different parameters and lithological samples. in Figure 1a~Figure 1d In this example, the same legend is used to indicate the same lithology type. In this example, the five-pointed star indicates siltstone, the cross shape indicates fine sandstone, the triangle indicates medium-coarse sandstone, the diamond block indicates coarse sandstone, and the round block indicates coarse gravel. Sandstone and rectangular blocks represent glutenite.
[0057] Figure 1a It is the GR-DT intersection diagram, that is, GR is the abscissa scale, DT is the ordinate scale, and the named lithology samples in Table 1 are scaled on the intersection diagram. It can be seen that the sample points of the same lithology are The GR-DT intersection map has concentrated locations, and different particle size lithologies are distributed in different areas of the intersection map. The particle size ranges from fine to coarse (from fine to coarse: siltstone, fine sandstone, medium-coarse sandstone, (Coarse sandstone, gravel-bearing coarse sandstone, glutenite) GR gradually decreases, while DT gradually increases, showing obvious regularity. This figure shows that GR and DT have a good correlation with lithological particle size. Figure 1b It is the GR-RHOZ intersection diagram, that is, GR is the abscissa scale, RHOZ is the ordinate scale, and the named lithology samples in Table 1 are scaled on the intersection diagram. It can be seen that the sample points of the same lithology are in the The GR-RHOZ intersection map has concentrated locations, and different particle size lithologies are distributed in different areas of the intersection map. The particle size ranges from fine to coarse (from fine to coarse: siltstone, fine sandstone, medium-coarse sandstone, (Coarse sandstone, gravel-bearing coarse sandstone, glutenite) GR and RHOZ gradually decrease, showing obvious regularity. This figure shows that GR and RHOZ have a good correlation with lithological particle size. Figure 1c DT-RHOZ intersection diagram, that is, DT is the abscissa scale, RHOZ is the ordinate scale, and the named lithology samples in Table 1 are scaled on the intersection diagram. It can be seen that the sample points of the same lithology are The locations in the DT-RHOZ intersection map are concentrated, and the lithology of different particle sizes are distributed in different areas of the intersection map. The RHOZ gradually decreases in particle size from fine to coarse, while DT gradually increases, showing obvious regularity. This figure shows that DT and RHOZ have a good correlation with lithological particle size. From the above three figures, it can be seen that the particle size of the selected lithology sample has a good correlation with GR, RHOZ and DT, as the lithology particle size becomes coarser (from fine to coarse: siltstone, fine sandstone, medium-coarse) For sandstone, coarse sandstone, gravelly coarse sandstone, glutenite), the GR value and RHOZ value gradually become lower, while the DT value gradually becomes larger. Figure 1d Is the GR-tnph intersection graph, that is, tnph is the abscissa scale and GR is the ordinate scale. The lithology samples named in Table 1 are scaled on the intersection diagram. It can be seen that the samples are in this intersection diagram, the same The distribution of samples with different particle sizes is scattered, and the whole is irregular. This figure shows that tnph has a poor correlation with lithology and particle size. Therefore, natural gamma, density parameters and acoustic parameters are selected as characteristic parameters.
[0058] Step 3: Select the logging parameters that increase or decrease with the increase in the particle size of the lithology sample in the intersection map as the characteristic parameters, and count the number of occurrences of various types of lithology in each characteristic parameter, and establish multiple A histogram model between two characteristic parameters-lithology type-number of copies;
[0059] Such as Figure 2a~2c As shown, Figure 2a It is a GR characteristic parameter-lithology-frequency histogram model. The X-axis of the histogram represents the GR characteristic parameters, the Y-axis represents various lithologies, and the Z-axis represents the frequency of various lithological GR characteristic parameter points; Figure 2b versus Figure 2a The difference is that the X axis of the histogram represents DT characteristic parameters; Figure 2c versus Figure 2a The difference is that the X-axis of the histogram represents the RHOZ characteristic parameters; in the above histogram, the appropriate spacing is set according to the parameter value range, in Figure 2a Among them, the natural gamma (GR) feature parameter range is 0-210, and the interval is 10; Figure 2b Among them, the range of acoustic wave (DT) characteristic parameters is 0-100, and the interval is 5; Figure 2c The density (RHOZ) characteristic parameter range is 0-3, and the interval is 0.1. If the selected characteristic parameters are not equal to three, then a corresponding number of characteristic parameter-lithology-frequency histogram models are established.
[0060] Step four: uniformly express all histogram models obtained in step three in an N-dimensional coordinate space, N≥2;
[0061] Since the number of characteristic logging parameters selected in this embodiment is greater than 2, in order to show the correspondence between all the characteristic logging parameters and sample points more clearly, change Figure 2a versus Figure 2c Unified representation in a 3-dimensional coordinate space;
[0062] Such as image 3 As shown, the X-axis in the 3-dimensional coordinate space represents the natural gamma (GR) characteristic parameters; the Y-axis represents the acoustic wave (DT) characteristic parameters; the Z-axis represents the density (RHOZ) characteristic parameters; the spacing of each dimension of the 3-dimensional coordinate space The setting is the same as the feature parameter spacing setting in the histogram model.
[0063] The histogram and 3-dimensional coordinate space can be realized by conventional mathematical statistics software, such as general software such as Excel, Matlab or Origin. It can also be established by the lithology identification module in the logging sedimentary facies software developed by China Oilfield Services Co., Ltd.
[0064] Step 5: For cells in the N-dimensional coordinate space without lithology types, find the cell with the closest sample point to the single cell space to be generated, and use nearest interpolation to generate various lithologies in the cell without sample points Type, and update the N-dimensional coordinate space, and finally form a distribution map of lithology types for the entire well section in the N-dimensional coordinate space;
[0065] If there is no lithological sample in the cell of the 3D coordinate space, by searching for the cell of the sample point closest to the space of the single cell to be generated, the number of various lithological points in the cell without sample point is generated by interpolation, and the 3D is updated The coordinate space will eventually form a lithology distribution map including the 3-dimensional coordinate space of the entire well section;
[0066] Step 6, respectively count the number of various types of lithology in each cell of the N-dimensional coordinate space, and calculate the number of copies of each type of lithology in each cell;
[0067] Count the occurrence frequency of each lithology type in the value section of all logging parameters, and use the most frequently occurring lithology type as the representative of the lithology type in this section, and finally form a continuous lithology in the entire well section after simulation Types of. (The frequency calculation method is as follows: if a cell contains 3 medium-coarse sandstone samples, 6 pebbly coarse sandstone samples, and 1 glutenite sample, the probability of various types of lithology in this cell is medium-coarse sandstone 30%, gravel-bearing coarse sandstone 60%, glutenite 10%, the probability of other lithology is zero).
[0068] Step 7: Find the corresponding position in the cell in the N-dimensional coordinate space for the characteristic parameter value corresponding to each depth section of the entire well section, and use the lithology with the most occurrences in this cell as the corresponding depth section The lithology type representative of, and then the continuous characteristic parameter values ​​of the same lithology type are combined to form a continuous lithology section of the entire well section.
[0069] The formed continuous fine lithology section of the entire well section see Figure 4 , This map can be implemented using logging sedimentary facies software developed by China Oilfield Services Co., Ltd. or other logging sedimentary facies software. The specific process is to extract the characteristic parameters, range and spacing in the 3-dimensional coordinate space from the computer, and calculate The cell number where the parameter point is located, and search for the corresponding cell in the 3-dimensional coordinate space, and use the lithology with the highest frequency in the cell as the lithology type of the parameter point. Finally, the continuous and same lithological parameter points are merged to establish a lithological profile, Figure 4 Three columns are given in order from left to right for logging depth, characteristic parameters and lithology profile. In the characteristic parameter column, the range of natural gamma parameter 1 is 0-300api; the range of density parameter 2 is 1.95 2.95g/cc; the range of sonic parameter 3 is 1.40-40US/FT; the rightmost column shows the continuous lithology section formed by the lithology type with the highest frequency in the cell, this lithology type There is a one-to-one correspondence with the lithology types named in Table 1. The lithology section 4 is displayed in a rectangular manner. In the figure, the rectangles with the same length are the same lithology, and the height of the rectangle indicates the distribution range of the lithology in the depth direction.
[0070] Although the embodiments disclosed in the present invention are as described above, the contents are only used to facilitate the understanding of the technical solutions of the present invention and are not used to limit the present invention. Any person skilled in the technical field of the present invention can make any modifications and changes in the implementation form and details without departing from the core technical solution disclosed in the present invention. However, the protection scope defined by the present invention remains The scope defined by the appended claims shall prevail.

PUM

no PUM

Description & Claims & Application Information

We can also present the details of the Description, Claims and Application information to help users get a comprehensive understanding of the technical details of the patent, such as background art, summary of invention, brief description of drawings, description of embodiments, and other original content. On the other hand, users can also determine the specific scope of protection of the technology through the list of claims; as well as understand the changes in the life cycle of the technology with the presentation of the patent timeline. Login to view more.

Similar technology patents

SNP (single nucleotide polymorphism) marker correlated with characteristic of short stature of Chinese domestic horses and application of SNP marker

PendingCN105713982ASpeed ​​up the breeding processThe method is accurate and reliable
Owner:INST OF ANIMAL SCI CAAS

Method and special kit for detection of CNV label of cattle VAMP7 gene

ActiveCN111172295AThe method is accurate and reliableSimple and efficient operation
Owner:NORTHWEST A & F UNIV

Line selection method for single-phase earth fault line of small current grounding system

InactiveCN106093714AThe method is accurate and reliableGood application condition
Owner:山东博鸿电气股份有限公司

Analysis and regulation method for pure oxalic acid anode oxidation bath liquid

InactiveCN109633075AThe method is accurate and reliableeasy to operate
Owner:XIAN AERO ENGINE CONTROLS

RNAi reagent for interfering portunus trituberculatus sex determining gene expression as well as RNAi method and application thereof

PendingCN114015688AThe method is accurate and reliableeasy to operate
Owner:YELLOW SEA FISHERIES RES INST CHINESE ACAD OF FISHERIES SCI

Classification and recommendation of technical efficacy words

  • The method is accurate and reliable
  • high degree of automation

Line selection method for single-phase earth fault line of small current grounding system

InactiveCN106093714AThe method is accurate and reliableGood application condition
Owner:山东博鸿电气股份有限公司

SNP (single nucleotide polymorphism) marker correlated with characteristic of short stature of Chinese domestic horses and application of SNP marker

PendingCN105713982ASpeed ​​up the breeding processThe method is accurate and reliable
Owner:INST OF ANIMAL SCI CAAS

Method and special kit for detection of CNV label of cattle VAMP7 gene

ActiveCN111172295AThe method is accurate and reliableSimple and efficient operation
Owner:NORTHWEST A & F UNIV

Analysis and regulation method for pure oxalic acid anode oxidation bath liquid

InactiveCN109633075AThe method is accurate and reliableeasy to operate
Owner:XIAN AERO ENGINE CONTROLS

RNAi reagent for interfering portunus trituberculatus sex determining gene expression as well as RNAi method and application thereof

PendingCN114015688AThe method is accurate and reliableeasy to operate
Owner:YELLOW SEA FISHERIES RES INST CHINESE ACAD OF FISHERIES SCI

High-fineness urban three-dimensional modeling method

Owner:星际空间(天津)科技发展有限公司

Bolt machining all-in-one machine

Owner:ANHUI LIUFANG ZHONGLIAN MECHANICAL SHARE
Why Eureka
Try Eureka