A waveform display device and method
A waveform display and real-time waveform technology, applied in digital variable/waveform display, measuring devices, instruments, etc., can solve problems such as occupying large system memory, achieve good observation effect, and save data storage space
- Summary
- Abstract
- Description
- Claims
- Application Information
AI Technical Summary
Problems solved by technology
Method used
Image
Examples
Embodiment 1
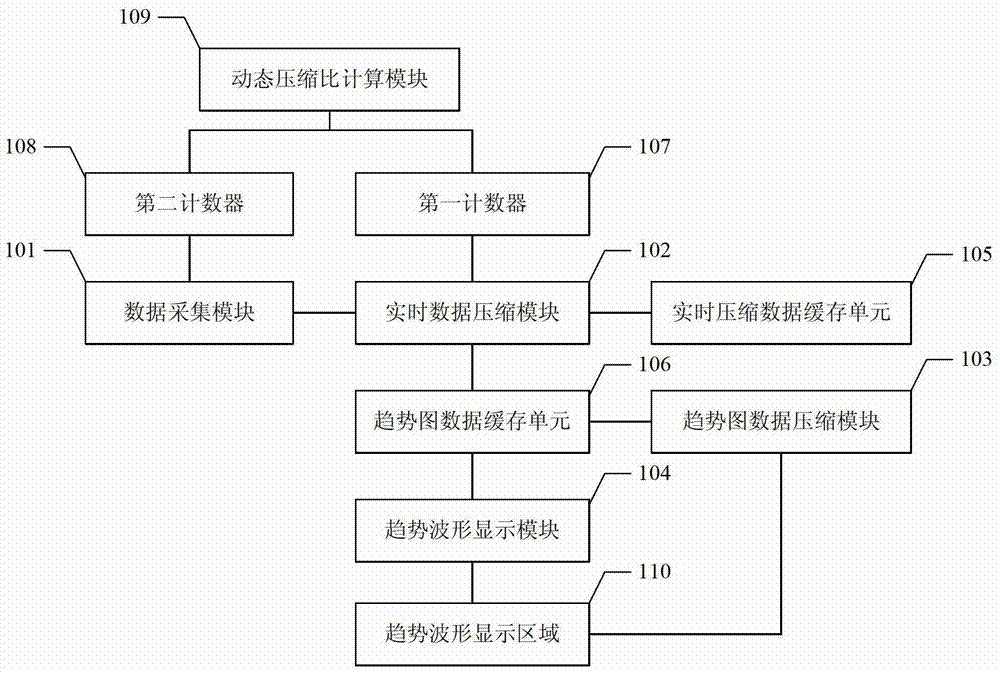
[0064] This embodiment provides a waveform display device, such as figure 1 As shown, the device includes: a data acquisition module 101, a real-time data compression module 102, a trend graph data compression module 103, a trend waveform display module 104, a real-time compressed data cache unit 105, a trend graph data cache unit 106, a first counter 107, Second counter 108, dynamic compression ratio calculation module 109 and trend waveform display area 110; Wherein,
[0065] The data acquisition module 101 is used to collect data, and transmits the collected data to the real-time data compression module 102;
[0066] The first counter 107 is used for counting the collected data transmitted from the data collection module 101 to the real-time data compression module 102 to obtain a count value;
[0067] The second counter 108 is used to calculate the total number of data collected by the data collection module 101;
[0068] A dynamic compression ratio calculation module, c...
Embodiment 2
[0129] This embodiment provides a waveform display method, including:
[0130] According to the first data compression method, the collected data and the existing data in the real-time compressed data cache unit are compressed to obtain the first compressed data, and the real-time compressed data cache unit is updated by using the first compressed data; the collected data is counted to obtain count value;
[0131] When it is determined that the count value reaches the current dynamic compression ratio, the data in the real-time compressed data cache unit is added to the trend graph data cache unit, the real-time compressed data cache unit is cleared, and the count value is set to zero; The current dynamic compression ratio is the ratio of the total number of currently collected data to the set number of groups;
[0132] When it is determined that the amount of data in the trend graph data cache unit reaches the set upper limit, the data in the trend graph data cache unit is c...
Embodiment 3
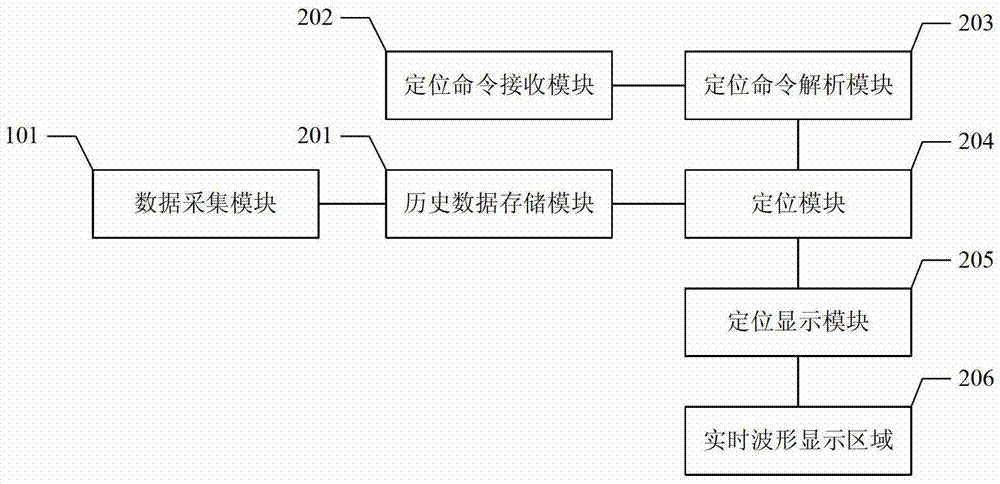
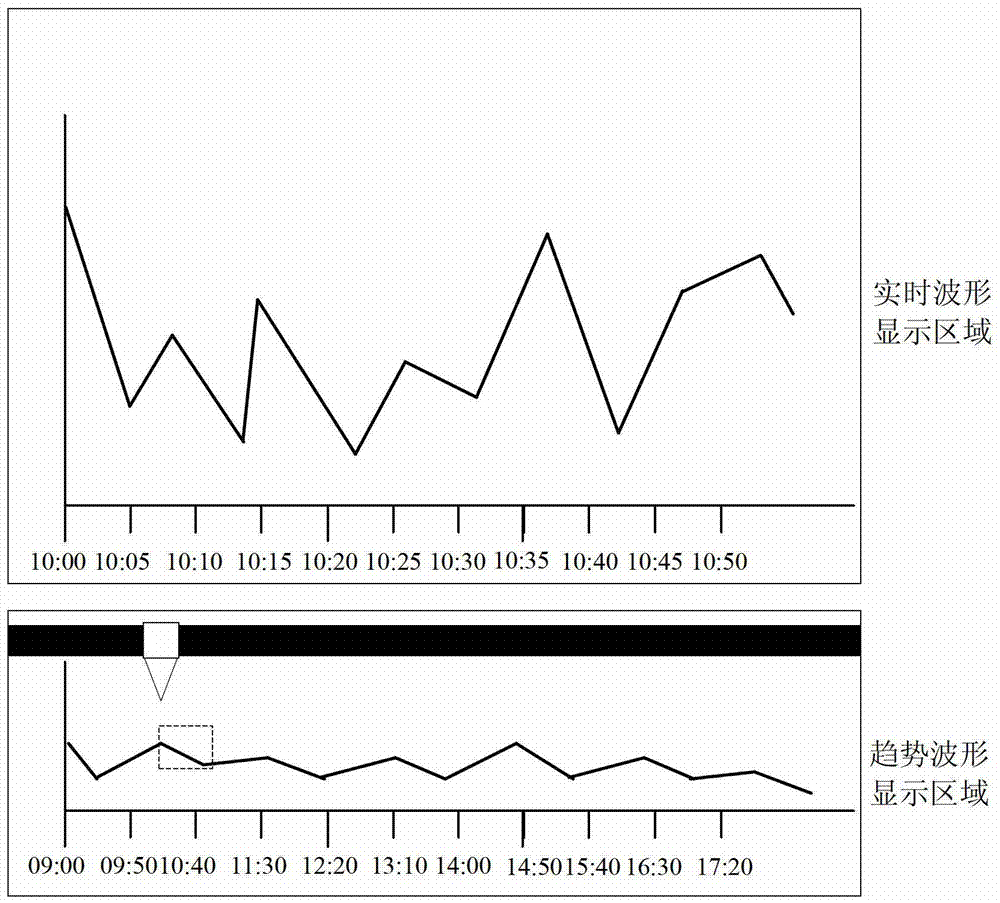
[0155] This embodiment provides a waveform display device, such as Figure 5 As shown, the waveform display device includes: a data acquisition module 501, a real-time data compression module 502, a trend graph data compression module 503, a trend waveform display module 504, a real-time compressed data cache unit 505, a trend graph data cache unit 506, and a first counter 507, second counter 508, dynamic compression ratio calculation module 509, historical data storage module 510, positioning command receiving module 511, positioning command analysis module 512, positioning module 513, positioning display module 514, real-time waveform display module 515, cutting module 516 , a real-time waveform display area 517 and a trend waveform display area 518; wherein, the real-time waveform display area 517 and the trend waveform display area 518 are arranged vertically, and the real-time waveform display area 517 is at the top, and the trend waveform display area 518 is at the bottom...
PUM
 Abstract
Description
Claims
Application Information
 - R&D Engineer
- R&D Manager
- IP Professional
- Industry Leading Data Capabilities
- Powerful AI technology
- Patent DNA Extraction
Browse by: Latest US Patents, China's latest patents, Technical Efficacy Thesaurus, Application Domain, Technology Topic, Popular Technical Reports.
© 2024 PatSnap. All rights reserved.Legal|Privacy policy|Modern Slavery Act Transparency Statement|Sitemap|About US| Contact US: help@patsnap.com


