Method and device for adjusting graph granularity
A technology for adjusting direction and granularity, applied in the input/output process of data processing, instruments, electrical and digital data processing, etc., and can solve problems such as low efficiency, low accuracy, and poor user experience.
- Summary
- Abstract
- Description
- Claims
- Application Information
AI Technical Summary
Problems solved by technology
Method used
Image
Examples
Embodiment 1
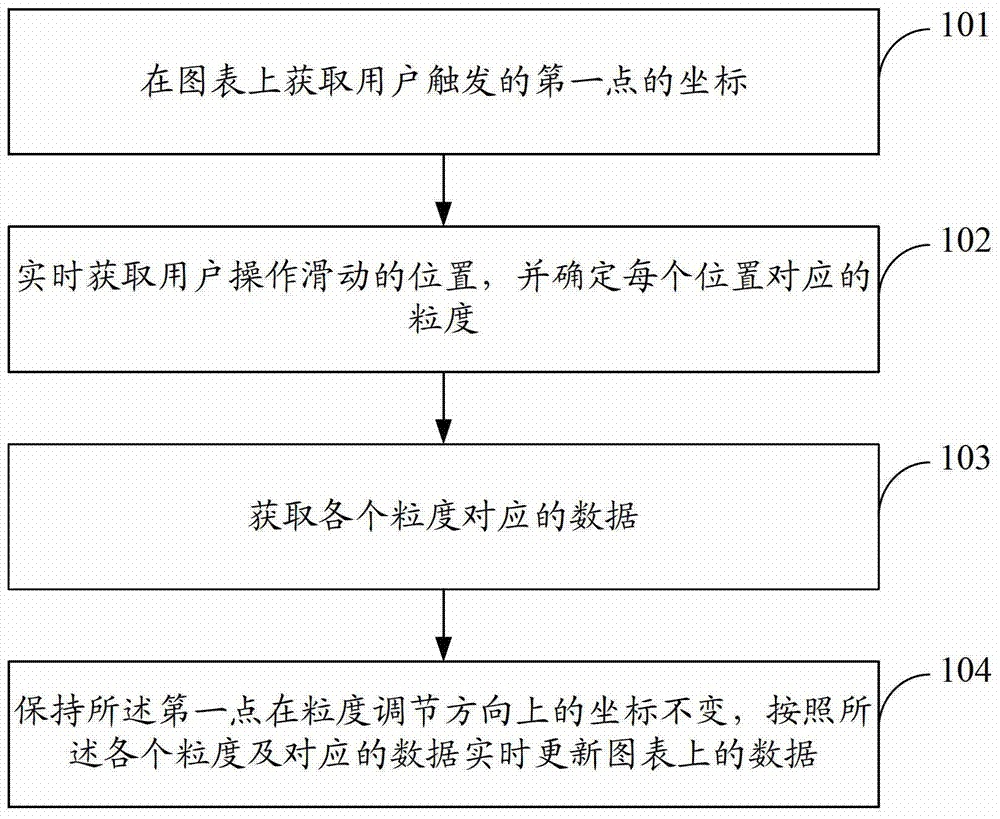
[0088] see figure 1 , this embodiment provides a method for adjusting the granularity of the graph, including:
[0089] 101: Obtain the coordinates of the first point triggered by the user on the chart;
[0090] 102: Obtain the sliding position of the user operation in real time, and determine the granularity corresponding to each position;
[0091] 103: Obtain data corresponding to each granularity;
[0092] 104: Keep the coordinates of the first point in the grain size adjustment direction unchanged, and update the data on the chart in real time according to each grain size and corresponding data.
[0093] In this embodiment, the graph refers to a two-dimensional data graph, which includes a first coordinate axis and a second coordinate axis that are perpendicular to each other, and usually uses two coordinate values to represent data. For example, the first coordinate axis is time and the second coordinate axis is percentage; or the first coordinate axis is distance an...
Embodiment 2
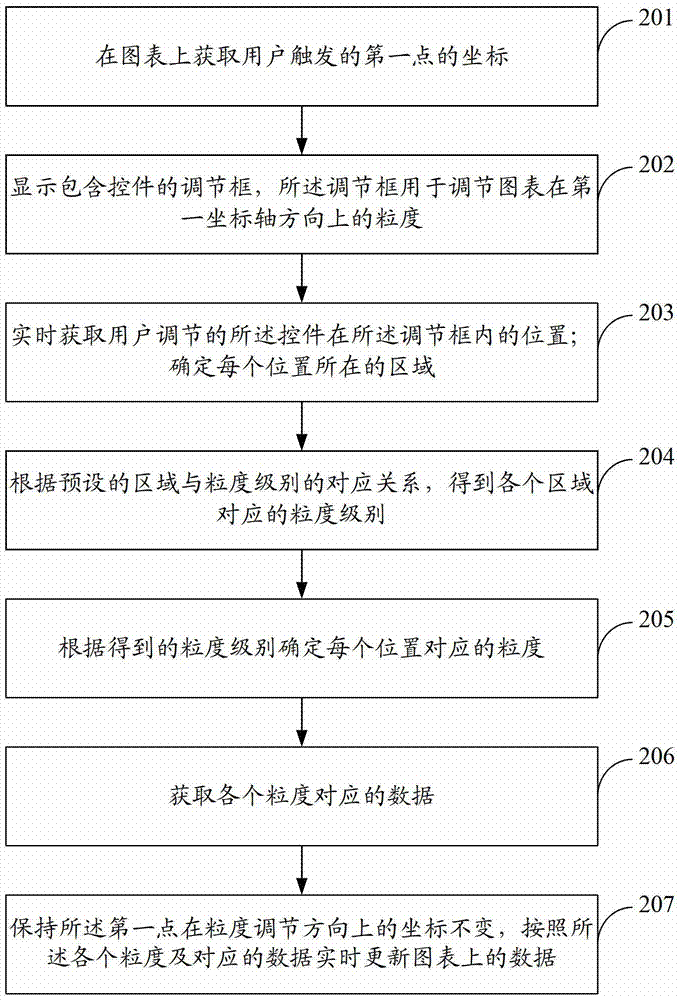
[0129] see figure 2 , this embodiment provides a method for adjusting the granularity of the graph, the method specifically includes:
[0130] 201: Obtain the coordinates of the first point triggered by the user on the chart;
[0131] In this embodiment, the graph refers to a two-dimensional data graph, and includes a first coordinate axis and a second coordinate axis that are perpendicular to each other; usually two coordinate values are used to represent data.
[0132] For example, the first coordinate axis is time and the second coordinate axis is percentage; or the first coordinate axis is distance and the second coordinate axis is the number of users, and so on. Wherein, one of the first coordinate axis and the second coordinate axis is a horizontal direction, and the other is a vertical direction, which is not specifically limited in the present invention.
[0133] 202: Display an adjustment box containing controls, the adjustment box is used to adjust the granulari...
Embodiment 3
[0158] see Image 6 , this embodiment provides a method for adjusting the granularity of the graph, the method specifically includes:
[0159] 601: Obtain the coordinates of the first point triggered by the user on the chart;
[0160] In this embodiment, the graph refers to a two-dimensional data graph, and includes a first coordinate axis and a second coordinate axis that are perpendicular to each other, usually two coordinates are used to represent data.
[0161] For example, the first coordinate axis is time and the second coordinate axis is percentage; or the first coordinate axis is distance and the second coordinate axis is the number of users, and so on. Wherein, one of the first coordinate axis and the second coordinate axis is a horizontal direction, and the other is a vertical direction, which is not specifically limited in the present invention.
[0162] In this embodiment, if the user uses a finger to trigger the screen, the contact point of the finger on the scr...
PUM
 Abstract
Description
Claims
Application Information
 - R&D
- Intellectual Property
- Life Sciences
- Materials
- Tech Scout
- Unparalleled Data Quality
- Higher Quality Content
- 60% Fewer Hallucinations
Browse by: Latest US Patents, China's latest patents, Technical Efficacy Thesaurus, Application Domain, Technology Topic, Popular Technical Reports.
© 2025 PatSnap. All rights reserved.Legal|Privacy policy|Modern Slavery Act Transparency Statement|Sitemap|About US| Contact US: help@patsnap.com


