Method for achieving visualization of power grid information system business data

A technology of business data and information system, which is applied in the field of realization of business data visualization of power grid information system, can solve problems such as the lack of realization methods of business data visualization of power grid information system, and achieve the effect of realizing visualization and large-screen display

Inactive Publication Date: 2014-11-05
STATE GRID CORP OF CHINA +1
View PDF3 Cites 19 Cited by
  • Summary
  • Abstract
  • Description
  • Claims
  • Application Information

AI Technical Summary

Problems solved by technology

However, there is still a lack of methods for realizing the visualization of business data in power grid information systems.

Method used


Image

  • Method for achieving visualization of power grid information system business data
  • Method for achieving visualization of power grid information system business data
  • Method for achieving visualization of power grid information system business data

Examples


Embodiment Construction

[0022] The implementation method of the power grid information system business data visualization provided by the present invention will be described in detail below in conjunction with the accompanying drawings and specific embodiments.

[0023] The method for realizing the visualization of business data of the power grid information system provided by the present invention includes the following steps executed in order:

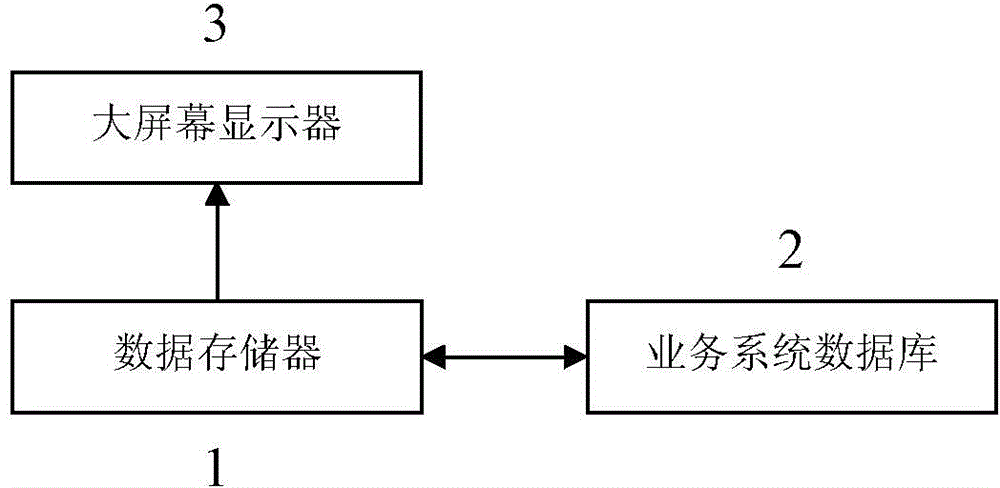
[0024] Step 1) build as figure 1 The hardware platform shown: First, build data storage 1 physically, and connect the data channel of business system database 2 to data storage 1 through Ethernet, and establish the connection between data storage 1 and large-screen display 3 at the same time; data storage 1 It is a server with a built-in dedicated data storage area, and the operations involved in the following steps are mainly completed in the data storage 1; the business system database 2 is each existing information system database that needs to visualize...


PUM


Abstract

The invention discloses a method for achieving visualization of power grid information system business data. The method comprises the steps of establishing a hardware platform, circulating data, standardizing calculation, monitoring and governing the data quality, establishing a visual platform, carrying out customization displaying and the like. The method has the advantages that a data channel for showing the power grid information system business data from a source business system to large screen is established, the circulation and calculation of the business data are achieved, and the data can be generated again according to displaying requirements. The quality of the business system data is monitored and governed through a data resource management assembly, and movable monitoring and track processing can be carried out. According to the visual platform, a display platform for the power grid information system business data is provided, and core business data are visualized and shown on the large screen.

Description

technical field [0001] The invention belongs to the technical field of smart grid information construction, and in particular relates to a method for realizing business data visualization of a grid information system. Background technique [0002] Computers have been used for scientific computing and data processing for nearly 50 years. However, for a long time, due to the limitations of computer technology, data can only be processed in batches and cannot be processed interactively. It cannot intervene and guide the calculation process, but can only passively wait for the output of the calculation results. And a large amount of output data can only be processed manually, or use a plotter to output two-dimensional graphics. In doing so, not only cannot get an intuitive and visual overall concept of the relevant data in time, but also may lose a lot of information. In recent years, data from various business systems, such as enterprise resource management system (ERP), geo...

Claims


Application Information

Patent Timeline
Patent Type & Authority Applications(China)
IPC IPC(8): G06Q10/06G06Q50/06
Inventor 董阳何金王扬赵迪
Owner STATE GRID CORP OF CHINA
Why Eureka
Try Eureka