Metal anti-fake identification method based on ultrasonic backscattering attenuation coefficient spectrum

A technology of ultrasonic backscattering and attenuation coefficient, which is applied in the direction of using sound wave/ultrasonic wave/infrasonic wave to analyze solids and prepare samples for testing. It can solve the problems of metal product damage, high cost, and complicated identification methods, and achieve low cost, The effect of fast recognition speed and easy online identification

Inactive Publication Date: 2015-02-04
SHAANXI NORMAL UNIV
4 Cites 4 Cited by

AI-Extracted Technical Summary

Problems solved by technology

[0006] Chemical methods are relatively accurate, but the identification process and chemical reactions occur during identification, which will cause damage to metal products
There...

Abstract

The invention relates to a metal anti-fake identification method based on an ultrasonic backscattering attenuation coefficient spectrum. The fake identification on a metal material is completed through five steps of pre-treating a reference sample, acquiring a time-domain signal, calculating the attenuation coefficient spectrum of the reference sample, calculating self-relevance coefficients of the attenuation coefficient spectrum in the reference sample, and calculating relevant coefficients between the sample to be tested and the attenuation coefficient spectrum of the reference sample. By adopting the metal anti-fake identification method, a metal product does not need to be damaged and is not damaged in the identification process, so that non-destructive identification is achieved; in addition, compared with a conventional physical and chemical identification method, the result that whether the metal is true or fake can be obtained through independent identification, and moreover the identification result is accurate and reasonable, the identification method is relatively simple, the cost is low, the identification speed is fast, on-line identification is easy to achieve, and popularization and application are facilitated.

Application Domain

Analysing solids using sonic/ultrasonic/infrasonic wavesPreparing sample for investigation

Technology Topic

PhysicsPre treatment +8

Image

  • Metal anti-fake identification method based on ultrasonic backscattering attenuation coefficient spectrum
  • Metal anti-fake identification method based on ultrasonic backscattering attenuation coefficient spectrum
  • Metal anti-fake identification method based on ultrasonic backscattering attenuation coefficient spectrum

Examples

  • Experimental program(3)

Example Embodiment

[0034] Example 1
[0035] Using the 420 stainless iron metal product with a known mark as the reference sample, based on the ultrasonic backscatter attenuation coefficient spectrum, the anti-counterfeiting identification of the samples numbered 1#, 2#, and 3# are carried out. The specific method is realized by the following steps:
[0036] The 420 stainless iron metal products are mixed with the other two metal samples of 304 stainless steel and aluminum 2A12. They are cylindrical in shape, with a thickness of 15mm and a diameter of 47.1mm. The sample numbers to be tested are shown in the table 1 shown.
[0037] Table 1 Sample table of samples to be tested
[0038] Numbering
[0039] (1) Pretreatment of reference sample
[0040] The reference sample of the known standard 420 stainless iron material was pretreated and processed into a cylindrical structure with a thickness of 15mm and a diameter of 47.1mm. The upper and lower surfaces were polished smooth and rinsed with clean water.
[0041] (2) Acquisition of time domain signals
[0042] Choose a commercially available 5077PR pulse receiver/transmitter, connect it to the transceiver probe, Tektronix-DPO5034B digital oscilloscope, and connect the oscilloscope to the computer. Choose a transceiver probe with a center frequency of 10MHz. First set the pulse width of the pulse receiver/transmitter. It is 100 nanoseconds and the pulse repetition frequency is 100Hz. Place the transceiver probe on the surface of the reference sample, make the transceiver probe coupled and contact the reference sample, the coupling agent is glycerin, the transceiver probe emits ultrasonic pulse signals, and the ultrasonic pulse propagates in the reference sample. When encountering metal crystal grains, it will produce backscatter, and the sound wave will produce echo after reaching its bottom surface. The backscattered wave and echo will be received by the probe and transmitted to the pulse receiver/transmitter. Sampling the scattered waves and echoes at a sampling rate of 2.5Gs/s, sampling 5000 times to take the average value, and then sending it to the computer, using the compiled routine program for information processing, and obtaining the time-domain waveform of the reference sample;
[0043] (3) Calculate the attenuation coefficient spectrum of the reference sample
[0044] The grass signal located between the initial wave and the first bottom echo and other echoes is the scattered wave. The scattered signal between the initial wave and the first bottom echo in the time-domain waveform is extracted. The depth is caused by the scattering of grains inside the reference sample, and a certain period of time in the time-domain scattering signal is intercepted, which is from 2.4261×10 -6 To 3.8284×10 -6 The time domain width T in the s time period is 1.4023×10 -6 The local scattering signal f(t) at s, see figure 1 with figure 2 , Its time domain width T is 1.4023×10 -6 s, T should meet the condition of being smaller than the time domain width of the scattered signal between the extracted initial wave and the first bottom echo, and then divide f(t) into N equal parts, N=2, corresponding to each part f( t i ), where 1≤i≤N, take i and i+1 paragraphs, see image 3 , After adding the Hanning window, perform Fourier transform to obtain the corresponding amplitude spectrum, which are denoted as |F i (jω)|and|F i+1 (jω)|, the two satisfy the following relationship:
[0045] |F i+1 (jω)|=e -2α(ω)Δd |F i (jω)| (1)
[0046] In the formula, α(ω) is the attenuation coefficient, Δd=cT/N, and c is the propagation speed of the ultrasonic wave in the reference sample;
[0047] From equation (1):
[0048] α ( ω ) = [ ln | F i ( jω ) | - ln | F i + 1 ( jω ) | ] 2 Δd - - - ( 2 )
[0049] (4) Calculate the autocorrelation coefficient of the attenuation coefficient spectrum in the reference sample
[0050] Repeat steps (2) and (3) 6 times to get 6 different attenuation coefficient spectra, see Figure 4 , Calculate the autocorrelation coefficient value between the attenuation coefficient spectrum, the maximum autocorrelation coefficient value r b Is 0.99923, the minimum autocorrelation coefficient value is r a Is 0.98102, take the intermediate value r=(r a +r b )/2 is used as the attenuation autocorrelation coefficient of the reference sample, and the threshold is Δ=(r b -r a )/2, as shown in Table 2;
[0051] Table 2 Attenuation autocorrelation coefficient of standard sample
[0052]
[0053] (5) Calculate the correlation coefficient between the attenuation coefficient spectrum of the sample to be tested and the reference sample
[0054] Grind and clean the surfaces of the samples 1#, 2#, and 3# to be tested separately to make the surface roughness the same as the roughness of the reference sample. Follow the same operation as the previous step (2) to place the transceiver probe on 3# On the surface of the sample to be tested, the test position and the coupling conditions of the transceiver probe and the 3# sample to be tested are the same as step (2), repeat steps (2) and (3) 6 times each to obtain the attenuation of the 3# sample to be tested Coefficient spectrum α k (ω), k=6, it is the number of repetitions, compare 3# sample to be tested with reference sample, calculate the reference sample and 3# sample to be tested
[0055] The correlation coefficient value r′ between the attenuation coefficient spectrum of the product, the specific calculation formula of the attenuation correlation coefficient is
[0056] r k ′ = Σα ( ω ) · α k ( ω ) - Σα ( ω ) · X α k ( ω ) n { X [ α ( ω ) ] 2 - [ Σα ( ω ) ] 2 n } · { X [ α k ( ω ) ] 2 - [ X α k ( ω ) ] 2 n } - - - ( 3 )
[0057] In the formula, n is the number of points in the spectrum.
[0058] Choose the maximum correlation coefficient value r b ′ Is 0.99680, the minimum correlation coefficient value r a ′ Is 0.98056, take the intermediate value r′=(r a ′+r b ′)/2 is used as the attenuation correlation coefficient between the reference sample and the 3# sample to be tested, which is 0.98868.
[0059] Calculate the attenuation correlation coefficients of 1# and 2# samples and reference samples according to the above method, and the results are shown in Table 3:
[0060] Table 3 Attenuation correlation coefficient between each sample to be tested and reference sample
[0061]
[0062] (6) Anti-counterfeiting identification of metal materials
[0063] Compare the attenuation correlation coefficient r′ between the reference sample obtained in step (5) and the samples to be tested 1#, 2#, and 3# with the attenuation autocorrelation coefficient r of the reference sample in step (4), if |rr′ |≤Δ, it is determined that the material of the sample to be tested is the same as the reference sample, otherwise it is a different material, and the metal anti-counterfeiting identification is completed.
[0064] Table 4 Identification results
[0065]
[0066] From the identification results in Table 4 above, it can be seen that the identification results are consistent with the actual situation, indicating that the metal anti-counterfeiting identification method based on the ultrasonic backscatter attenuation coefficient spectrum of the present invention has accurate results and can quickly realize metal anti-counterfeiting identification.

Example Embodiment

[0067] Example 2
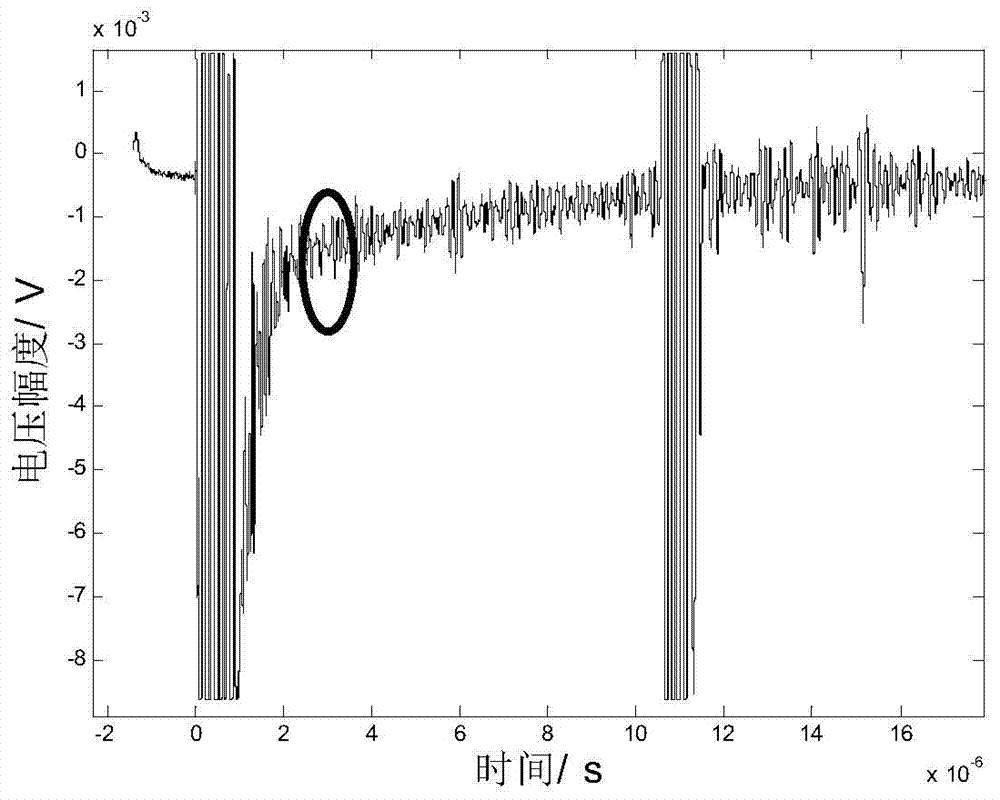
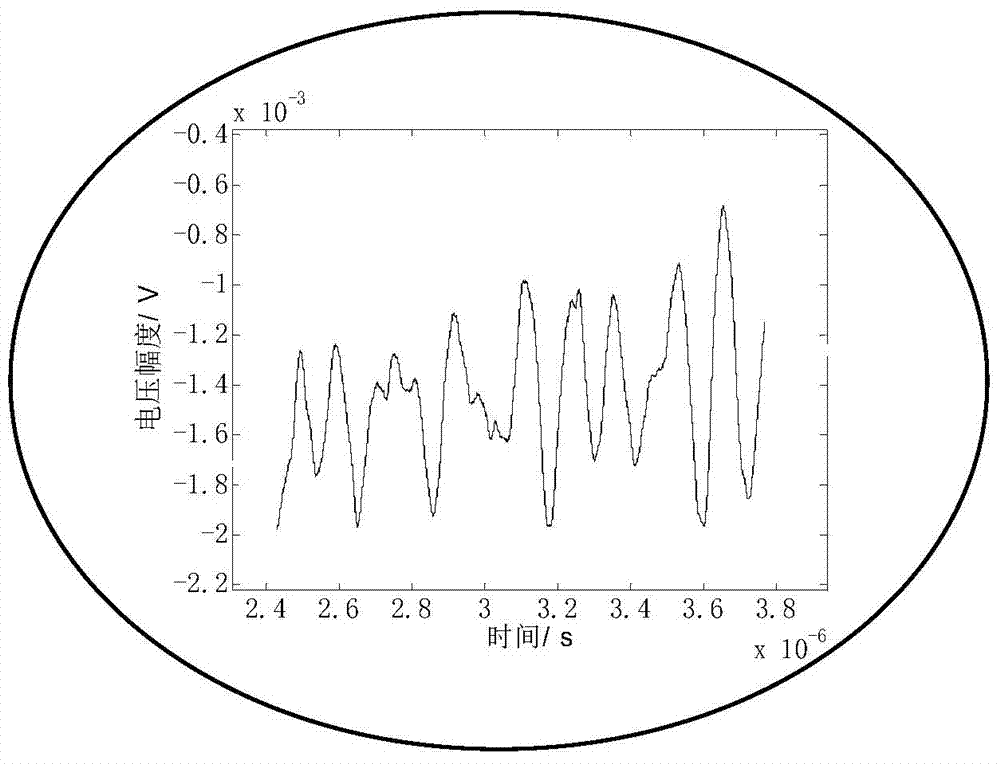
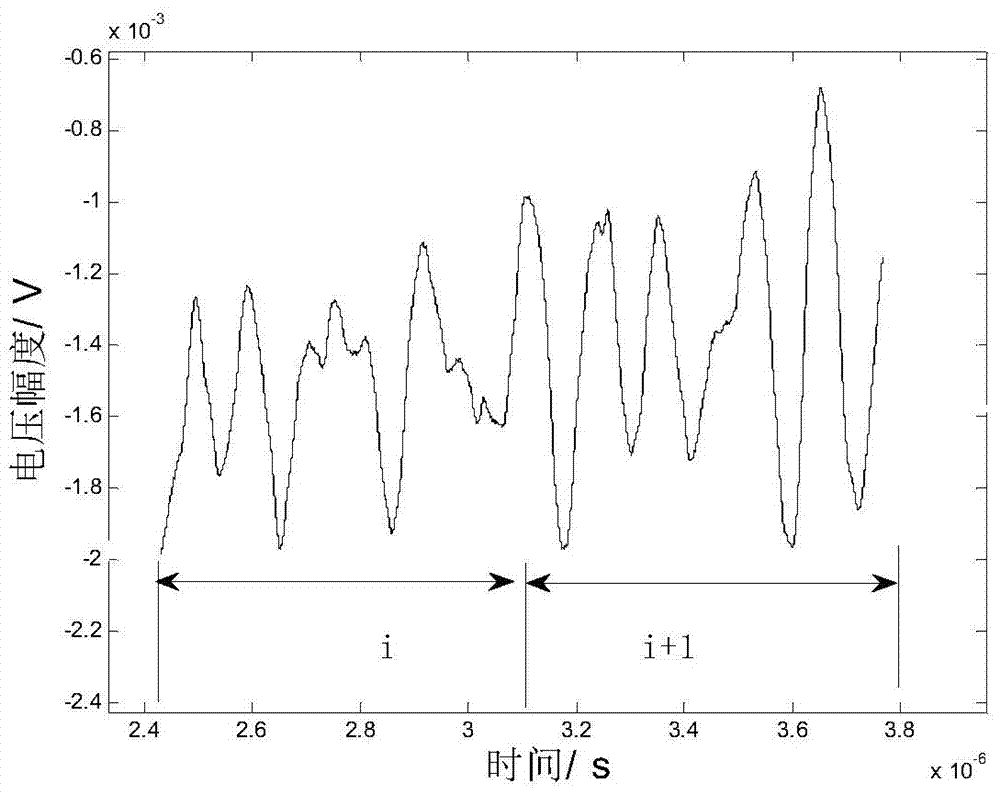
[0068] In the metal anti-counterfeiting identification method based on the ultrasonic backscatter attenuation coefficient spectrum of this embodiment, the reference sample selected in step (1) is a cuboid with a thickness of 3 mm and a length × width of 40 × 30 mm, and the surface is polished and cleaned. . In step (2), choose a commercially available 5077PR pulse receiver/transmitter, connect it to the transceiver probe, Tektronix-DPO5034B digital oscilloscope, connect the oscilloscope to the computer, select a transceiver probe with a center frequency of 5MHz, and other operations and implementations Example 1 is the same. Step (3) Extract the scattered signal between the initial wave and the first bottom echo in the time domain waveform, intercept the local scattered signal f(t), and intercept the time domain width as T, and divide f(t) into N equal parts , N is 5, which can be adjusted according to the actual situation, corresponding to f(t i ), where 1≤i≤N, take any adjacent two equal parts i and i+1, add Hanning window and perform Fourier transform to obtain the corresponding amplitude spectrum, and obtain the attenuation coefficient spectrum in the reference sample. In step (4), steps (2) and (3) are repeated three times to obtain three different attenuation coefficient spectra, and the other operations are the same as in embodiment 1. Step (5) Grind and clean the surface of the sample to be tested to make the surface roughness the same as that of the reference sample. Place the transceiver probe on the surface of the sample to be tested, the test position on the sample to be tested, and the transceiver probe and The coupling conditions of the sample to be tested are all the same as step (2), repeat steps (2) and (3) 3 times to obtain the attenuation coefficient spectrum α of the sample to be tested k (ω), k is the number of repetitions, calculate the correlation coefficient value between the attenuation coefficient spectrum of the reference sample and the sample to be tested, and mark the maximum correlation coefficient value as r b ′, the minimum correlation coefficient value is r a ′, take the intermediate value r′=(r a ′+r b ′)/2 is used as the attenuation correlation coefficient between the reference sample and the sample to be tested.
[0069] The other steps are the same as in Embodiment 1, and the metal material identification of the sample to be tested is completed.

Example Embodiment

[0070] Example 3
[0071] In the metal anti-counterfeiting identification method based on the ultrasonic backscatter attenuation coefficient spectrum of this embodiment, the reference sample selected in step (1) is a rectangular parallelepiped with a thickness of 10 mm and a length × width of 30 × 25 mm, and the surface is polished and cleaned. . In step (2), select a commercially available 5077PR pulse receiver/transmitter, connect it to the transceiver probe, Tektronix-DPO5034B digital oscilloscope, connect the oscilloscope to the computer, select a transceiver probe with a center frequency of 20MHz, and other operations and implementations Example 1 is the same. Step (3) Extract the scattering signal between the initial wave and the first bottom echo in the time domain waveform, intercept the local scattering signal f(t) in the time domain scattering signal, and divide f(t) into 10 equal parts , Corresponding to f(t i ), where 1≤i≤N, take any adjacent two equal parts i and i+1, add Hanning window and perform Fourier transform to obtain the corresponding amplitude spectrum, and obtain the attenuation coefficient spectrum in the reference sample. In step (4), steps (2) and (3) are repeated 8 times to obtain 8 different attenuation coefficient spectra, and the other operations are the same as in embodiment 1. Step (5) Grind and clean the surface of the sample to be tested to make the surface roughness the same as that of the reference sample. Place the transceiver probe on the surface of the sample to be tested, the test position on the sample to be tested, and the transceiver probe and The coupling conditions of the sample to be tested are the same as step (2), repeat steps (2) and (3) 8 times to obtain the attenuation coefficient spectrum α of the sample to be tested k (ω), k is the number of repetitions, calculate the correlation coefficient value between the attenuation coefficient spectrum of the reference sample and the sample to be tested, and mark the maximum correlation coefficient value as r b ′, the minimum correlation coefficient value is r a ′, take the intermediate value r′=(r a ′+r b ′)/2 is used as the attenuation correlation coefficient between the reference sample and the sample to be tested.
[0072] The other steps are the same as in Embodiment 1, and the metal material identification of the sample to be tested is completed.

PUM

PropertyMeasurementUnit
Thickness15.0mm
Diameter47.1mm

Description & Claims & Application Information

We can also present the details of the Description, Claims and Application information to help users get a comprehensive understanding of the technical details of the patent, such as background art, summary of invention, brief description of drawings, description of embodiments, and other original content. On the other hand, users can also determine the specific scope of protection of the technology through the list of claims; as well as understand the changes in the life cycle of the technology with the presentation of the patent timeline. Login to view more.

Similar technology patents

Genomic sequence capable of being used to distinguish Bos Indicus and Bos Taurus bloodlines, and application method of genomic sequence

ActiveCN111455072AThe identification method is simple
Owner:HUAZHONG AGRICULTURAL UNIVERSITY

Method of identifying deteriorated preserved products

InactiveCN104198379AThe identification method is simple
Owner:陆超

Method for establishing fritillary bulb medicinal material alkaloids fingerprint

ActiveCN106124677AThe identification method is simplegood reproducibility
Owner:GUANGXI WUZHOU PHARMA GRP

Method for identifying doping of potassium iodide in algae iodate and application thereof

PendingCN111504984AThe identification method is simple
Owner:HUNAN LINUO BIOLOGICAL PHARMA

Vehicle body bending mode identification method under full vehicle mode

ActiveCN107688697AEliminate Interfering ModalitiesThe identification method is simple
Owner:CHINA AUTOMOTIVE ENG RES INST

Classification and recommendation of technical efficacy words

  • The identification method is simple

substance identification instrument and Internet of Things

ActiveCN106996913AThe identification method is simpleRealize on-site and popularization
Owner:苑高强

Molecule technical method for identifying indica/japonica type of Yunnan rice old variety of Yunnan rice old variety

InactiveCN101407845Aimprove accuracyThe identification method is simple
Owner:YUNNAN AGRICULTURAL UNIVERSITY

Genomic sequence capable of being used to distinguish Bos Indicus and Bos Taurus bloodlines, and application method of genomic sequence

ActiveCN111455072AThe identification method is simple
Owner:HUAZHONG AGRICULTURAL UNIVERSITY

Method of identifying deteriorated preserved products

InactiveCN104198379AThe identification method is simple
Owner:陆超
Why Eureka
Try Eureka