A custom graphic display method

A graphic display and self-definition technology, applied in the computer field, can solve the problems of heavy workload, few monitoring pages, uniform resolution, etc.

Active Publication Date: 2018-02-16
青岛奥利普奇智智能工业技术有限公司
View PDF5 Cites 0 Cited by
  • Summary
  • Abstract
  • Description
  • Claims
  • Application Information

AI Technical Summary

Problems solved by technology

[0003] However, this hard-coded method is only applicable to a single factory, and there are few monitoring pages in the system, uniform resolution, and no follow-up requirements
When encountering the promotion of multiple factories, many system monitoring interfaces, and the need to add monitoring points, it will bring a lot of workload and high maintenance costs

Method used


Image

  • A custom graphic display method
  • A custom graphic display method
  • A custom graphic display method

Examples


Embodiment Construction

[0023] The present invention will be described below in conjunction with specific embodiments and drawings so that those skilled in the art have a clearer understanding of the invention.

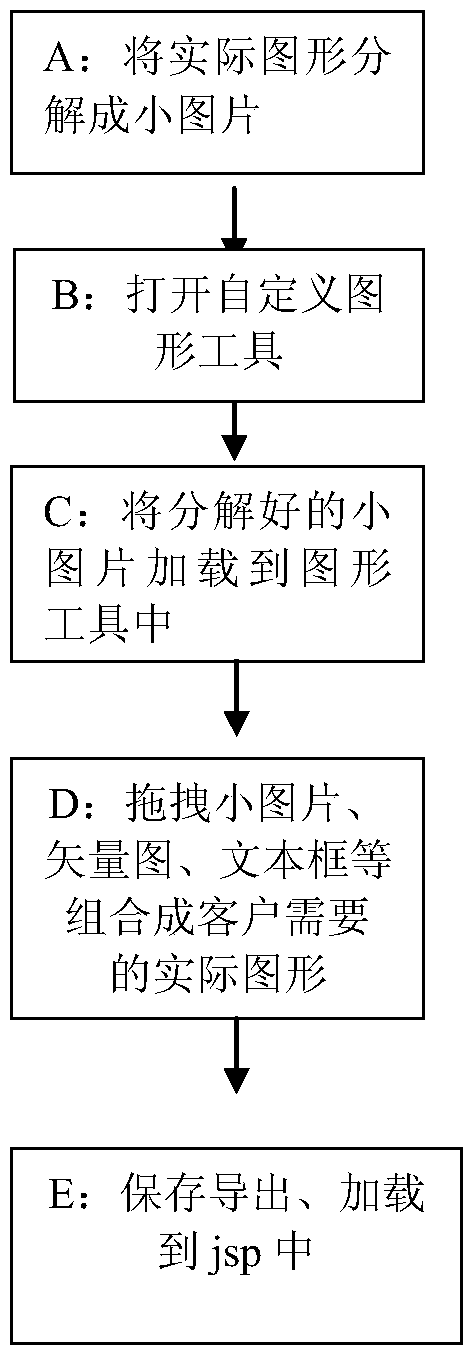
[0024] See attached figure 1 , The self-defined graphic display method of the present invention is realized by JAVA language, including four steps:

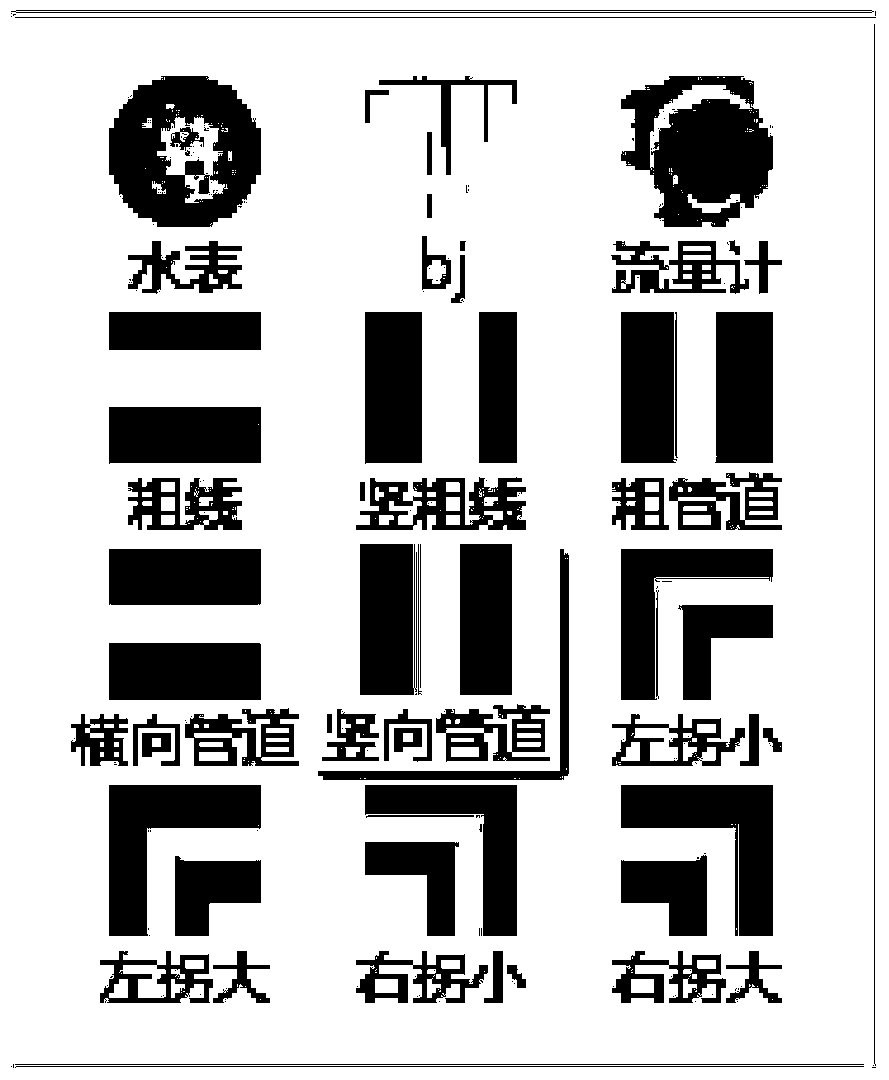
[0025] Step A: Decompose the actual graphics into small pictures;

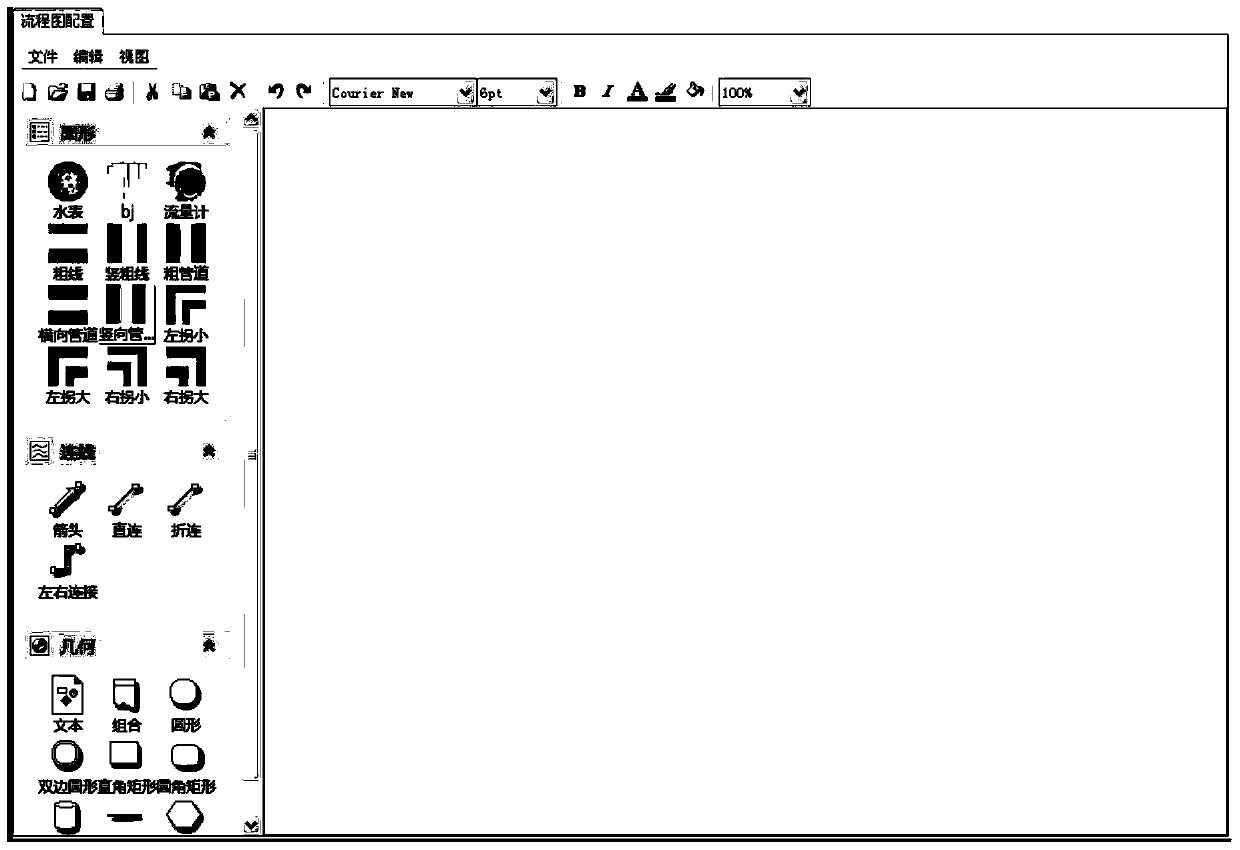
[0026] Step B: Open the custom graphics tool;

[0027] Step C: Load the decomposed small picture into the graphics tool. This step only needs to be configured in xml, such as:

[0028]

[0029]

[0030]

[0031]

[0032]

[0033]

[0034]

[0035]

[0036]

[0037]

[0038] Then use jdom to read XML and load it into the JList on the left side of the tool.

[0039] Step D: Drag and drop small pictures, vector diagrams, text boxes, etc. to form the actual graphics required by the customer. The components of each picture vector and text box are automatically dragged and copied through AWT’...


PUM


Abstract

The invention discloses a custom graph presentation method. The method comprises steps as follows: a real graph is decomposed into small pictures, a custom graph tool is enabled, the decomposed small pictures are loaded into the graph tool, the small pictures, a vector diagram, a text box and the like are dragged to be combined into a real graph required by a client, finally, the real graph is saved, derived out and loaded into jsp, and a user can set sizes, colors, the transparency and borders of the graph and texts in a custom manner and can use copy, attaching, backspacing and recovery functions and the like. The graph can be customized according to changes of service requirements, the operation comprises addition and deletion of controls, equal-proportion scaling, setting of the sizes and the colors of the graph and the texts and the like, a historical graph can be imported, and a new graph can be generated through edition on the basis of the historical graph.

Description

Technical field [0001] The invention relates to the field of computer technology, in particular to a method for displaying custom graphics. Background technique [0002] In the prior art, web applications usually adopt hard-coded methods for real-time monitoring of factories and office flow charts, that is, drawing html on a web page. Each monitored data point is configured with a specific ID, and the corresponding picture or value is refreshed in real time according to the status of the monitored object. [0003] However, this hard-coded method is only applicable to a single factory, and there are cases where there are few monitoring pages in the system, uniform resolution, and no follow-up requirements. In the case of the promotion of many factories, many system monitoring interfaces, and the need to add more monitoring points, it will bring a lot of work and high maintenance costs. In addition, when the resolution changes, the page will appear distorted. [0004] Siemens’ Wincc...

Claims


Application Information

Patent Timeline
IPC IPC(8): G06F17/30
CPCG06F16/168G06F16/986
Inventor 彭连峰
Owner 青岛奥利普奇智智能工业技术有限公司
Why Eureka
Try Eureka