Graphical process variable trend monitoring for a process control system

A process control system and process variable technology, applied in the field of graphic navigation and hierarchical structure, can solve problems such as slow decision-making and incomplete control operators

Active Publication Date: 2015-12-09
FISHER-ROSEMOUNT SYST INC
View PDF4 Cites 2 Cited by
  • Summary
  • Abstract
  • Description
  • Claims
  • Application Information

AI Technical Summary

Problems solved by technology

At too high a level of detail, the operator may only have very little process control information when viewing the P&ID
Alternatively, the operator may have too much detail looking at multiple process variable trend graphs, trying to compare current process variable values ​​to set point information, etc.
Additionally, detailed information sources may

Method used


Image

  • Graphical process variable trend monitoring for a process control system
  • Graphical process variable trend monitoring for a process control system
  • Graphical process variable trend monitoring for a process control system

Examples


Embodiment Construction

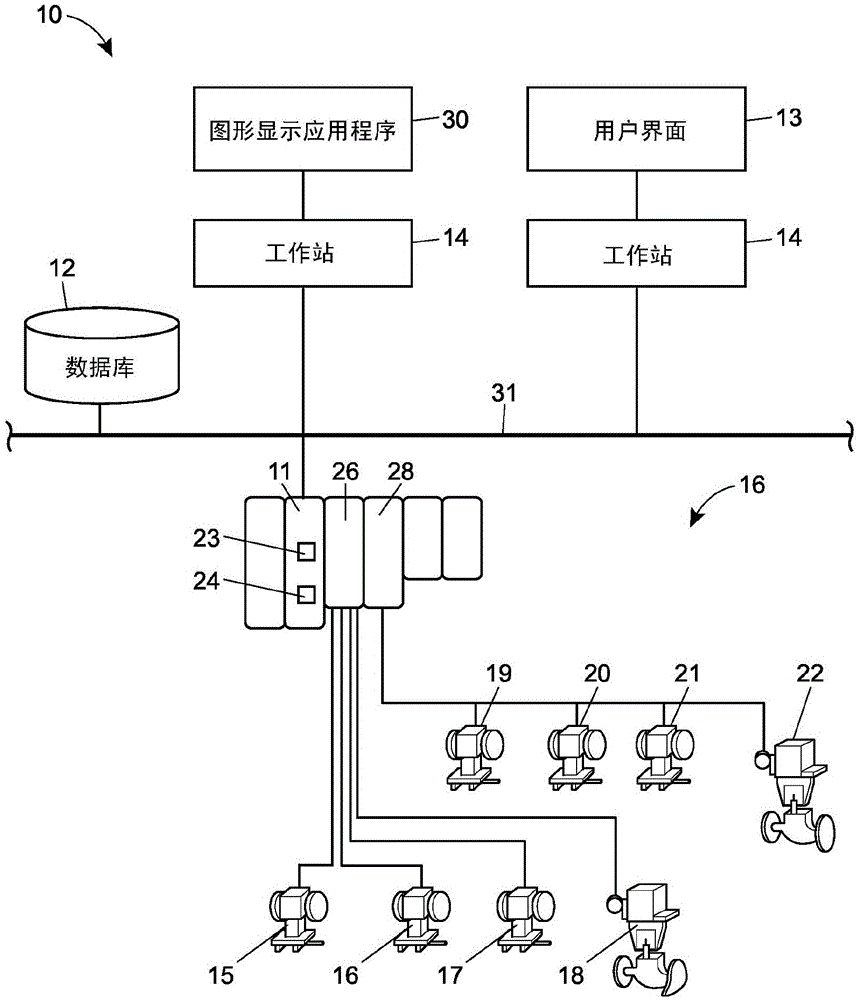
[0037] figure 1 The process control monitoring system 10 shown in can be used to implement and display the graphical trend symbols described herein, and the process control monitoring system 10 includes a connection to a database 12 and one or more The process controller 11 is a host workstation or computer 14 (which may be any type of personal computer, workstation, etc.). Each workstation 14 may include memory for storing a plurality of applications including, for example, graphics display application 30 , and may be communicatively coupled to user interface 13 . Controller 11 is also connected to field devices 15 - 22 via input / output (I / O) cards 26 and 28 . Database 12 may be any desired type of data collection unit having memory and any desired or known software, hardware or firmware for storing data. System 10 may also store process variable values ​​or process variable data within database 12 for use in generating and subsequently displaying graphical trend symbols to...


PUM


Abstract

A process control monitoring system for a process control plant uses graphic trend symbols to assist in detecting and monitoring trends of process variables within the process control plant. A graphic display application within the process control monitoring system may implement and display each graphic trend symbol to graphically indicate or encapsulate current trend and value information of a process variable within the process control plant. The graphic display application may display the graphic trend symbol in a spatially realistic location within a graphical representation of the process control plant while maintaining the hierarchical structure or each hierarchical level of the process plant. The graphic display application may also include a zoom feature that enables a user to quickly drill down through tend data to obtain more information and to support problem identification and diagnosis tasks.

Description

technical field [0001] The present disclosure relates generally to process control systems and, more particularly, to monitoring trends of process variables and hierarchical, graphical navigation of process control plants. Background technique [0002] Process plants such as those used in the chemical, petroleum, or other industries typically include one or more centralized or decentralized process controllers communicatively coupled via an analog, digital, or combined analog / digital bus to at least one A host or operator workstation and one or more process control and instrumentation devices, such as field devices. Field devices, which may be, for example, valves, valve positioners, switches, transmitters, and sensors (eg, temperature, pressure, and flow rate sensors) perform functions such as increasing or decreasing fluid flow and measuring process parameters in a process. The process controller receives signals indicative of process measurements or process variables mad...

Claims


Application Information

Patent Timeline
IPC IPC(8): G05B23/02
CPCG05B23/0216G06F3/0484G05B19/418G06F3/04817
Inventor M·J·尼克松M·B·库克D·L·马内斯H·S·斯莫尔曼
Owner FISHER-ROSEMOUNT SYST INC
Why Eureka
Try Eureka