Data display method and system based on sap platform

A data display and platform technology, applied in the field of data display methods and systems based on the SAP platform, can solve the problems of single report and chart styles, poor real-time data, and insufficient aesthetics, etc., to achieve effective data analysis and synchronization Update and interact with real-time effects

Active Publication Date: 2019-02-01
STATE GRID SHANDONG ELECTRIC POWER +2
View PDF5 Cites 0 Cited by
  • Summary
  • Abstract
  • Description
  • Claims
  • Application Information

AI Technical Summary

Problems solved by technology

[0004] When presenting reports or charts in the existing SAP system, the supported reports and charts are of a single style, and the aesthetics are not good enough; although when displayed on the EP (enterprise portal) side through BI (business intelligence), the provided reports and charts The aesthetics of the chart style has been improved, but the real-time performance of the data is not good, and the synchronous update of the data cannot be realized in a timely and accurate manner

Method used


Image

  • Data display method and system based on sap platform
  • Data display method and system based on sap platform

Examples


Embodiment Construction

[0034] Below in conjunction with accompanying drawing and embodiment the present invention will be further described:

[0035] API: Application Program Interface (API: Application Program Interface);

[0036] ABAP: Advanced Business Application Programming (Advanced Business Application Programming);

[0037] HTML: Hypertext Markup Language (Hypertext Markup Language);

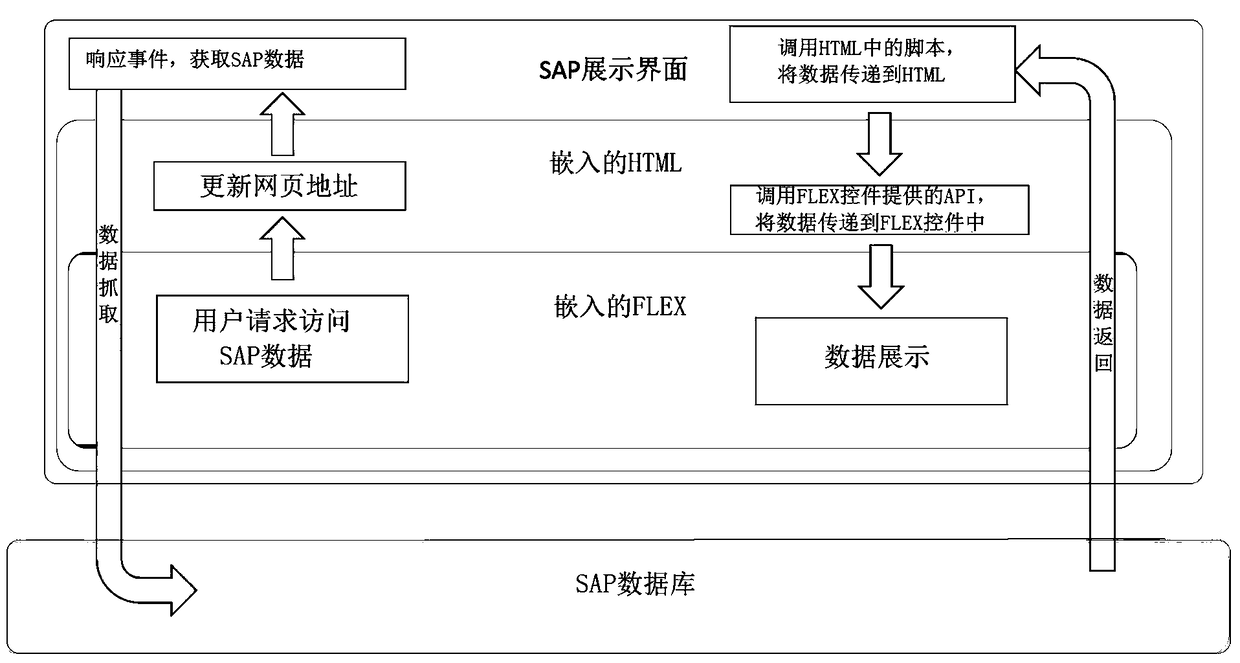
[0038] FLEX controls are the basic elements of the user interface. Using these controls, users can easily realize the visual display of data reports or charts.

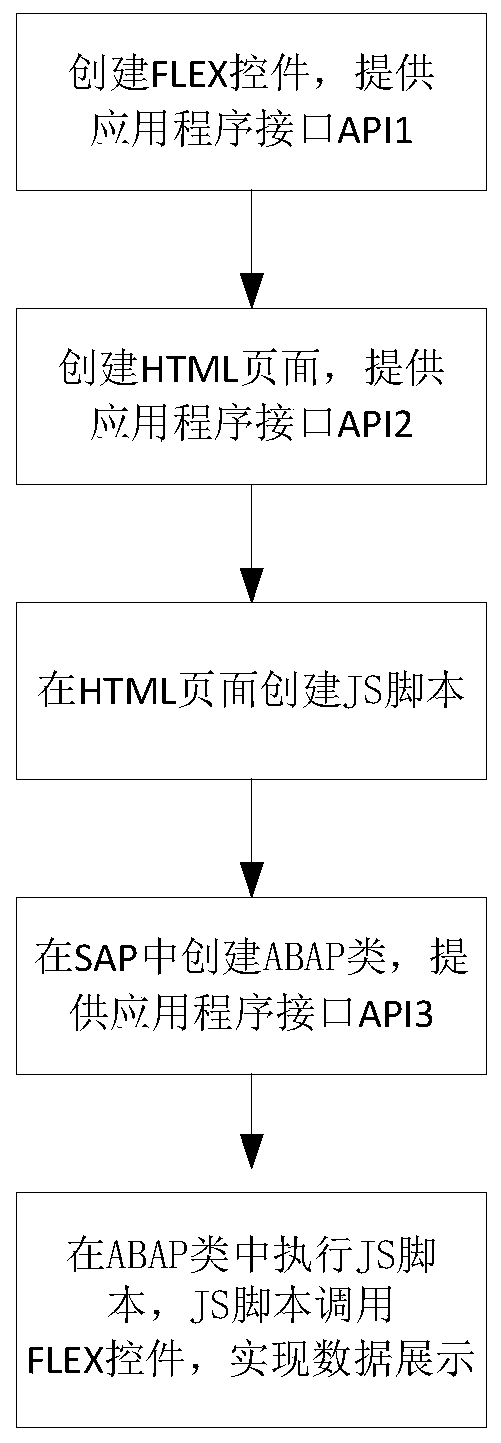
[0039] The data display method based on the SAP platform is as follows: figure 1 shown, including the following steps:

[0040] Step 1. Create various types of FLEX controls through FlashBuilder or other editors, such as pie charts, line charts, histograms, scatter plots, grid charts, etc., and provide APIs for data binding and interface control.

[0041] Step 2. According to the specific report or chart business requirements, create an HTML page,...


PUM


Abstract

The invention discloses an SAP (systems applications and products) platform based data display method and system. The method comprises: creating a FLEX control and providing an application program interface API1; creating a corresponding HTML page and providing an application program interface API2; creating a JS script used for operating the FLEX control in the HTML page, creating a class through an advanced business application programming language ABAP in SAP, and providing an application program interface API3; and executing the JS script in the HTML page in the ABAP class, and calling the API provided by the FLEX control through the JS script to display corresponding data in the SAP in the form of the FLEX control. The SAP platform based data display method and system have the beneficial effects that the HTML page is integrated with the SAP and the Flex is integrated with the HTML page, so that data of an SAP system are subjected to chart display through the Flex, synchronous updating and real-time interaction of data in a Flex page and an SAP client are realized, and users can perform more intuitive and more effective data analysis conveniently.

Description

technical field [0001] The invention relates to the display field of reports or graphs, in particular to a data display method and system based on an SAP platform. Background technique [0002] SAP (systems applications and products in data processing) is a software for enterprise resource planning (ERP) (enterprise resource planning) management. [0003] SAP provides the secondary development language ABAP / 4 (advanced business application programming), and users can use ABAP language for system development through SAP's internal development platform. These include the data transfer between the SAP system and external systems, the production of reports, and the import and export of data, etc. [0004] When presenting reports or charts in the existing SAP system, the reports and charts supported are single in style, and the aesthetics are not good enough; although the reports and charts provided are displayed on the EP (enterprise portal) side through BI (business intelligen...

Claims


Application Information

Patent Timeline
Patent Type & Authority Patents(China)
IPC IPC(8): G06F8/30
Inventor 林以东王小东段可莹杨军李锋靳占新程祥李红梅田兵李冬王勇朱璐于秋生张继峰孙丽丽王承远丁书耕王立峰董文杰戚鲁凤
Owner STATE GRID SHANDONG ELECTRIC POWER
Why Eureka
Try Eureka