Trend graph display method and device
A display method and a display device technology, which are applied in special data processing applications, instruments, electrical digital data processing, etc., can solve problems such as weakening the intuitiveness of charts, and achieve the effect of improving intuitiveness
- Summary
- Abstract
- Description
- Claims
- Application Information
AI Technical Summary
Problems solved by technology
Method used
Image

Examples
Embodiment Construction
[0052] It should be understood that the specific embodiments described here are only used to explain the present invention, not to limit the present invention.
[0053] Based on the above problems, the present invention provides a trend graph display method.
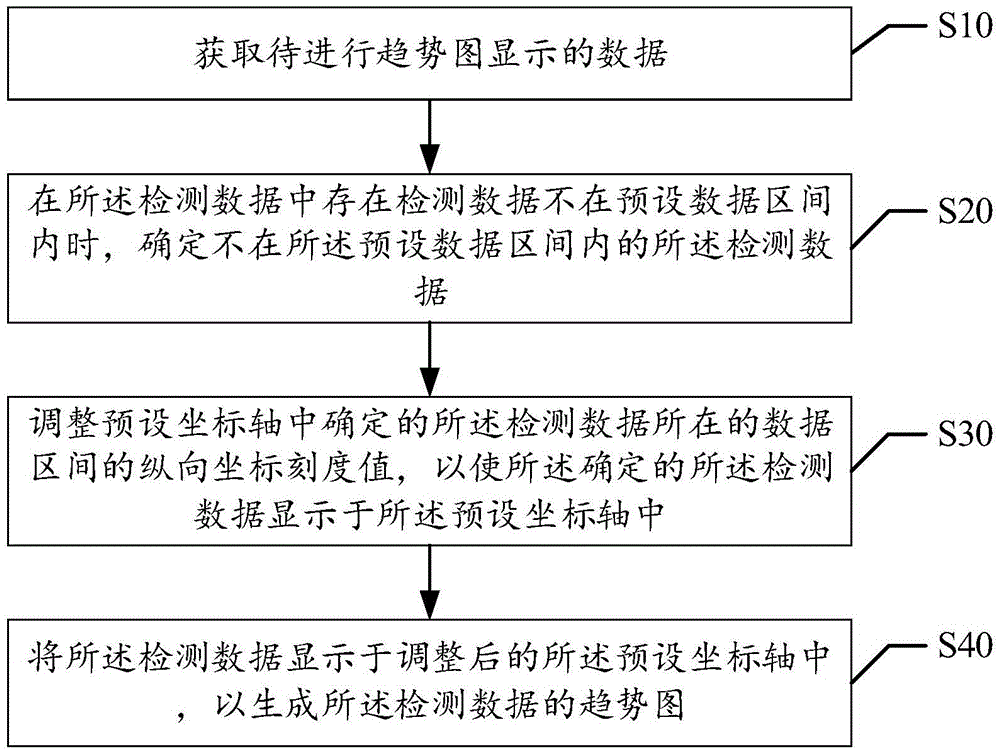
[0054] refer to figure 1 , figure 1 It is a schematic flowchart of the first embodiment of the method for displaying a trend graph in the present invention.
[0055] In this embodiment, the trend graph display method includes:
[0056] Step S10, acquiring detection data to be displayed in a trend graph;
[0057]The detection data to be displayed in the trend graph can be the data in the database, the data in the excel table, or the data recorded in other data tools. In this embodiment, the detection data is preferably medical physiological detection data, such as diastolic blood pressure, systolic blood pressure, pulse, body temperature, respiration, urine output, platelet count changes, white blood cells and hemoglo...
PUM
 Abstract
Description
Claims
Application Information
 - R&D Engineer
- R&D Manager
- IP Professional
- Industry Leading Data Capabilities
- Powerful AI technology
- Patent DNA Extraction
Browse by: Latest US Patents, China's latest patents, Technical Efficacy Thesaurus, Application Domain, Technology Topic.
© 2024 PatSnap. All rights reserved.Legal|Privacy policy|Modern Slavery Act Transparency Statement|Sitemap