Big data-based visualization realization method

An implementation method and big data technology, applied in the field of WEB development, can solve the problems of no distinction between the definition period and the running period, low security, information leakage, etc., to avoid excessive dependence, improve versatility, and improve security.

Inactive Publication Date: 2017-03-22
INSPUR QILU SOFTWARE IND
View PDF5 Cites 23 Cited by
  • Summary
  • Abstract
  • Description
  • Claims
  • Application Information

AI Technical Summary

Problems solved by technology

[0003] In the process of realizing the present invention, it is mainly found that the existing visualization implementation has at least the following defects: 1) in the process of obtaining data, the physical table is directly queried by assembling sql statements, resulting ...

Method used


Image

  • Big data-based visualization realization method
  • Big data-based visualization realization method
  • Big data-based visualization realization method

Examples


Embodiment Construction

[0048] The content of the present invention is described in more detail below:

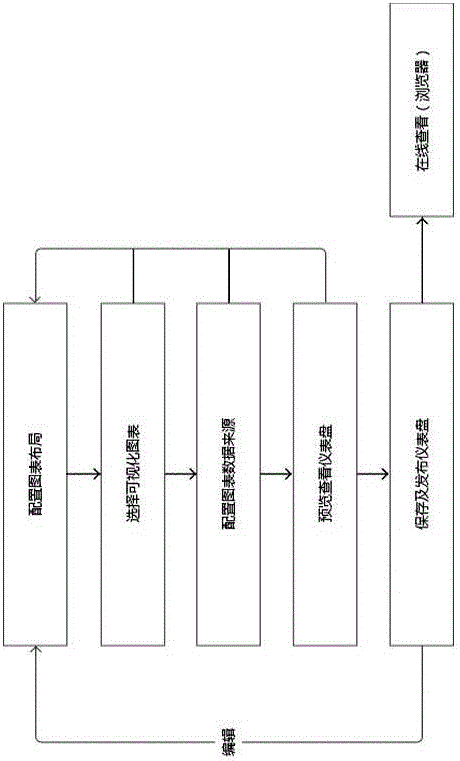
[0049] A big data visualization implementation method provided by the present invention mainly involves two processes of definition period and operation period, and the specific implementation method is as follows:

[0050] 1. Definition period

[0051] This step mainly implements page creation and data binding. The page production mainly includes the design and configuration of page layout, chart selection and query box and other components. The specific implementation steps are as follows:

[0052] Step 1: first drag and drop a suitable component target to enter the dashboard design page, and obtain the type of the dragged component, such as layoutType="col", the component types provided by the present invention mainly include layout components, chart components, text boxes, and query boxes Wait;

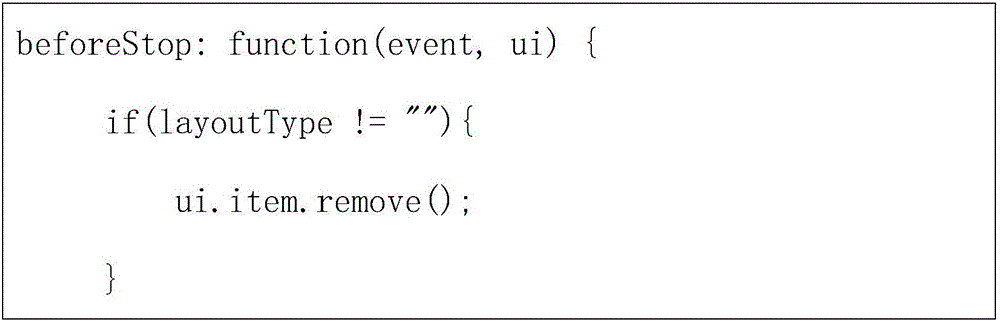
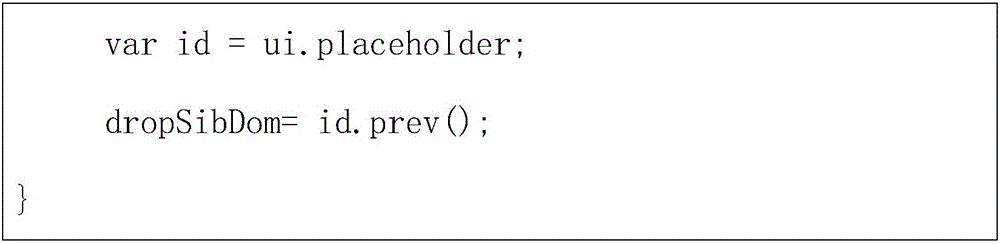
[0053] Step 2: Obtain the placement location of the target component target. First, according ...


PUM


Abstract

The invention provides a big data-based visualization realization method and relates to the technical field of WEB development. According to the method, page making and data binding are realized in a definition period, wherein the page making is finished by mainly adopting a dragging interactive mode, and the whole process mainly comprises page layout, chart selection and configuration of components such as a query box and the like; and for the data binding, data and chart binding is mainly finished. For a running period, secondary query and shared viewing of charts are mainly finished. The method powerfully supports managers to make business decisions, and core competitiveness is improved.

Description

technical field [0001] The invention relates to the technical field of WEB development, in particular to a method for realizing visualization based on big data. Background technique [0002] With the advent of the era of big data applications, the data is not only large in volume and variety, but also requires strong real-time performance, and the value contained in the data is great. Big data exists in all walks of life, but the numerous information and consultations are complicated, and it is difficult for us to analyze, generalize and summarize its deep laws only through data analysis. Therefore, how to mine the value of big data has become the focus of our research. As one of the most acceptable and comprehensible ways for human beings, graphics are naturally combined with data, thus forming a new research field such as data visualization, and also providing a new way of displaying data. [0003] In the process of realizing the present invention, it is mainly found tha...

Claims


Application Information

Patent Timeline
IPC IPC(8): G06F17/30G06F9/44
CPCG06F16/34G06F9/451G06F16/26
Inventor 魏静如玄德林森
Owner INSPUR QILU SOFTWARE IND
Why Eureka
Try Eureka