Rapid application method and system of data visualization graphs

An application method and application system technology, applied in the field of fast application method and system of data visualization graphics, can solve problems such as long cycle, huge development cost, poor compatibility, etc., and achieve the effect of simplifying implementation and simplifying difficulty

Inactive Publication Date: 2017-09-29
GUANGDONG ESHORE TECH
View PDF5 Cites 9 Cited by
  • Summary
  • Abstract
  • Description
  • Claims
  • Application Information

AI Technical Summary

Problems solved by technology

The entire development cost is huge, the cycle is long, the compatibility is not good, and the scalability is poor

Method used


Image

  • Rapid application method and system of data visualization graphs
  • Rapid application method and system of data visualization graphs

Examples


Embodiment Construction

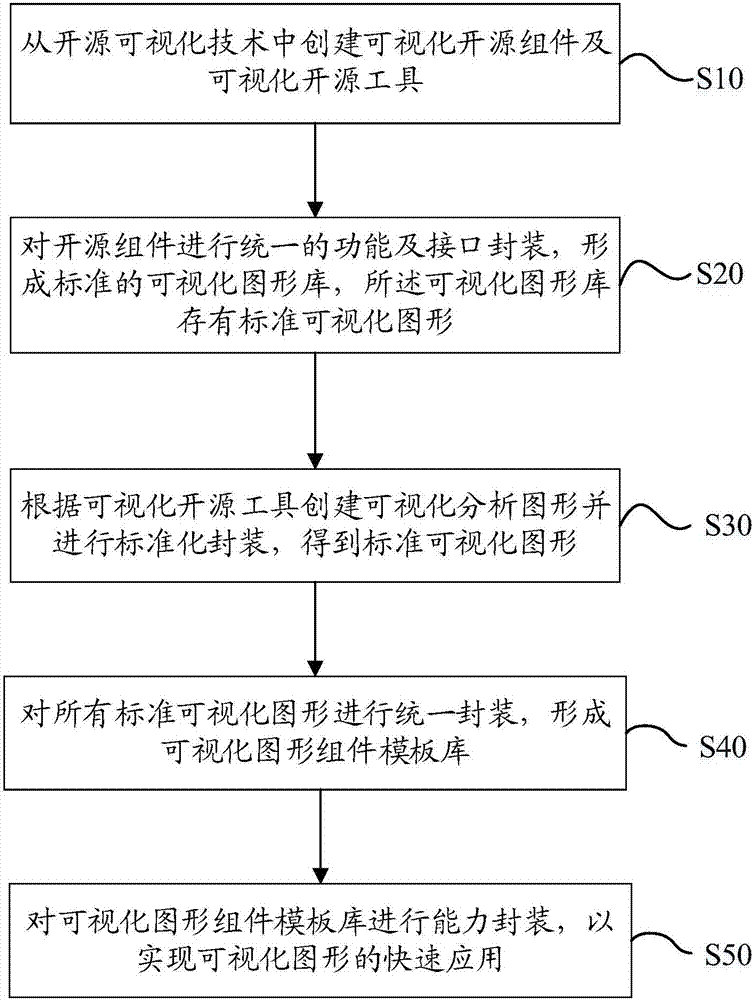
[0047] The following will clearly and completely describe the technical solutions in the embodiments of the present invention with reference to the accompanying drawings in the embodiments of the present invention. Obviously, the described embodiments are only part of the embodiments of the present invention, not all of them. Based on the embodiments of the present invention, all other embodiments obtained by persons of ordinary skill in the art without creative efforts fall within the protection scope of the present invention.

[0048] It should be noted that the descriptions involving "first", "second" and so on in the present invention are only for the purpose of description, and should not be understood as indicating or implying their relative importance or implicitly indicating the quantity of the indicated technical features. Thus, the features defined as "first" and "second" may explicitly or implicitly include at least one of these features. In addition, the technical ...


PUM


Abstract

The invention discloses a rapid application method and system of data visualization graphs. The rapid application method of data visualization graphs includes the following steps that visualization open-source components and visualization open-source tools are created in an open-source visualization technology; unified function and interface encapsulation is conducted on the open-source components to form a standard visualization graph library, wherein standard visualization graphs are stored in the visualization graph library; visualization analysis graphs are created according to the visualization open-source tools, and standardized encapsulation is conducted to obtain standard visualization graphs; unified encapsulation is conducted on all the standard visualization graphs to form a visualization graph component template library; capacity encapsulation is conducted on the visualization graph component template library to achieve rapid application of the visualization graphs. By means of the technical scheme, the difficulty of implementation of big data visualization graphs is greatly lowered, the application efficiency and effect of visualization graphs are improved, and the threshold of applying big data visualization by enterprises is lowered.

Description

technical field [0001] The invention relates to the technical field of data processing, in particular to a method and system for fast application of data visualization graphics. Background technique [0002] At present, data visualization technology mainly uses graphical means to clearly and effectively convey and communicate information to help users understand. At present, it is mainly used in data management, data analysis, data mining, information representation and other fields. In the past, the graphical representation of data only stayed in simple visual representations such as pie charts, histograms, and histograms. With the development of the Internet, the Internet of Things, cloud computing, big data and other technologies are developing rapidly, the requirements for data visualization are also getting higher and higher. [0003] In the traditional data visualization scheme, the choice of visual graphics is very limited. Most of them can only meet simple visual e...

Claims


Application Information

Patent Timeline
Patent Type & Authority Applications(China)
IPC IPC(8): G06F9/44
CPCG06F8/34
Inventor 余虎王军陈追平郭记南
Owner GUANGDONG ESHORE TECH
Why Eureka
Try Eureka